This page has been updated to include the
Canadian data [link],
UK data [link] Swedish data [link],
Scottish data [link],
Northern Irish data [link],
Irish data [link] and
Australia data [link].
CANADA - WAS IT PLANNED?
HOW CANADA DIES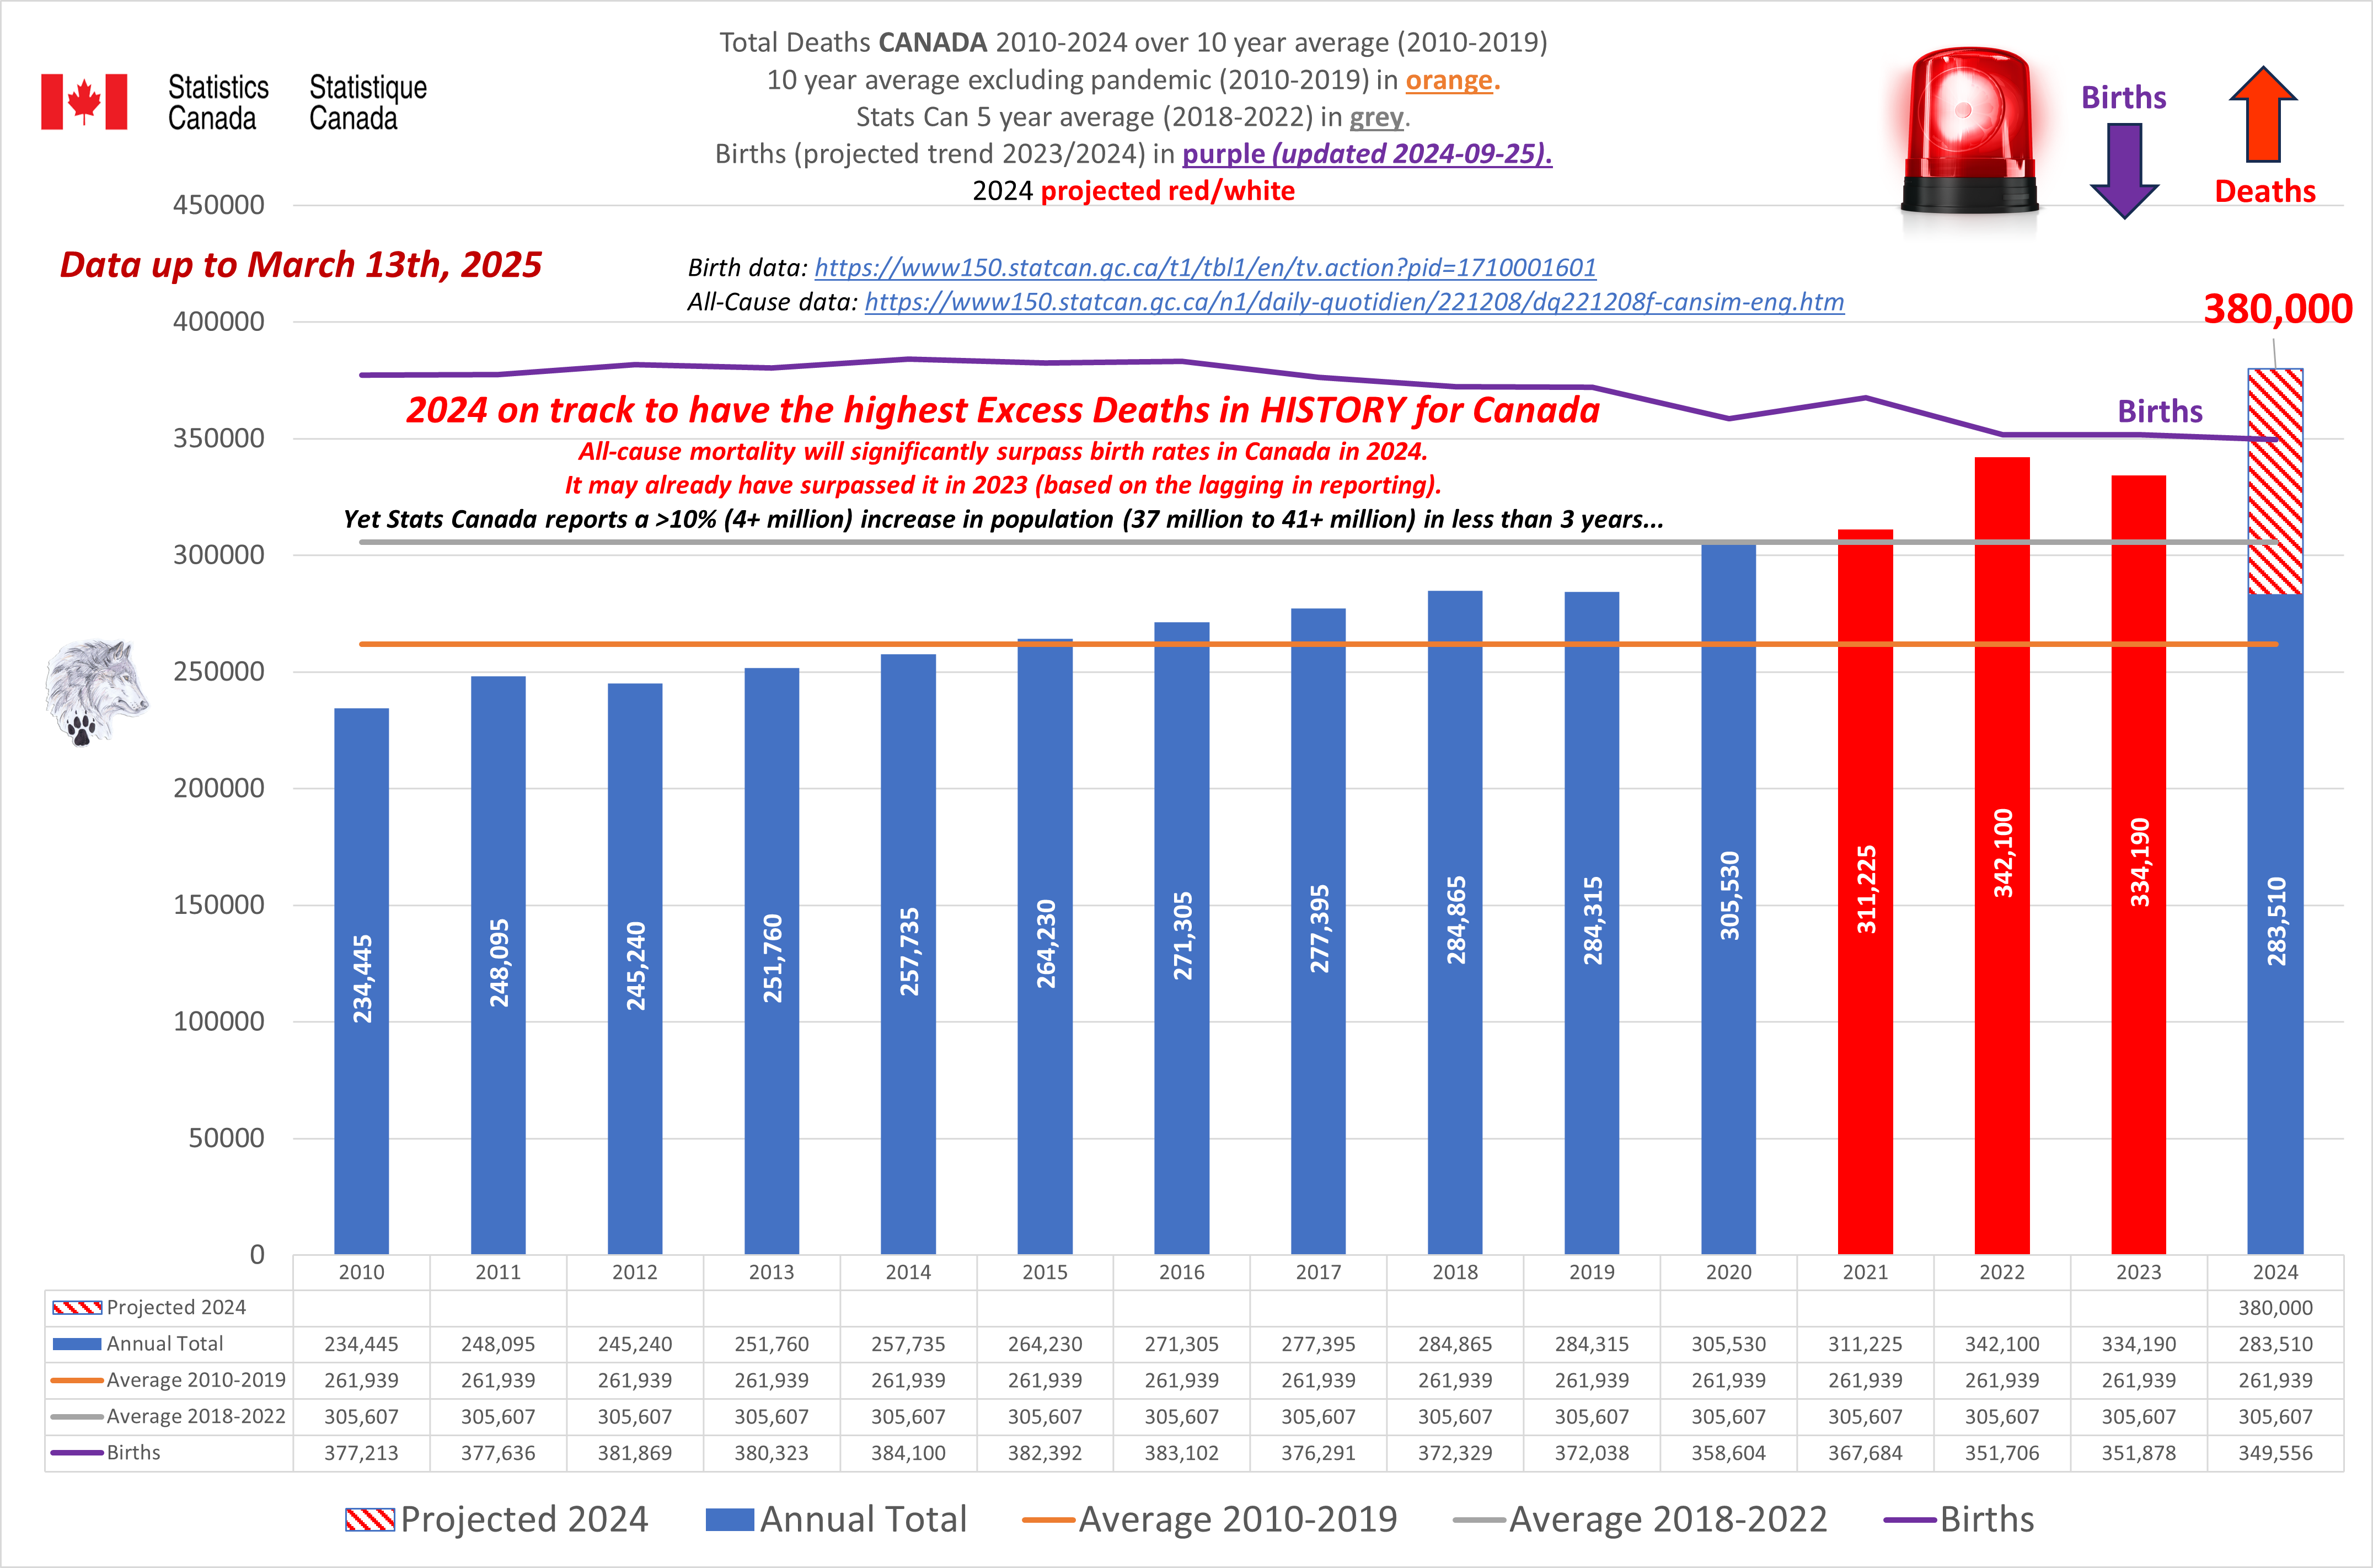 |
Released: 2019-09-30
Sustainable Development Goals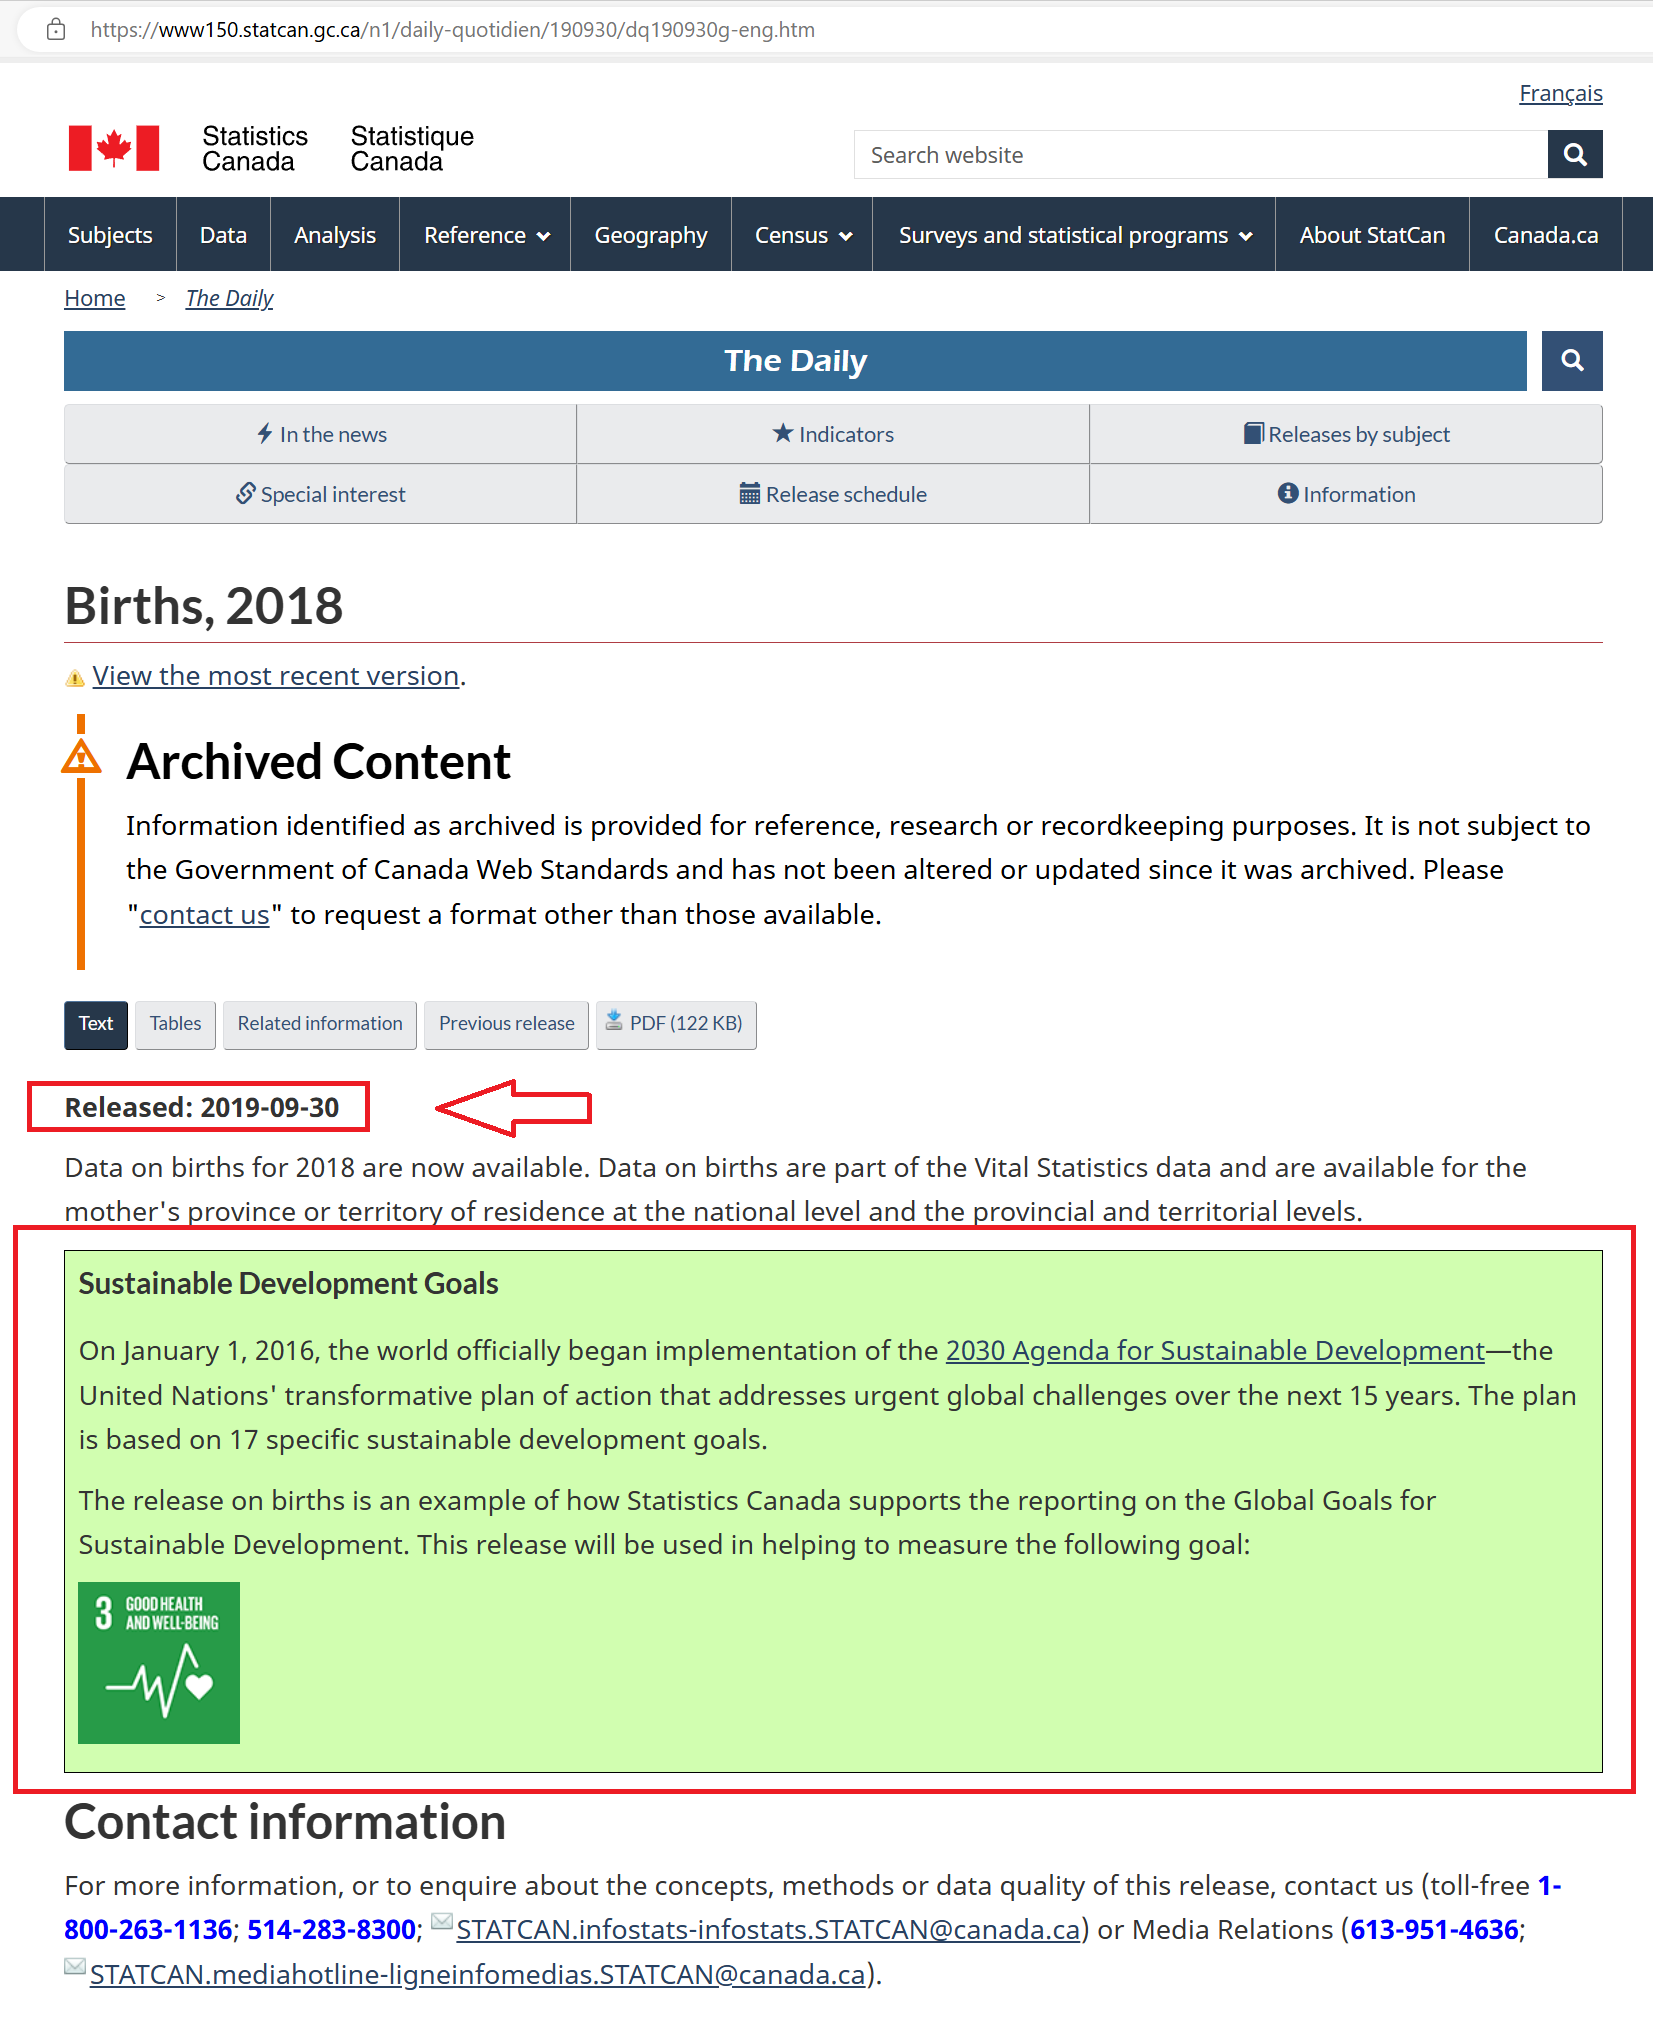 |
These are not deaths being driven by immigration or the “baby boomers”.
We are not importing terminally sick people or dead bodies. On top of this, immigrants are more likely to have larger direct family groups (children).
Without immigration, the true extent of the death of Canada (and other countries worldwide) since 2020 is truly terrifying.
Is there a plan?
How they hide the true horror of escalating Excess Deaths.
Excess Deaths - ONS NEWSPEAK
 The following charts show the numerous ways to define an Excess Death.
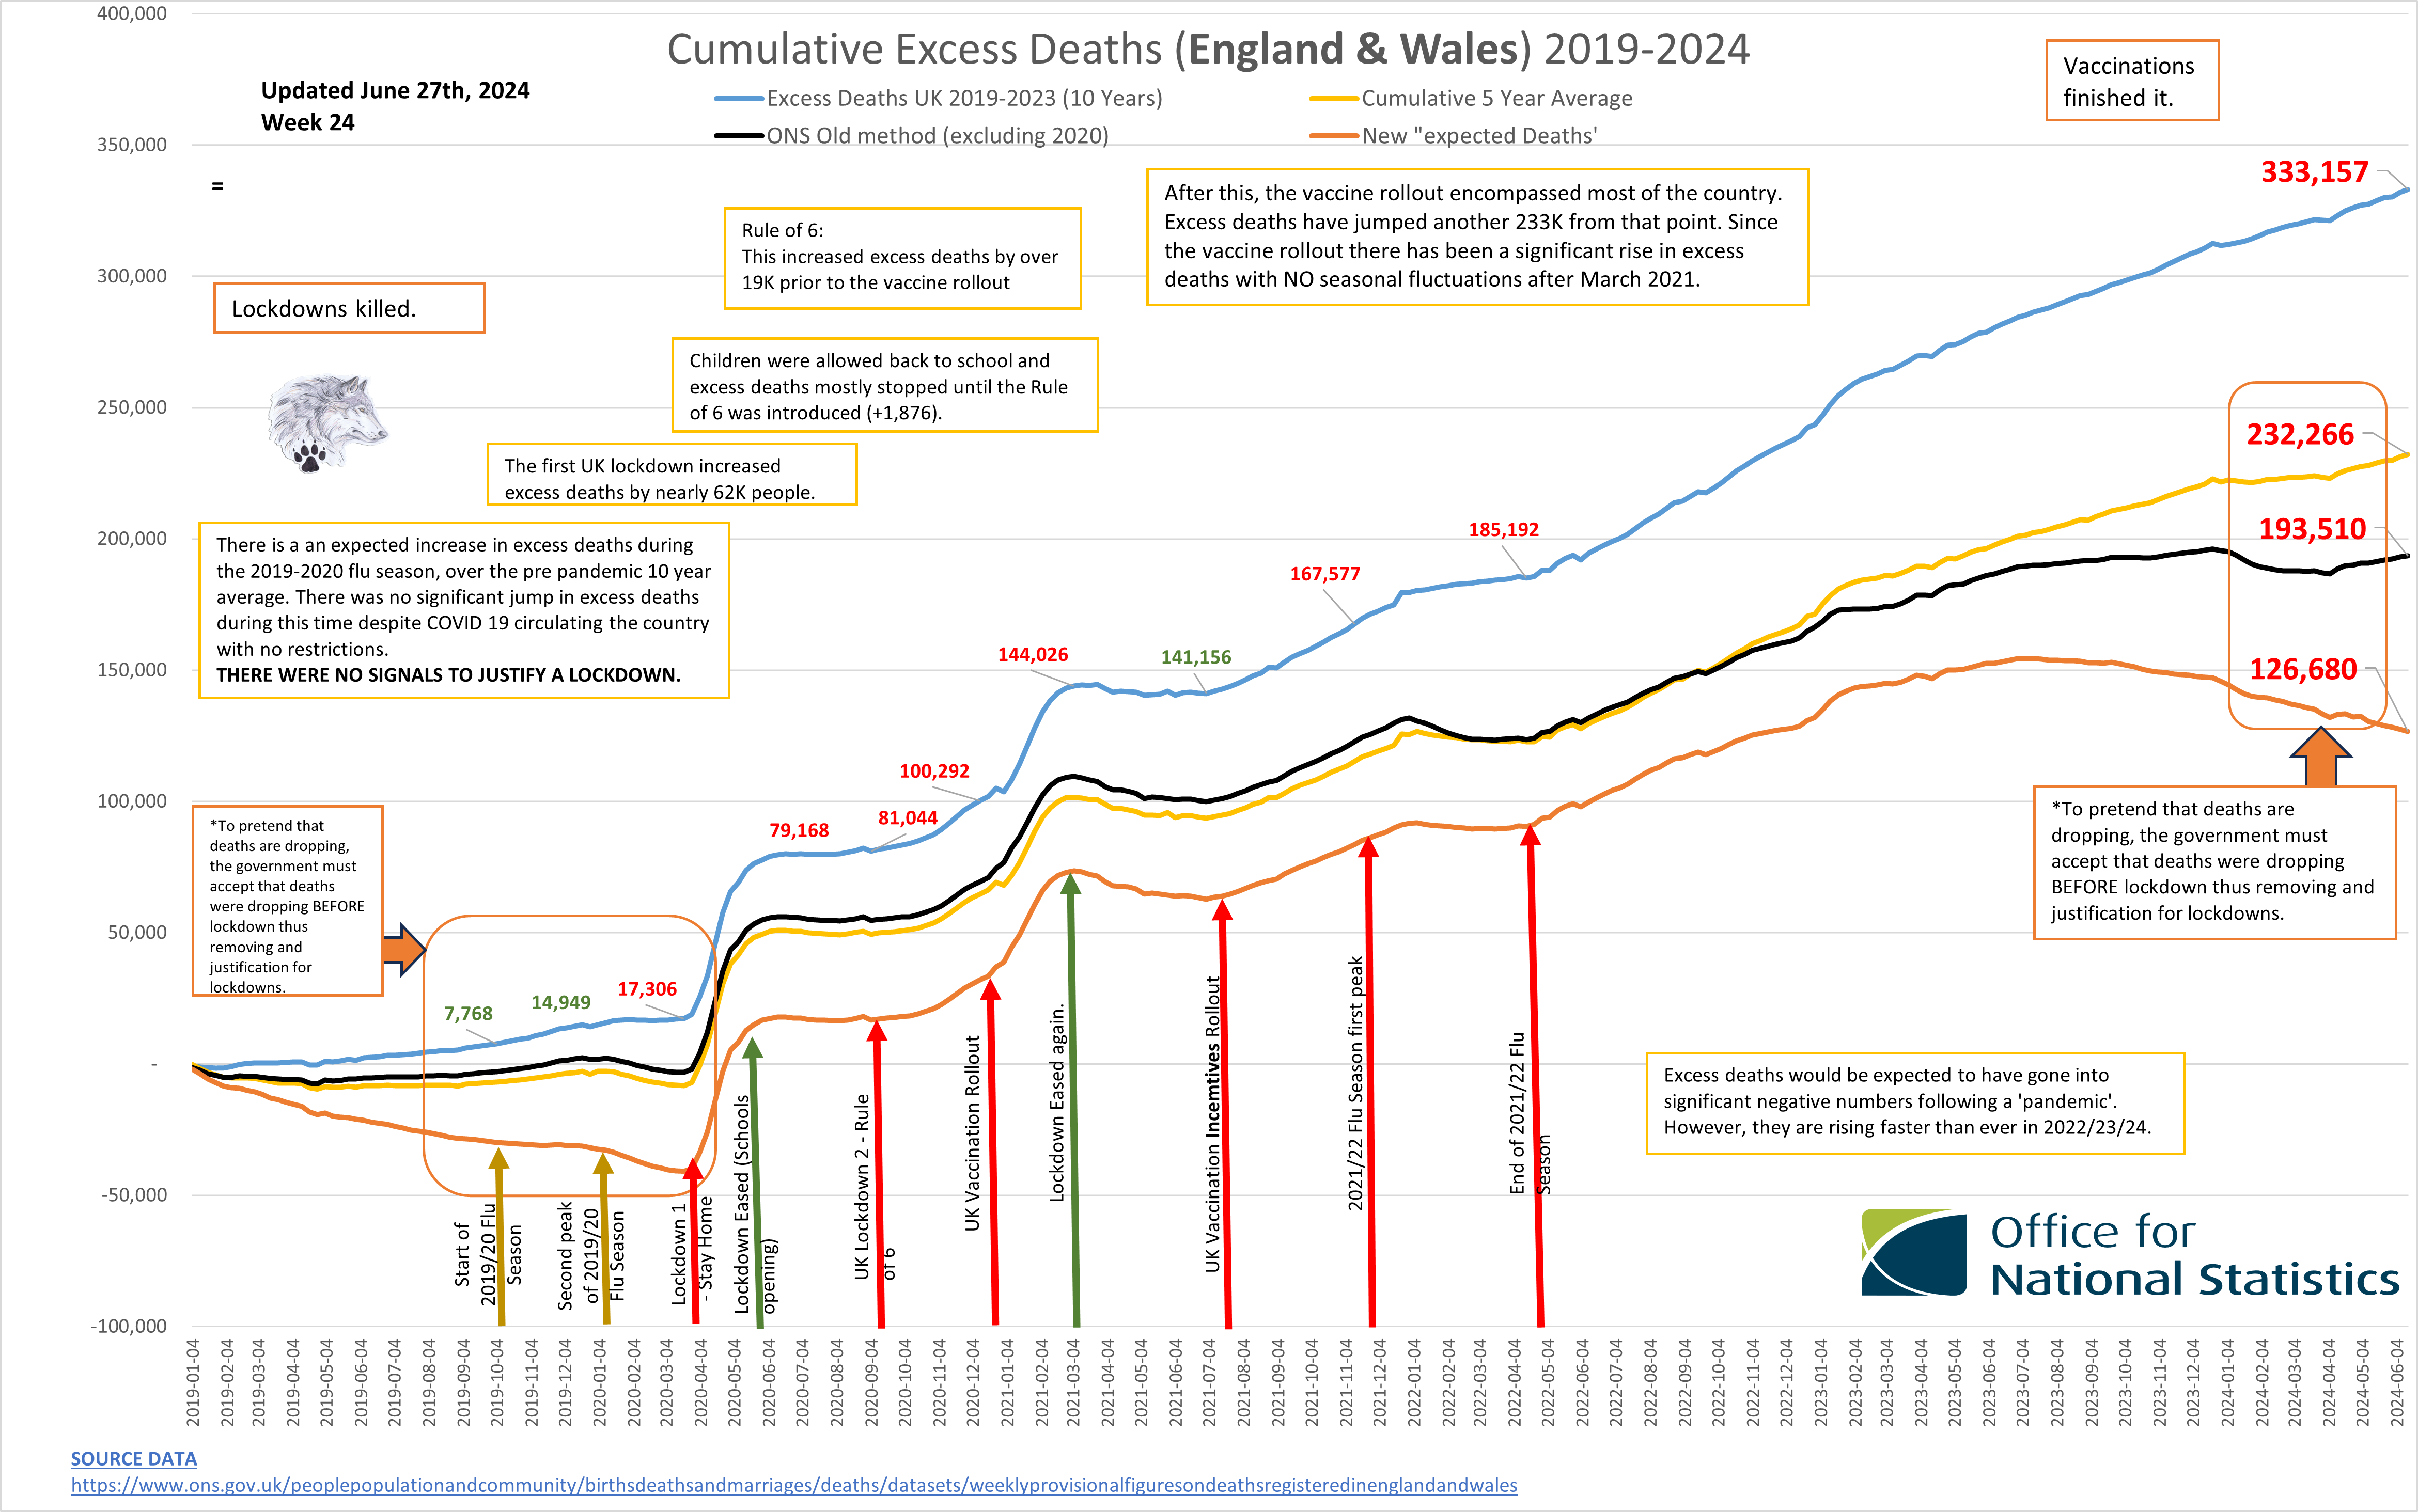
1. 10-year pre pandemic weekly average. This shows a slight increase in Excess Deaths during the 2019/2020 flu season
(normal at around 10K increase) followed by an explosion in excess deaths that currently sits at 346,213 and growing.
2. 5-year pre pandemic weekly average. This shows a slight decrease in Excess Deaths during the 2019/2020 flu season
(normal for a low mortality flu year at around 10,000 decrease) followed by an explosion in excess deaths that currently sits at 229,821 and growing.
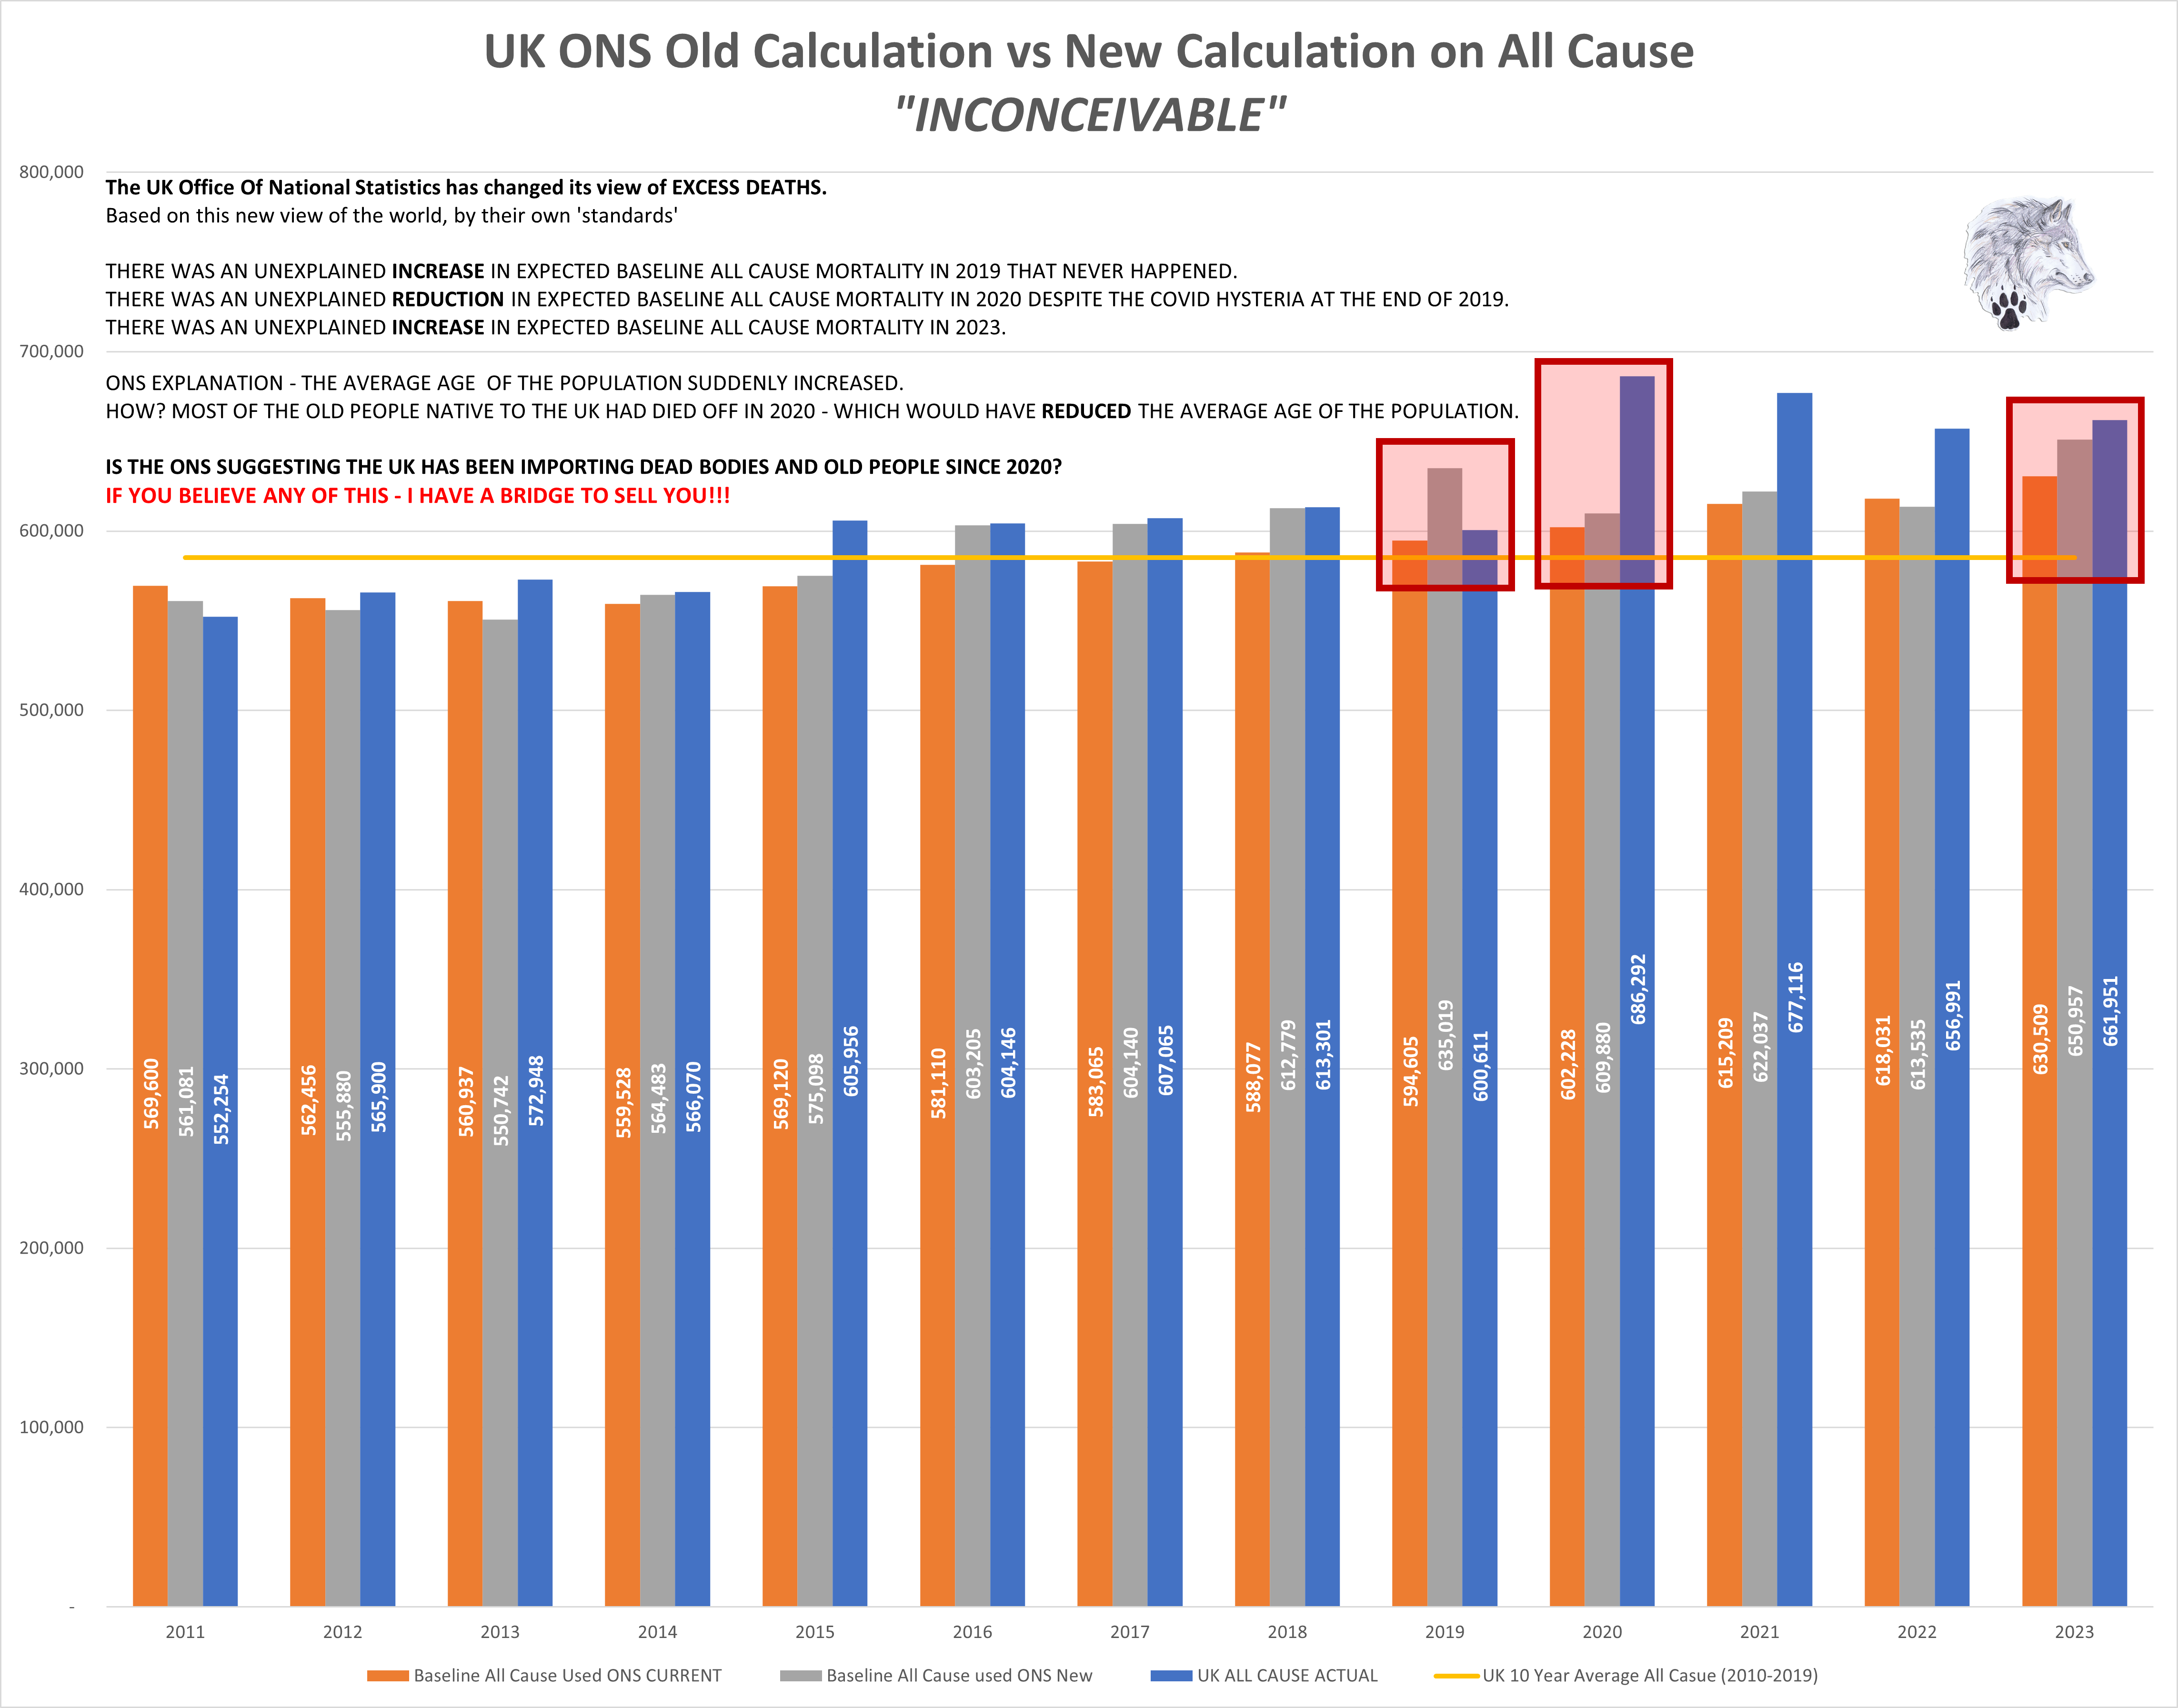
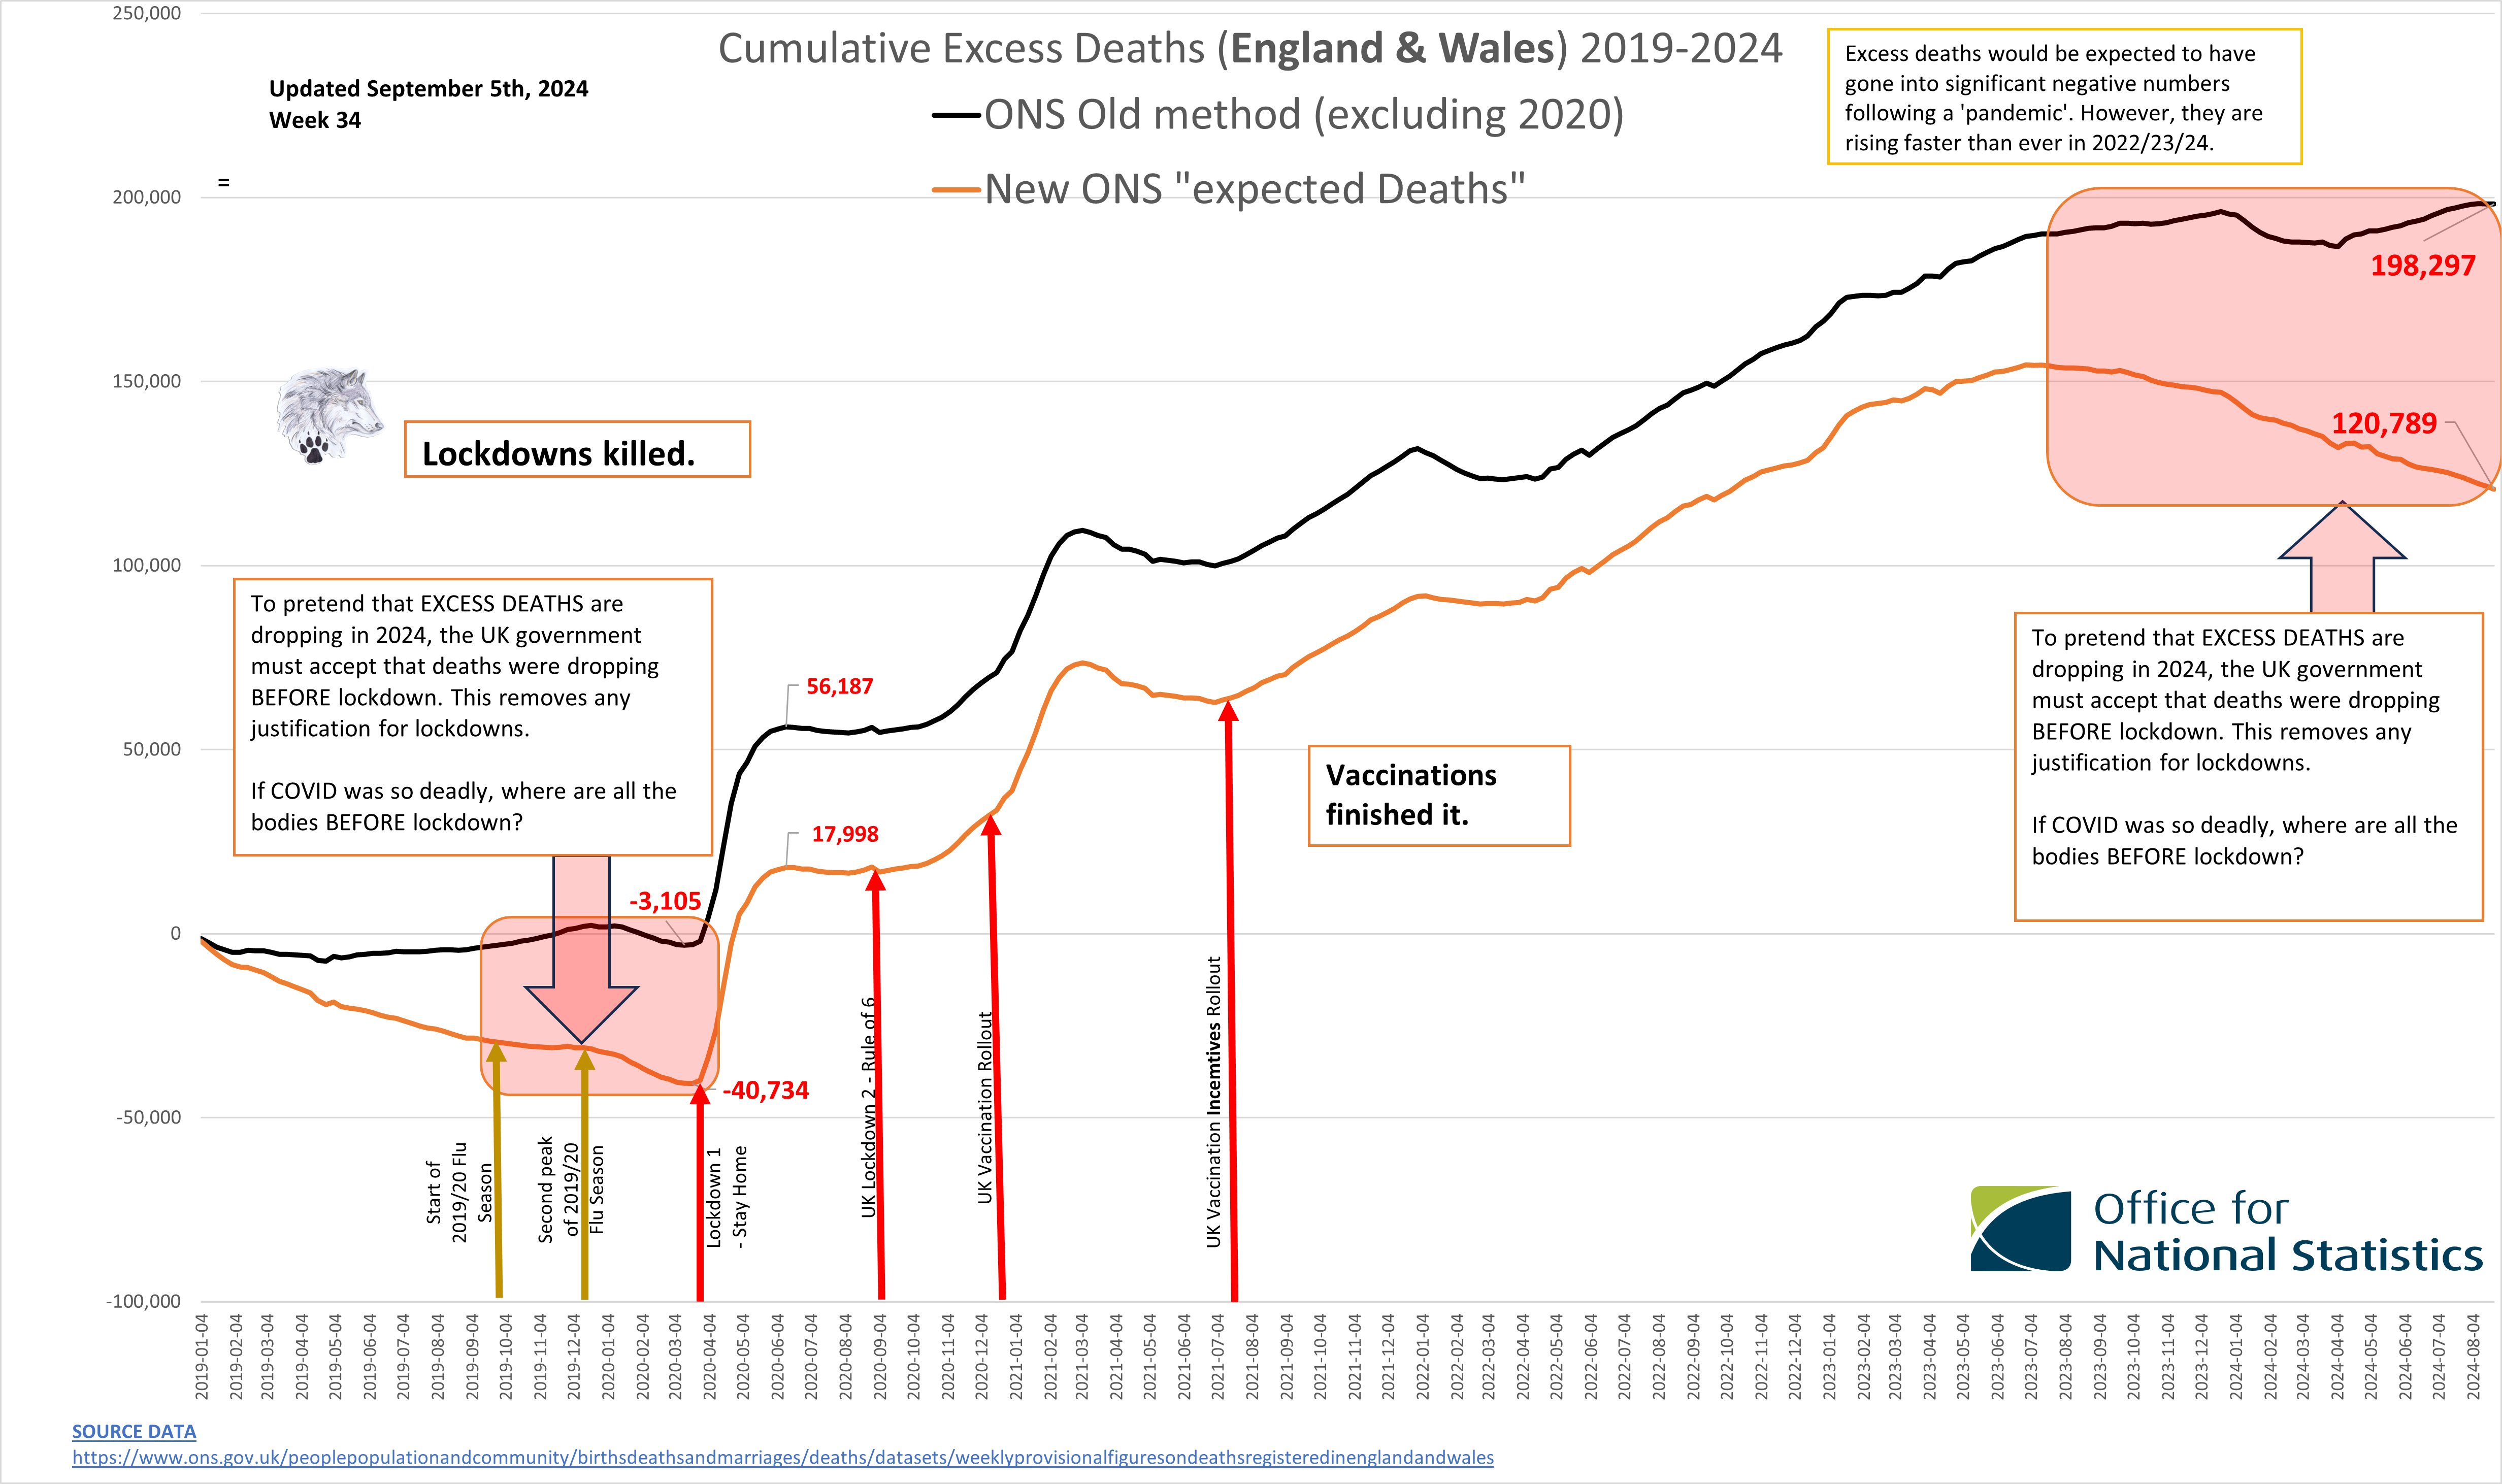
3. ONS old formula
(rolling 5 years, excluding 2020 as an 'outlier'). This shows a slight increase in Excess Deaths during the 2019/2020 flu season
(normal at around 1,400 decrease) followed by an explosion in excess deaths that currently sits at 191,984 and growing.
4. New ON formula
(designed to hide the current excess deaths). This shows an ongoing significant decrease in Excess Deaths during the 2019/2020 flu season, continuing the downward trend
(11,000 decrease sitting at minus 41K in excess deaths at the start of lockdown). This is followed by an explosion in excess deaths that currently sits at 128,939.
The 10 year trend was showing an expected drop in Excess Deaths. This is shown to some extent in all methods opf calculation. However, all calculations show that the initial significant spike in Excess Deaths happened AFTER lockdown. This is repeated worldwide.
The problem that the UK ONS has created for itself in retroactively manipulating the data to fit a narrative is that in this case they now have to explain when Excess Death trends were showing a marked decrease in Excess Deaths before they triggered the lockdowns and then a subsequent explosion of all-cause deaths, not seen before. In fact, all formula's show around 60-70 thousand EXCESS DEATHS in the first three months of lockdown. This is the equivalent to ALL civilian deaths in the UK during World War II.
back to top of page
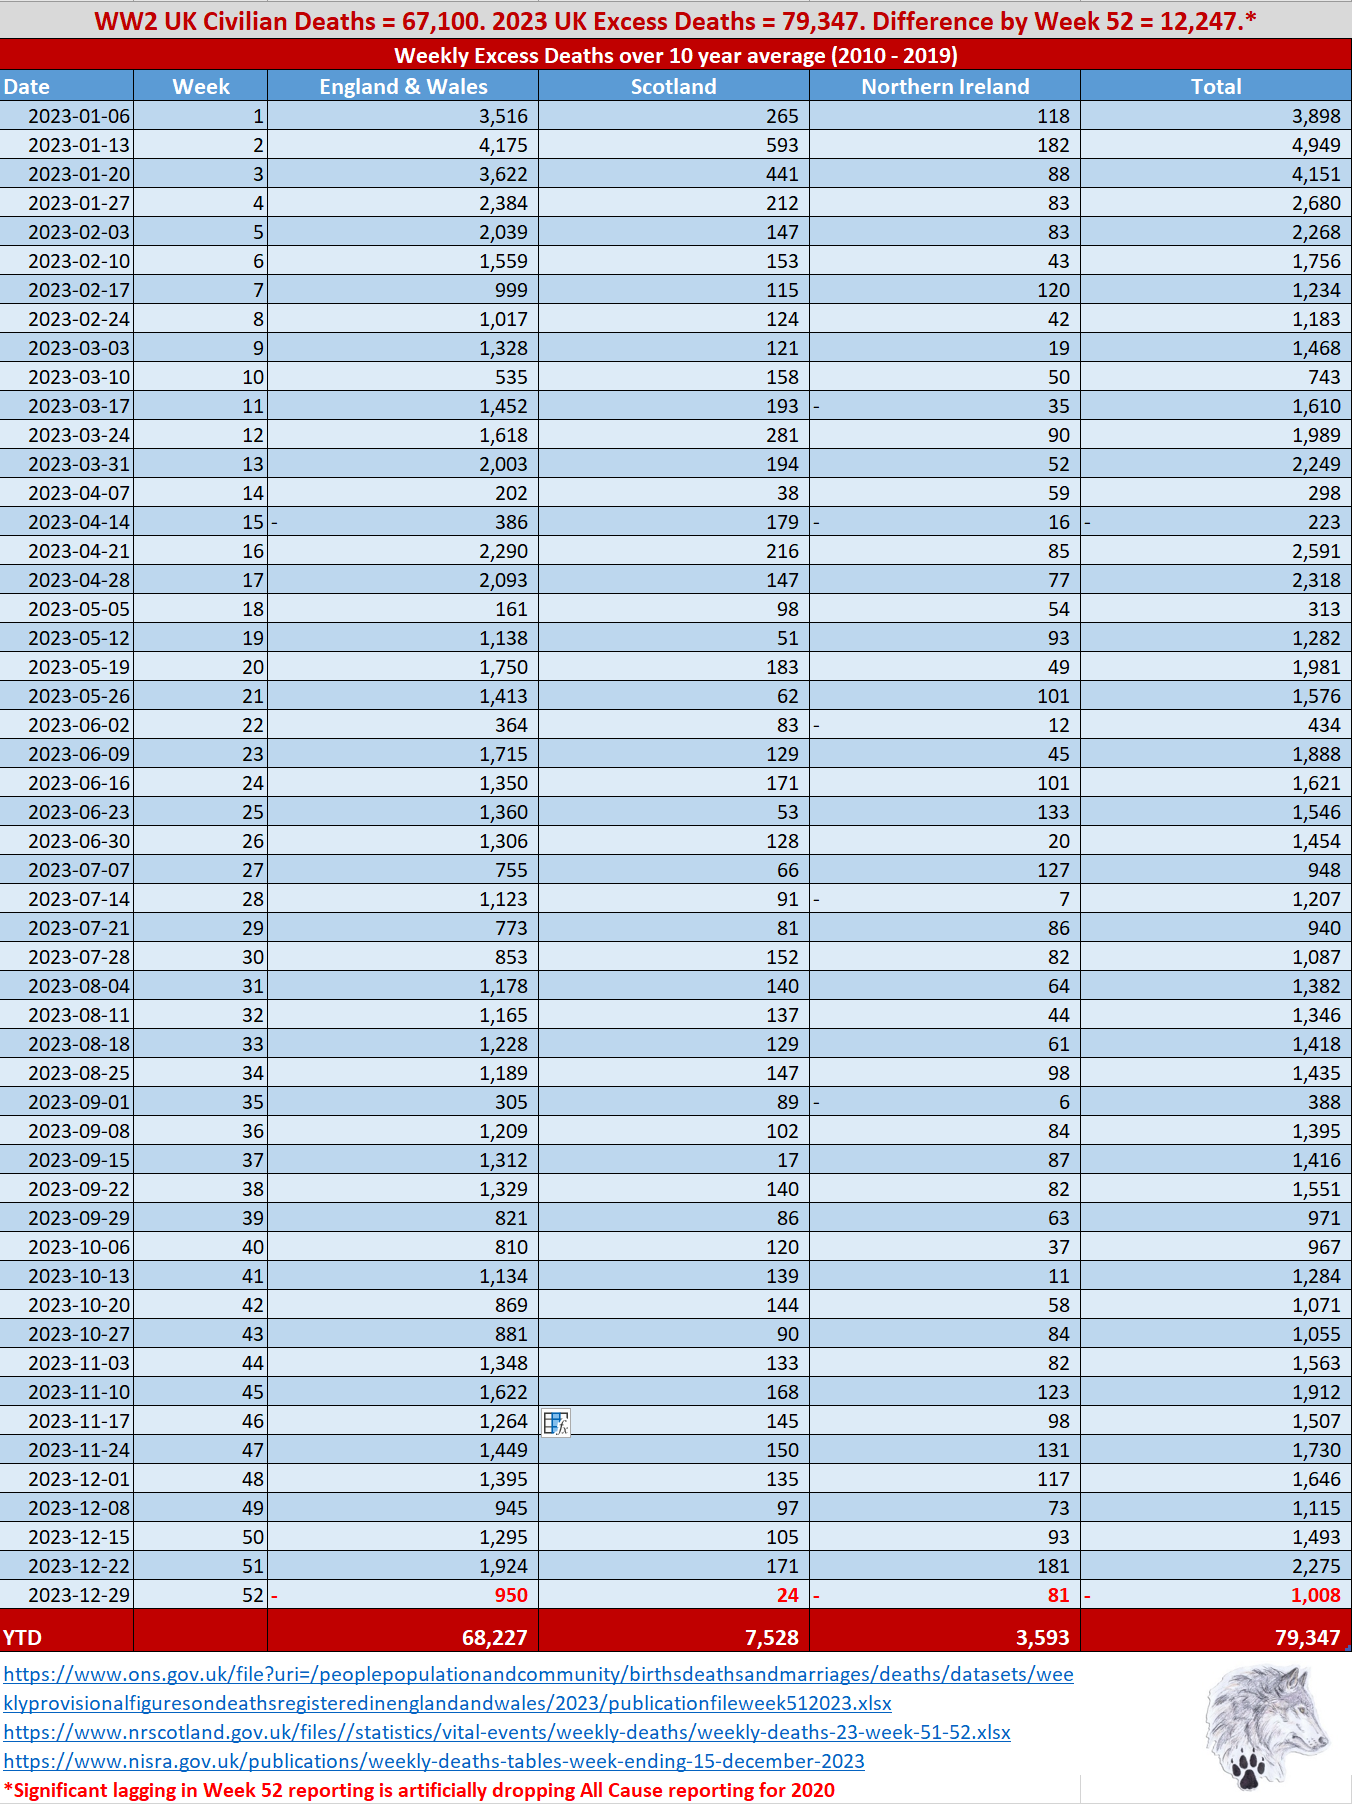
UK Excess Deaths
11,142 more UK Excess Deaths in 2023 (almost 20% more) than ALL the UK civilians who died in WW2 (1939-1945).
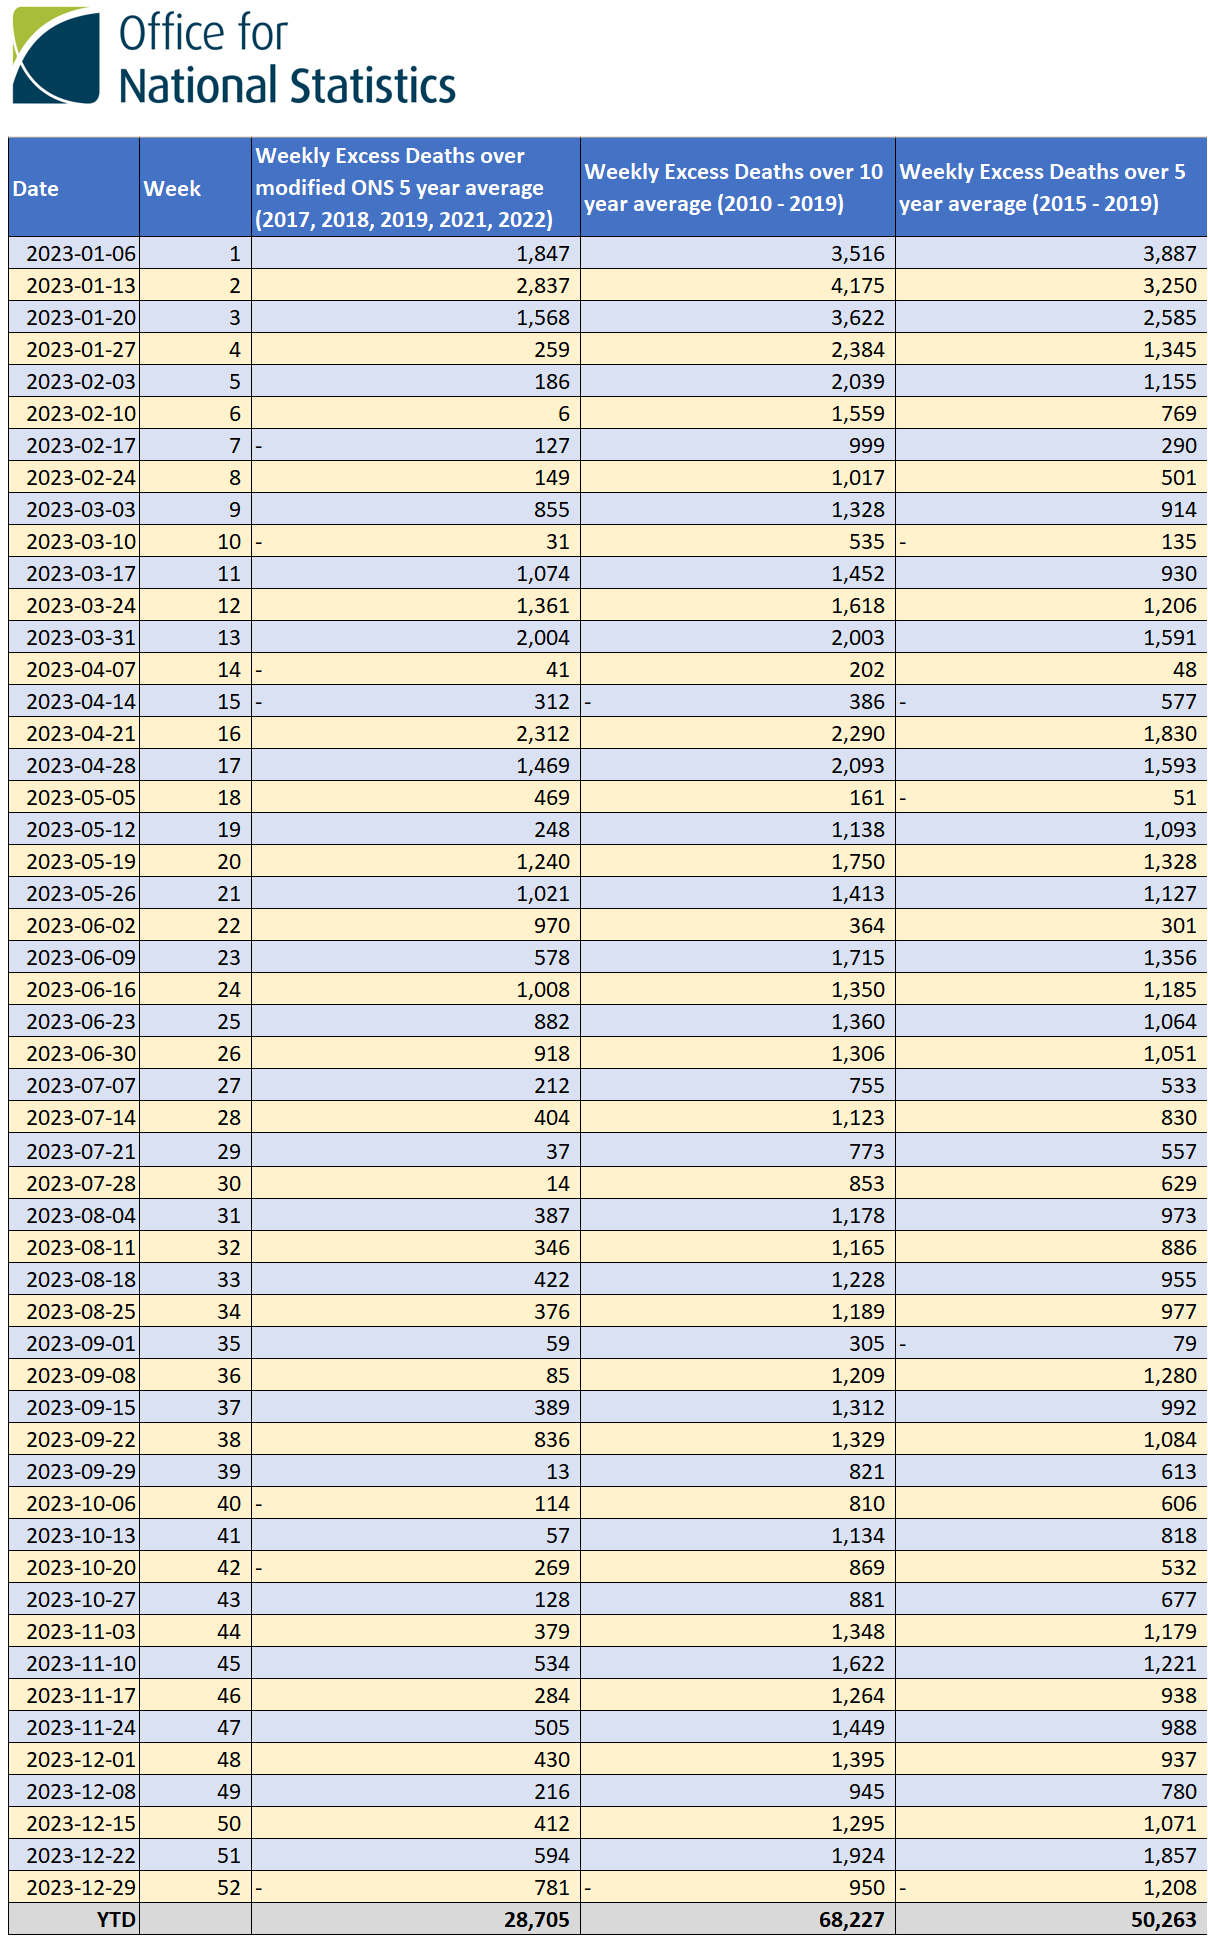
68,227 - England and Wales
7,596 - Scotland
2,419 - Northern Ireland
79,415 -Total
67,100 - WW2
11,142 difference for 2023.
No matter how you slice the data for Excess Deaths, the picture is not looking good worldwide. This is a comparison using UK ONS, 5 year and 10 year pre-pandemic average for Excess Death calculations.
This page contains Excess Deaths for Canada, England, Wales, Scotland, Northern Ireland, Ireland, Sweden and Australia. For detailed breakdowns of Scotland's data I suggest following
@Rustler.
COVID 19 is highly suspected to have been contracted by many of the athletes at the World Games in Wuhan China from October 17-28th, 2019. This would put the initial worldwide spread of COVID 19 as early as the first week of November 2019. Using a baseline of widespread infection by late November 2019 (supported by the number of respiratory virus symptomatic people at the start of the 2019/2020 flu season), this is a reasonable, supportable hypothesis. Blood samples and other tests have shown this to be the most probable start of the COVID 19 spread into Europe and North America.
https://www.ncbi.nlm.nih.gov/pmc/articles/PMC7813667/
There were no practical COVID 19 responses (lockdowns, masks etc.) until mid to late March in almost all European or North American countries.
So, what was the impact of this 'deadly' disease running rampant for 18+ weeks in places such as England and Wales (where detailed records of weekly excess deaths are recorded).
From reporting weeks of November 22nd, 2019, to March 20th, 2020 (18 weeks total) there were 2,527 reported excess deaths (using the moving 5-year average ONS data, which excludes 2020). In the next 18-week period post lockdown in England and Wales, (reporting weeks March 27th, 2020, to July 24th, 2020) there were 57,839 reported excess deaths. If we use a more accurate (not skewed by the pandemic numbers) period for the average baseline of 2010-2019, these numbers change to 5,853 and 62,565 respectively.
The bulk of excess deaths are normally recorded in the regular flu season of October to March so the initial 18-week reporting period above should have shown the majority of excess deaths. Considering COVID 19 was moving through the population without any preventative measures and through some of the most significant times (Christmas, New Year, Chinese New Year) for a respiratory virus to spread during that first block of 18 weeks, as I said in my initial papers in 2020 using the CDC data available at the time, where are all the bodies?
Click image for research as published in 2020.
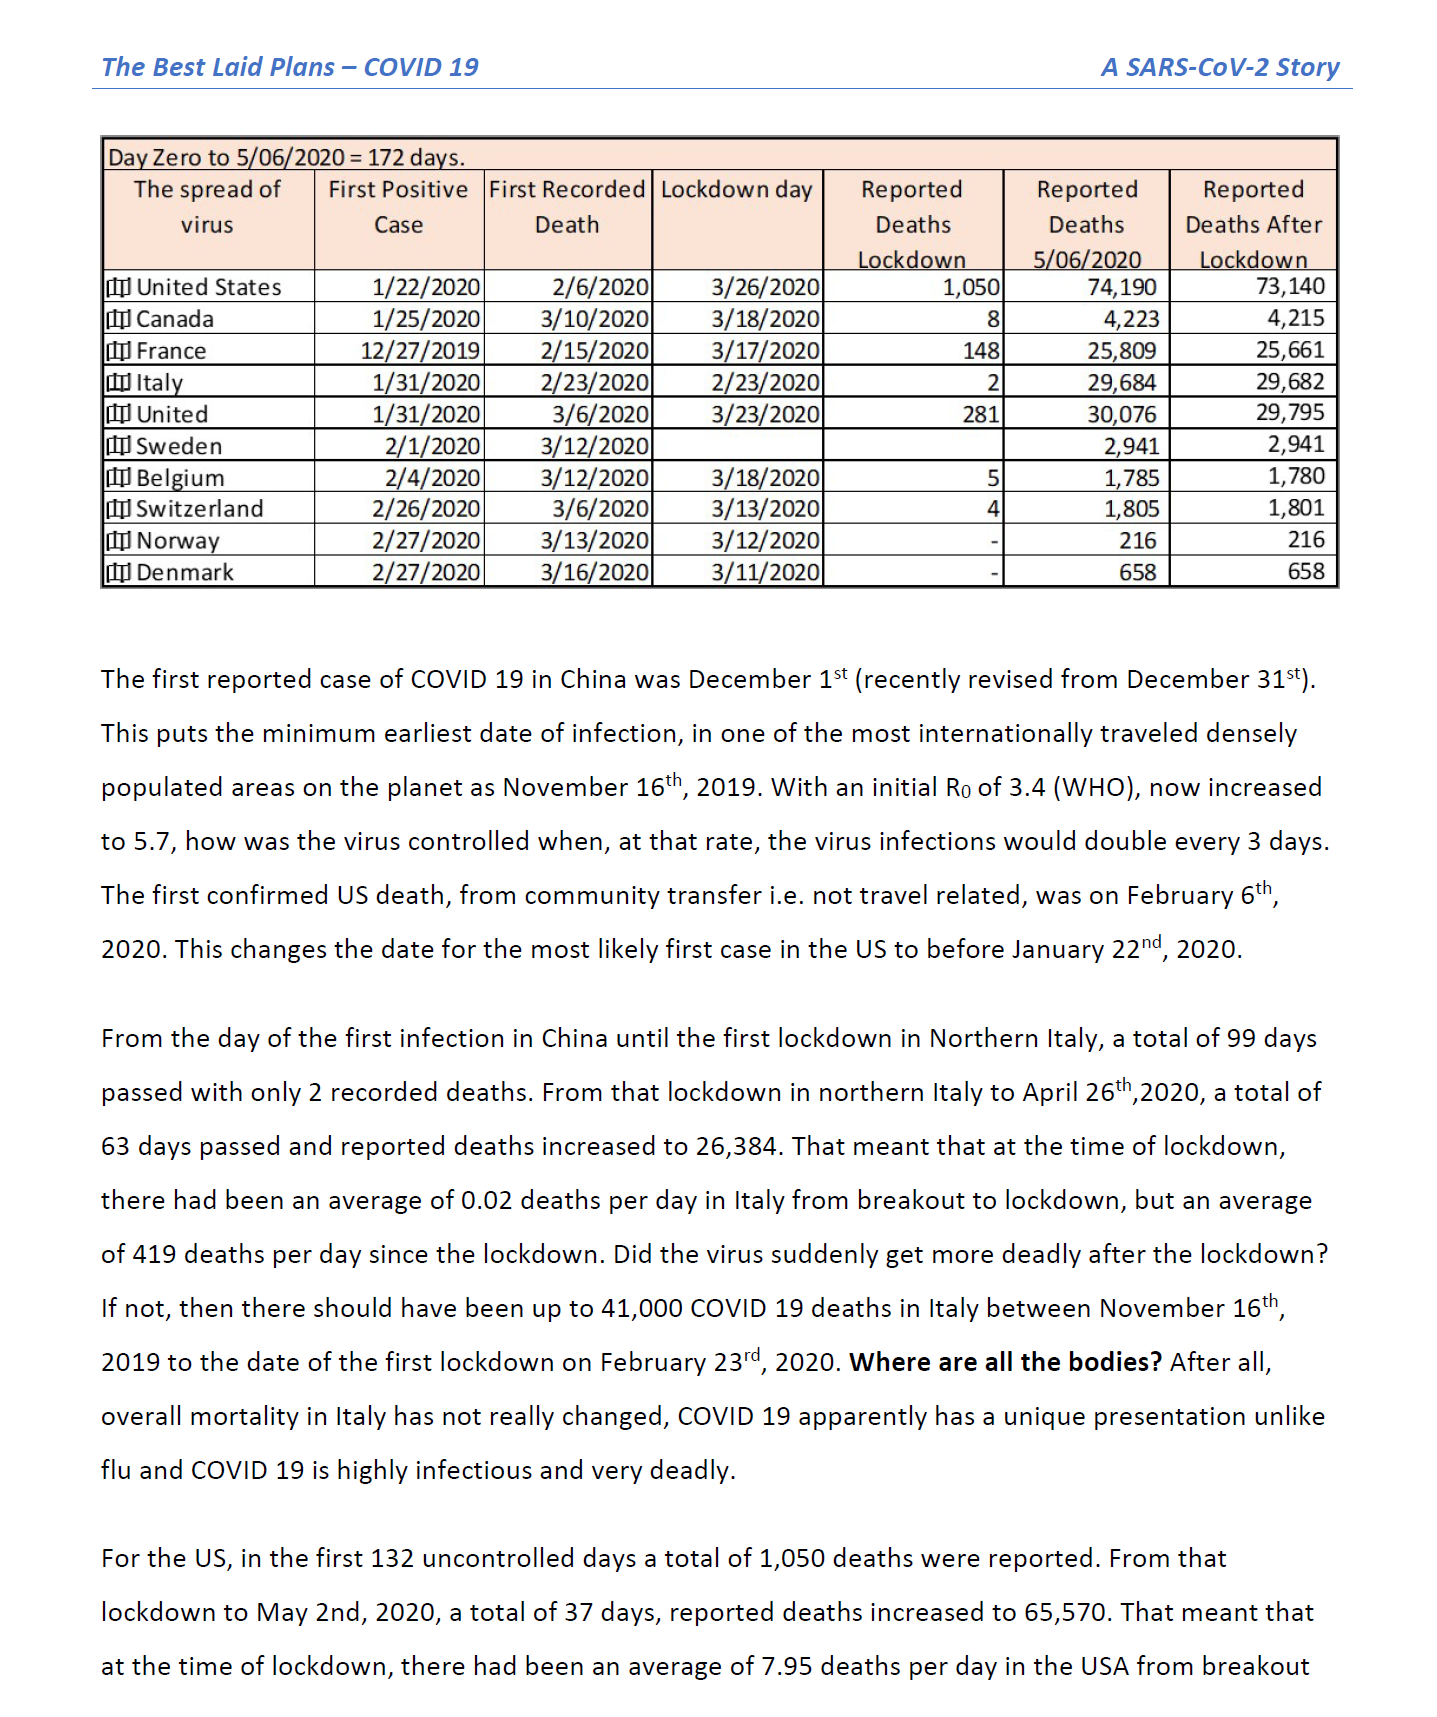
https://www.researchgate.net/publication/341713221_The_Best_Laid_Plans_COVID-19_A_SARS-COV-2_Story_A_SARS-CoV-2_Story_P_a_g_e_2_106
Continued here:
Table of reported 'presumed WITH' COVID Deaths (first posted in March 2020 and updated throughout the year)
[Link] to full article from 2020. https://dksdata.com/COVArticles?0
The reality is that COVID didn't kill people. The response to COVID did. Using that hypothesis, it is arguable that all excess deaths over the expected baseline for 2019 were the direct result of the COVID response and not COVID itself.
In most countries, the excess death rates for 2018 and 2019 were almost identical (or dropping slightly). So, using 2019 as a baseline for expected excess deaths, we see the following:
In England And Wales, using the UK ONS Data, based on ten-year average deaths to calculate excess deaths (2010-2019) to filter out the pandemic years, we see cumulative excess deaths above the expected excess deaths.
CANADA and Provinces May 14th, 2025
All-Cause Mortality by Age - 2010-2024.
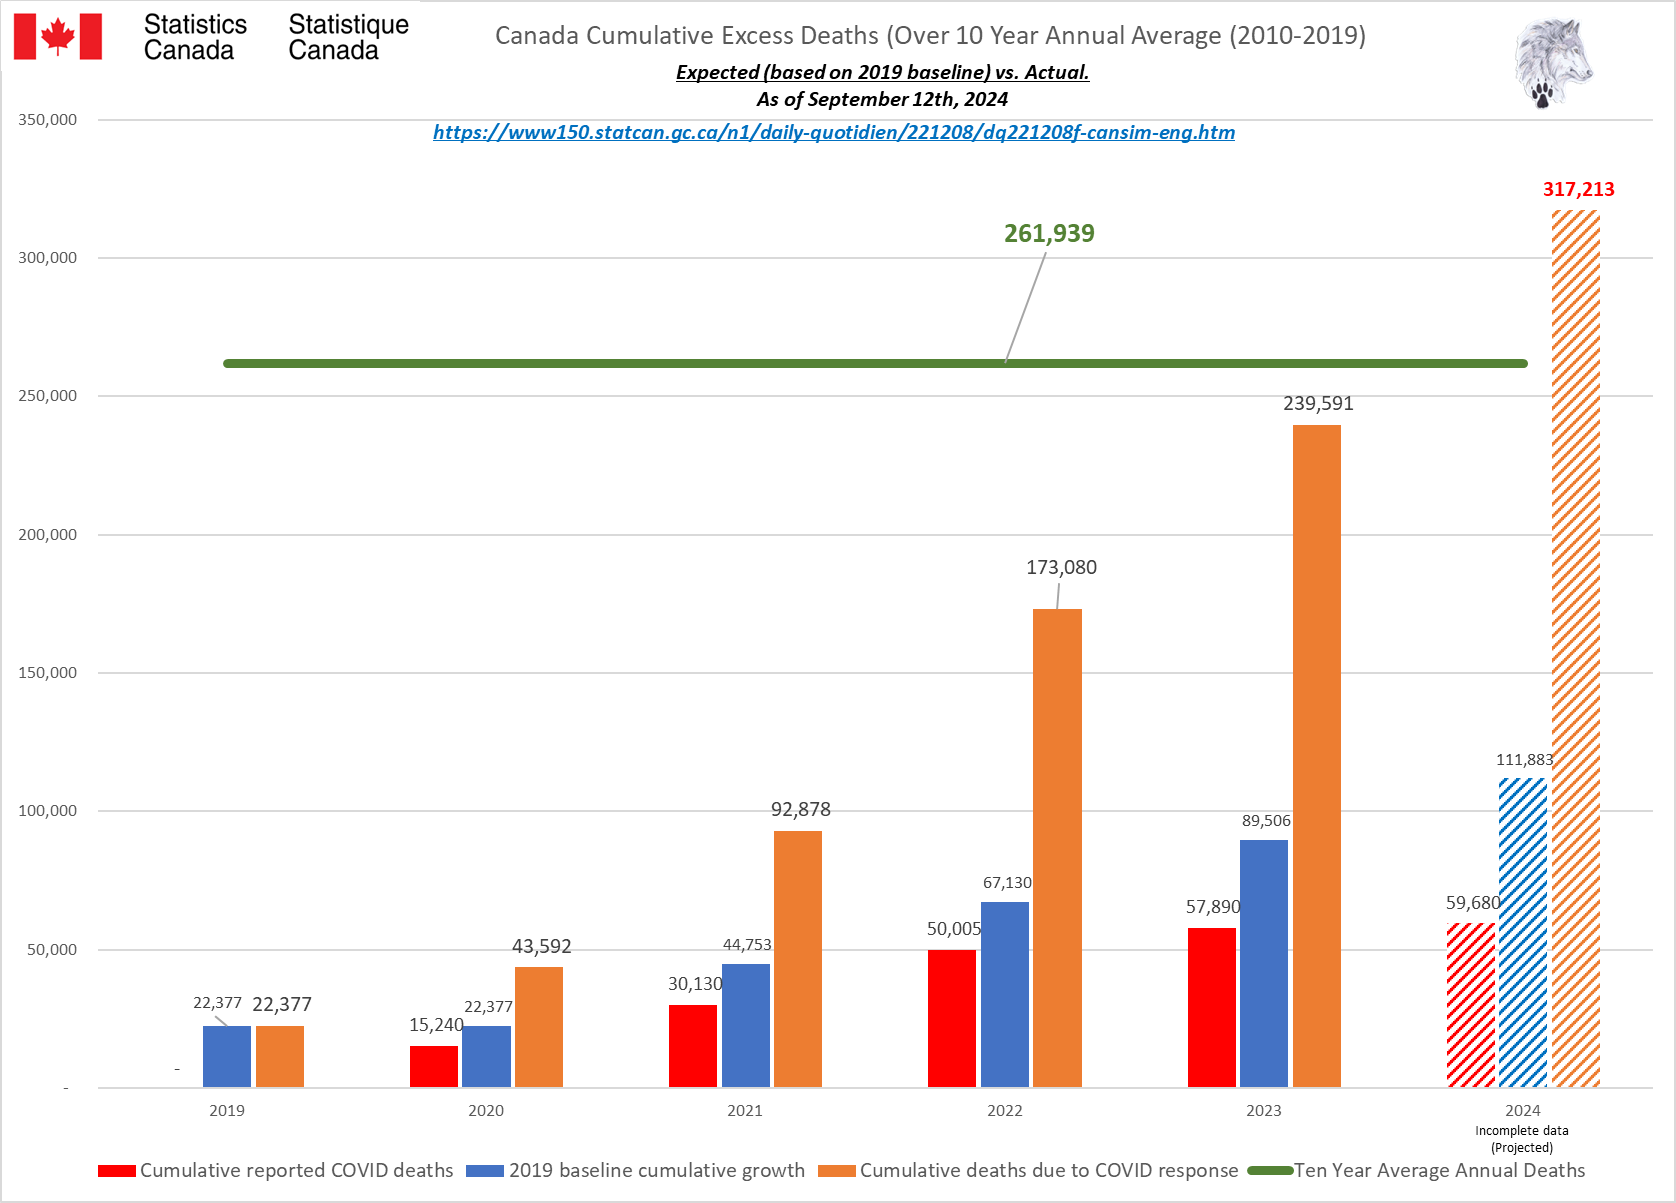
In Canada, the number of excess deaths related to the COVID response is expected to exceed 350,000+ by the end of 2024. This number will grow as final figures for 2022/2023 have not been published for some of the larger provinces. The average 10-year deaths for a single year for Canada is 261,051. This puts the deaths attributable to the COVID response at over 115% of a SINGLE normal year's average deaths TOTAL for all causes .
In Alberta, it is even worse. The 10-year average for total deaths per year in Alberta is 23,637 deaths a year. The excess deaths attributable to the COVID 19 response in Alberta from 2020 to 2024 hit 40,000 by the end of 2024. That is almost TWO YEARS normal average deaths TOTAL for all causes deaths in less than four years ADDED to the total number of deaths in Alberta. Most of those excess deaths were recorded in 2022 and 2023 alone but 2024 is accelerating that number.
The biggest questions that should be on everyone's lips right now is what is killing people worldwide, and why is no one talking about it?

All provinces are lagging in reporting for 2023/24/25. Many are still modifying data as far back as 2010. AB, BC, N&L, NWT & QC reported to Week 9, 2025. MN to Week 7, 2025. PEI to Week 2, 2025. SK to Week 2, 2025.
Canada and Ontario both deleted 7 weeks from the 2024 data this month. Canada reported to Week 50 in April but only up to Week 43 in May. Although the number of weeks deleted was the same (7), the weeks deleted was not the same for Ontario which deleted weeks 39 to 45 in May, now reporting to Week 38 for 2024.
The two primary reporting tables (“By Cause” and “By Age”) differ significantly. From January 2025 to May 2025 (4 months), Canada REMOVED 7 weeks of data for 2024 (after adding 14 weeks of data for 2024 by April 2025). Yet All Cause mortality numbers swung from a low of 183,420 to a high of 323,930 just for 2024. Even 2010 saw from minus 640 to plus 600 deaths (by cause) and changed the cause of death in up to 339,755 people since 2010 and up to 240,315 people in the 2024 data alone.
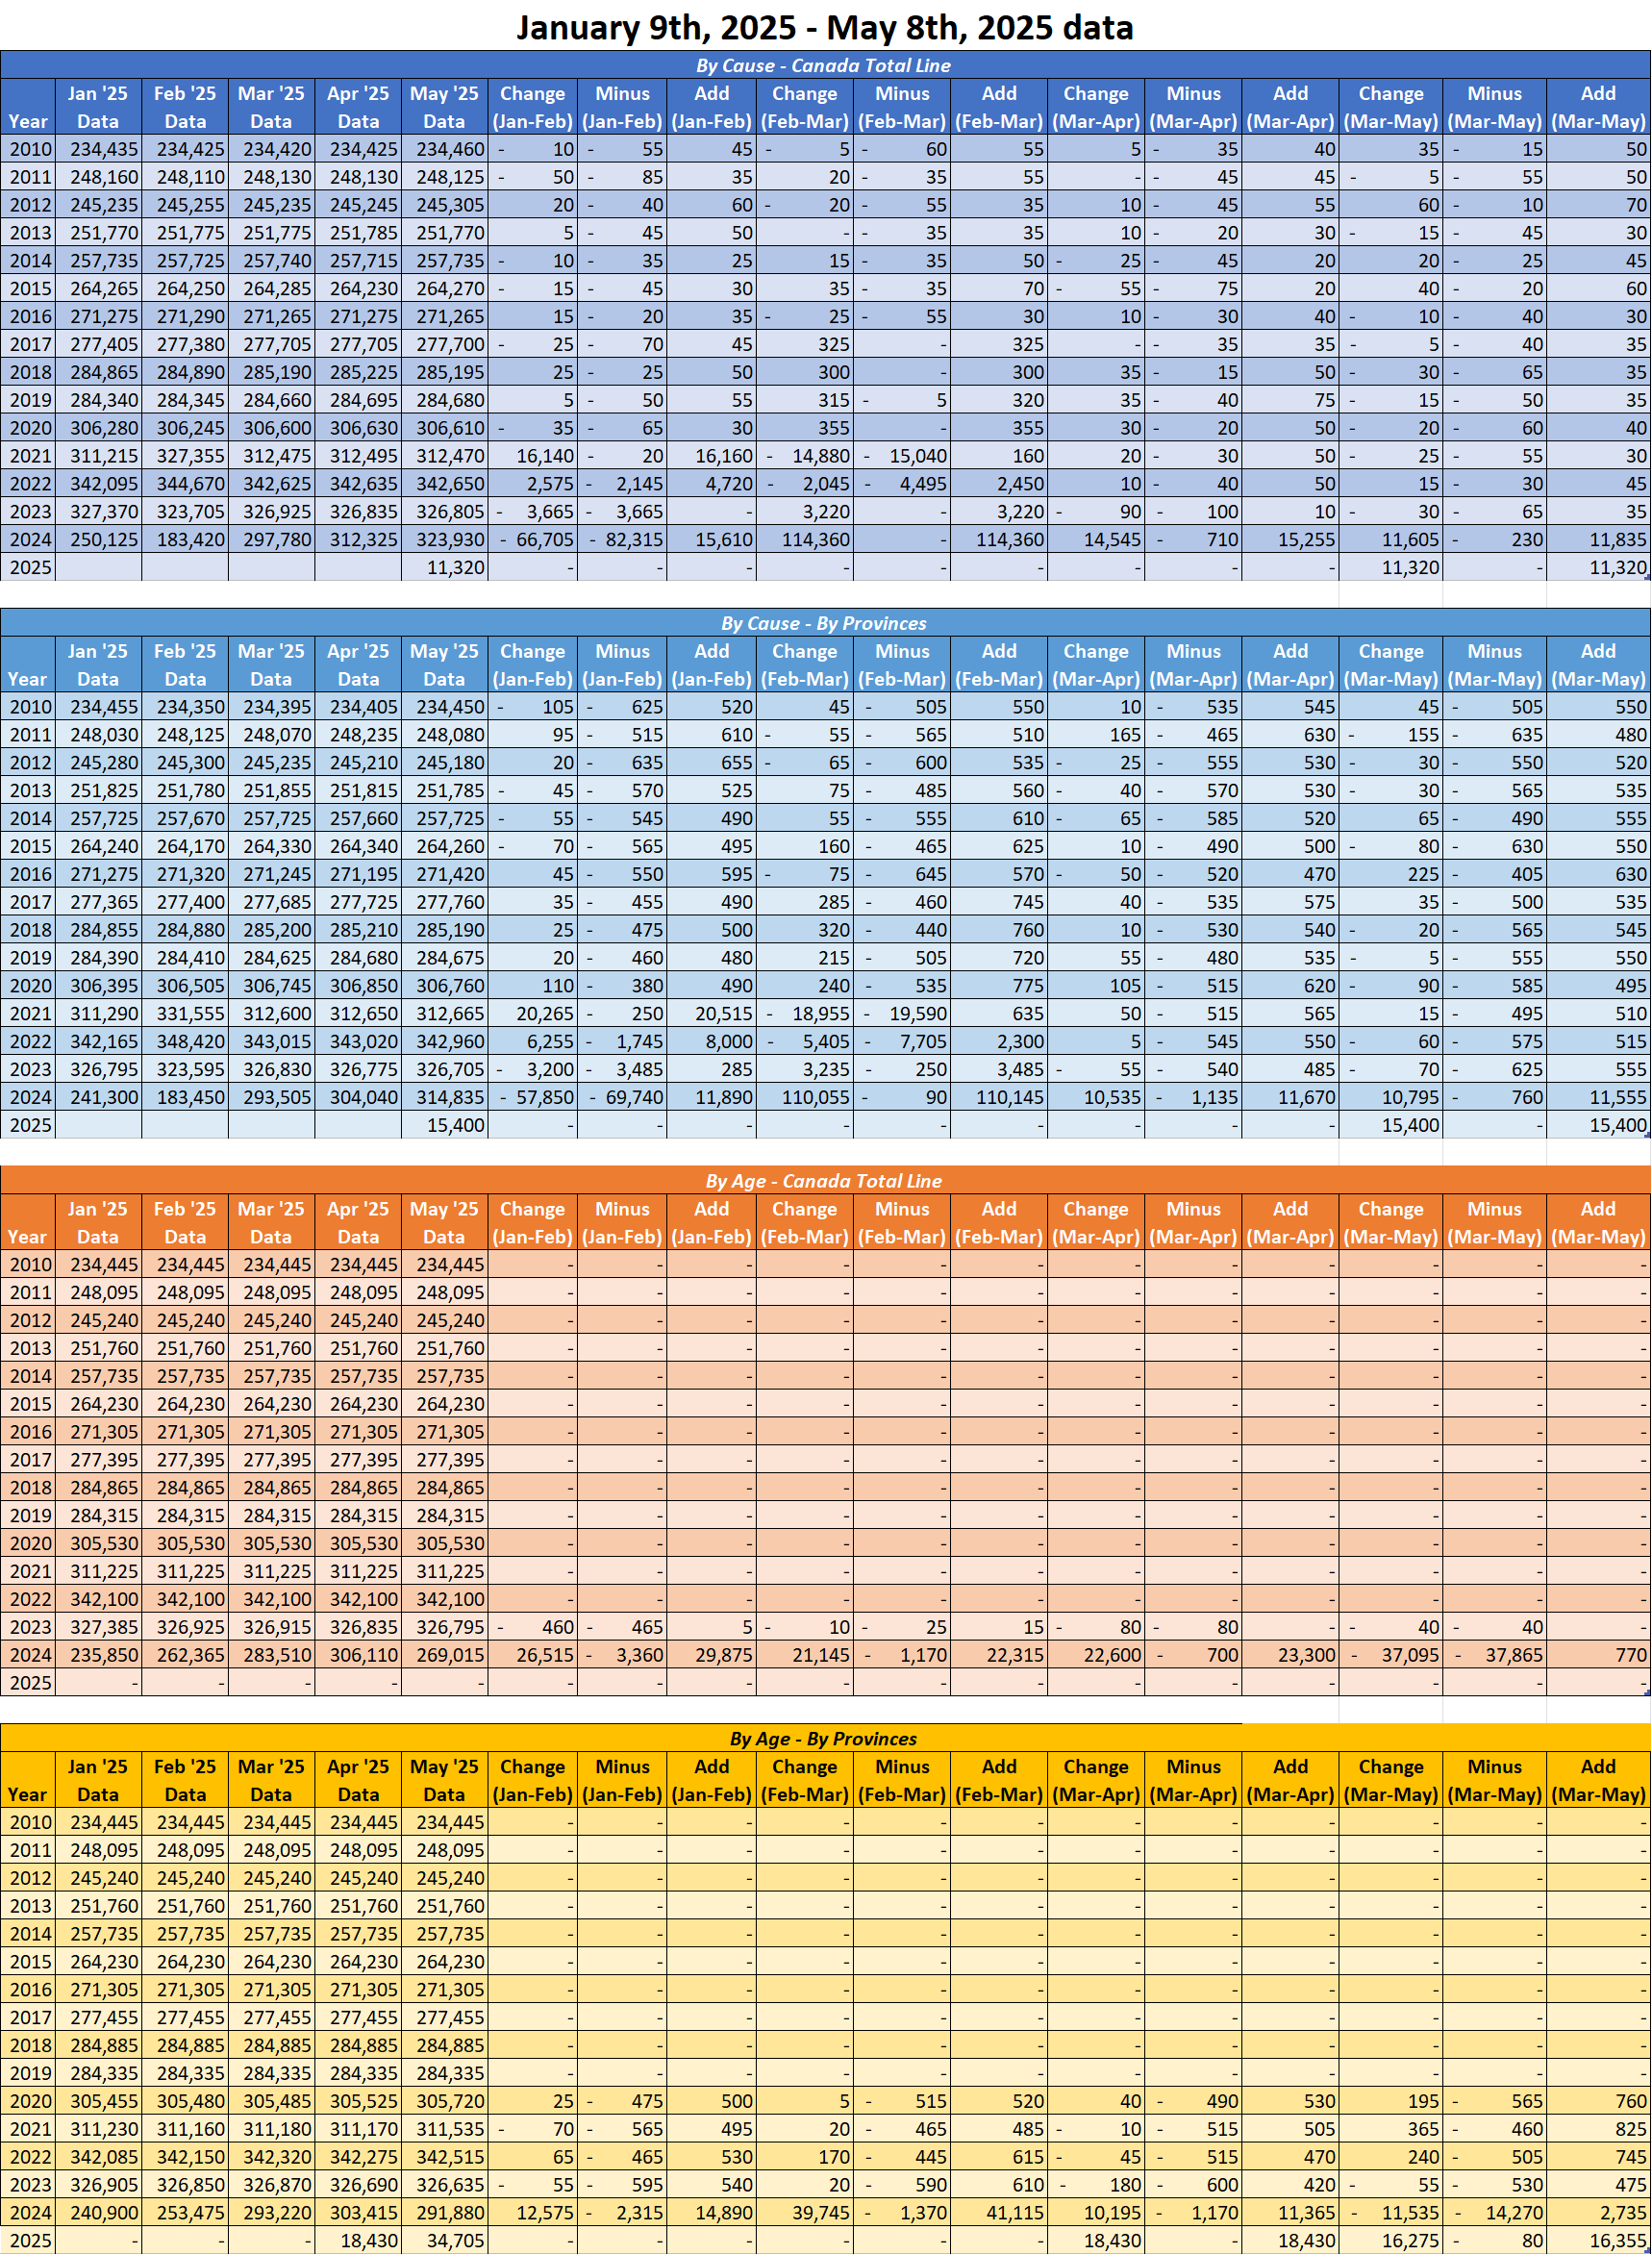
In 2020, Canada was shut down due to daily 'CONFIRMED' COVID deaths. Yet, in 2025, Canada is still unable to provide semi-accurate death data from month to month going back 15 YEARS. Since January 2025, Canada removed up to 30% of the reported deaths, then increased the total by almost 60% just for 2024. This is NOT the same reclassification issue as “UNKNOWN CAUSE”.
Deaths, especially in the younger population, are increasing. In 2024, deaths over 65 have started to increase again. These are not deaths being driven by immigration or the “baby boomers”. ALL 2024 provincial data show this will only get worse from here.
2024 WILL be the worst on record for All-Cause deaths in Canada & we have still not seen a reset for premature excess deaths since 2019. Whatever is causing these excess deaths is still happening (and it isn’t COVID).
In 2019, All Cause deaths under 45 dropped significantly in Canada (and most Provinces). Since 2020 that downward trend has turned into mass deaths of historic proportions.

Alberta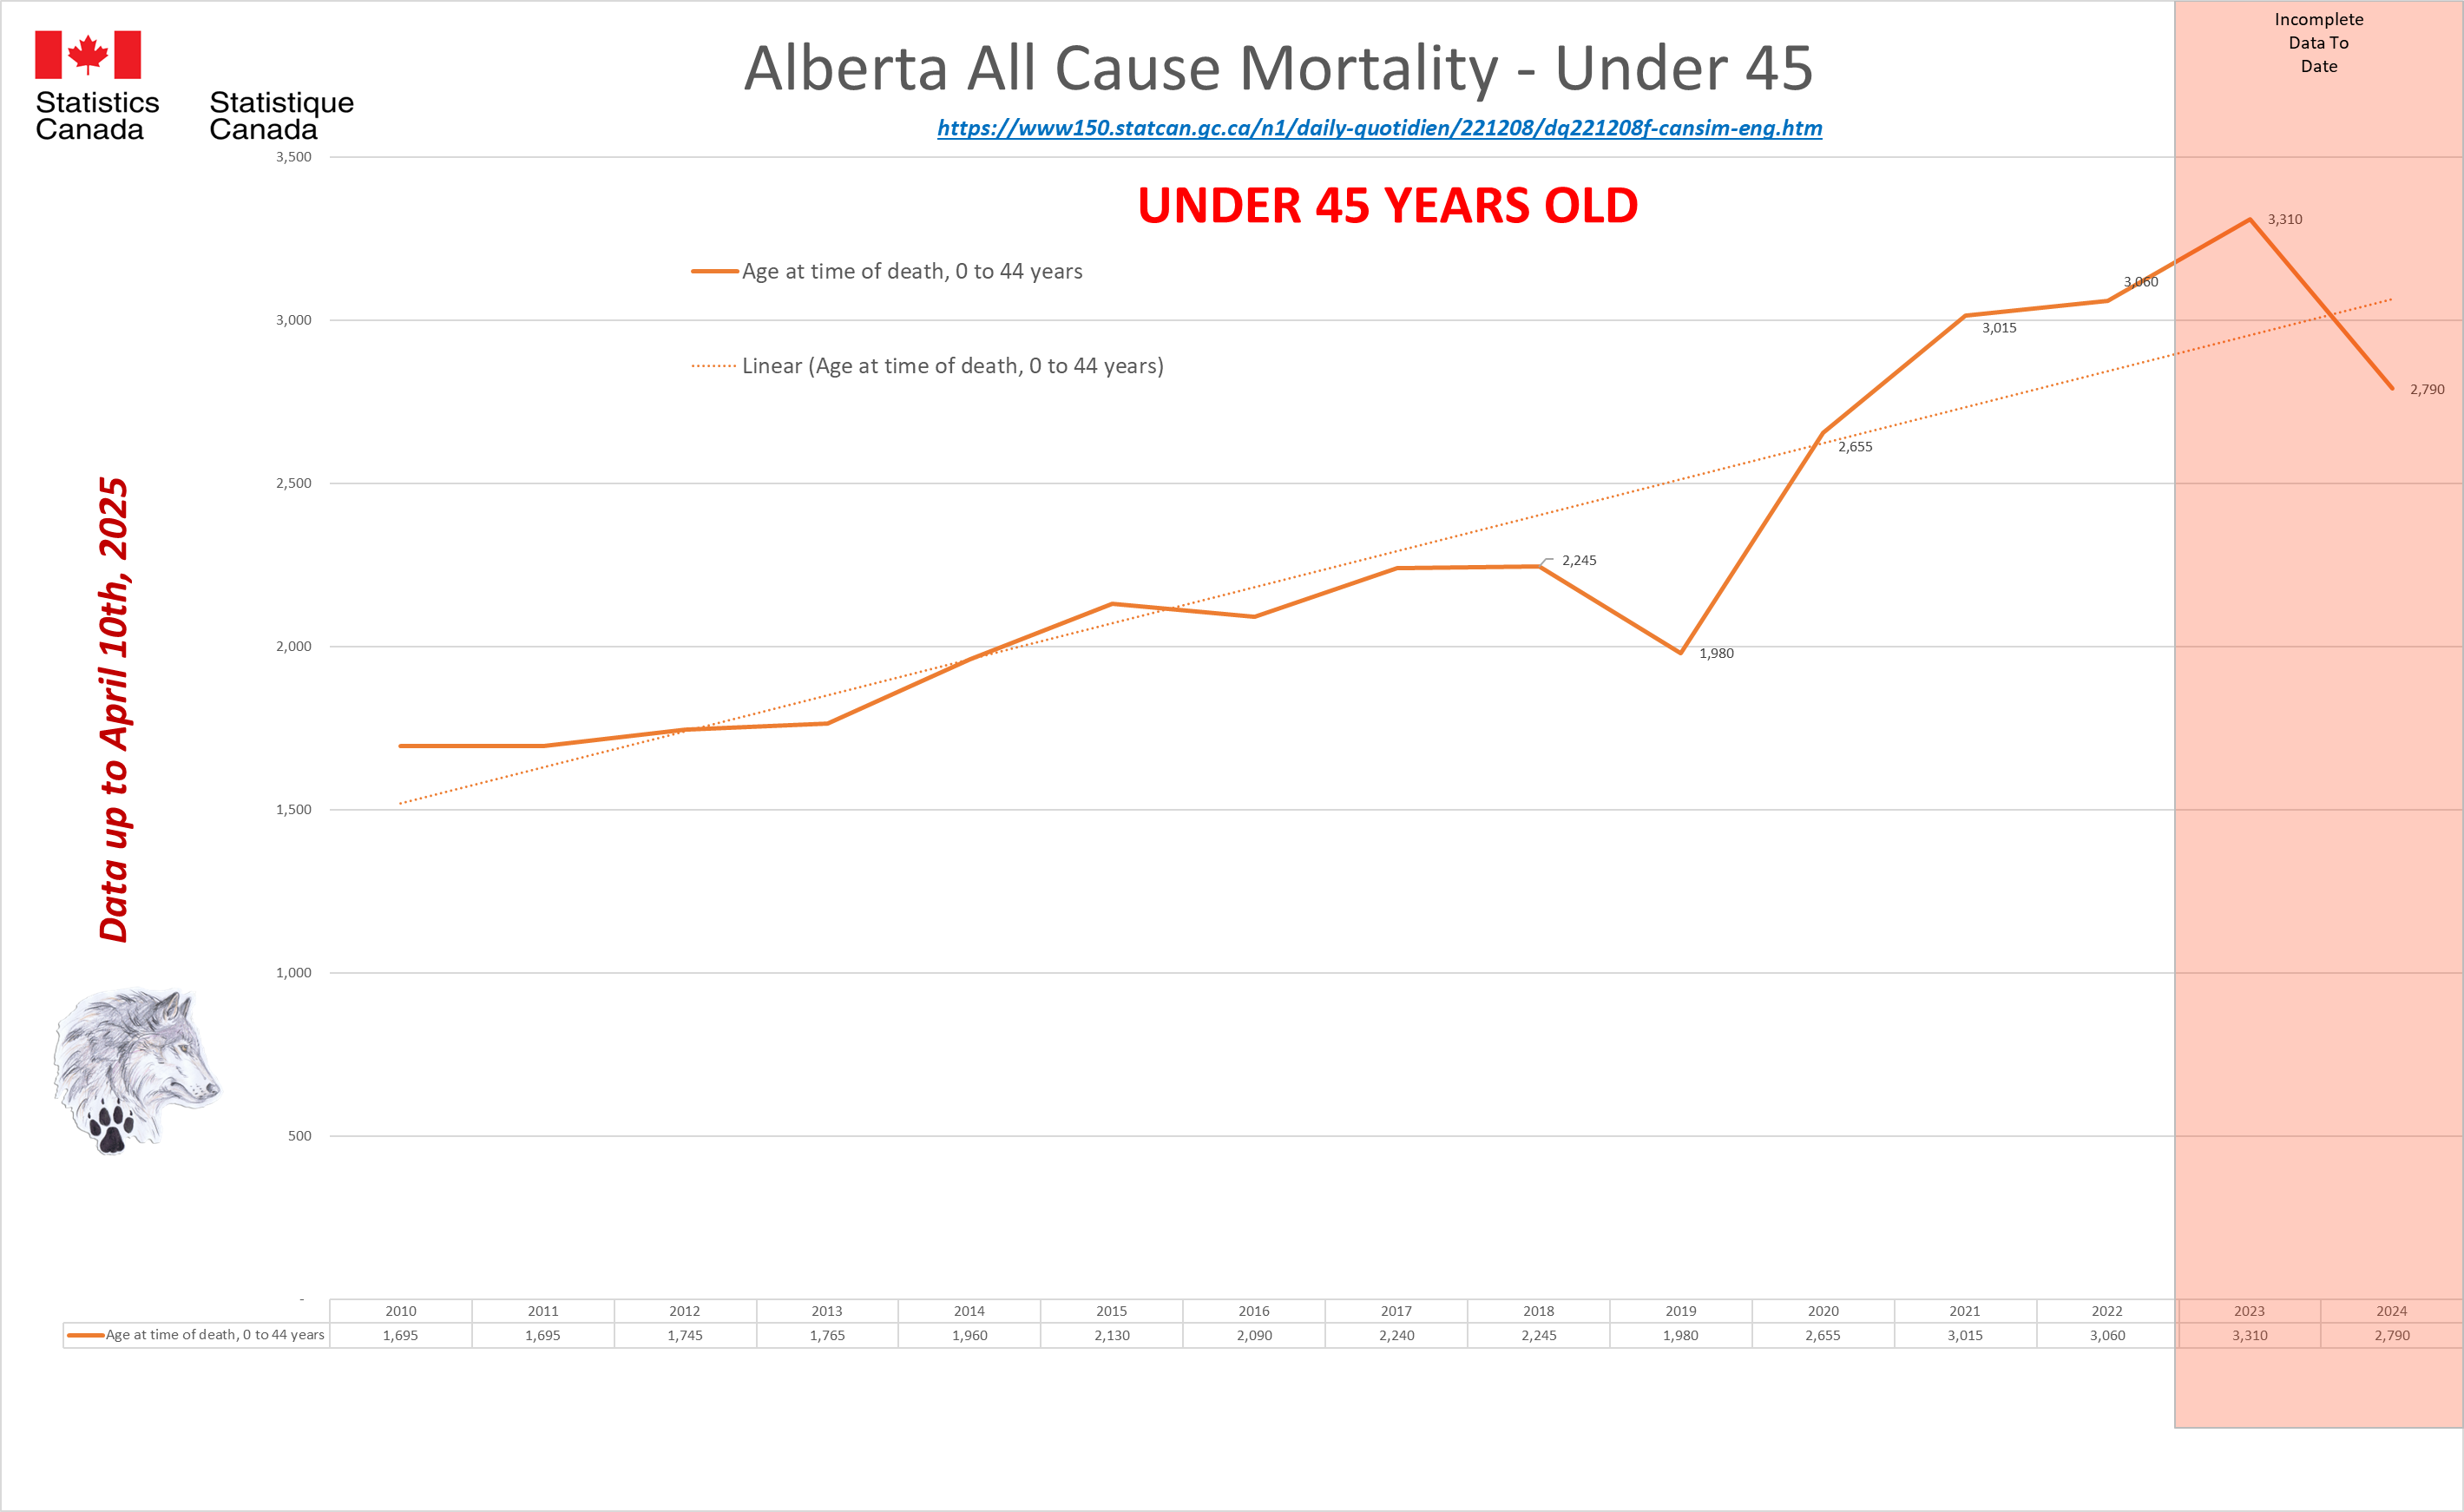 |
British Columbia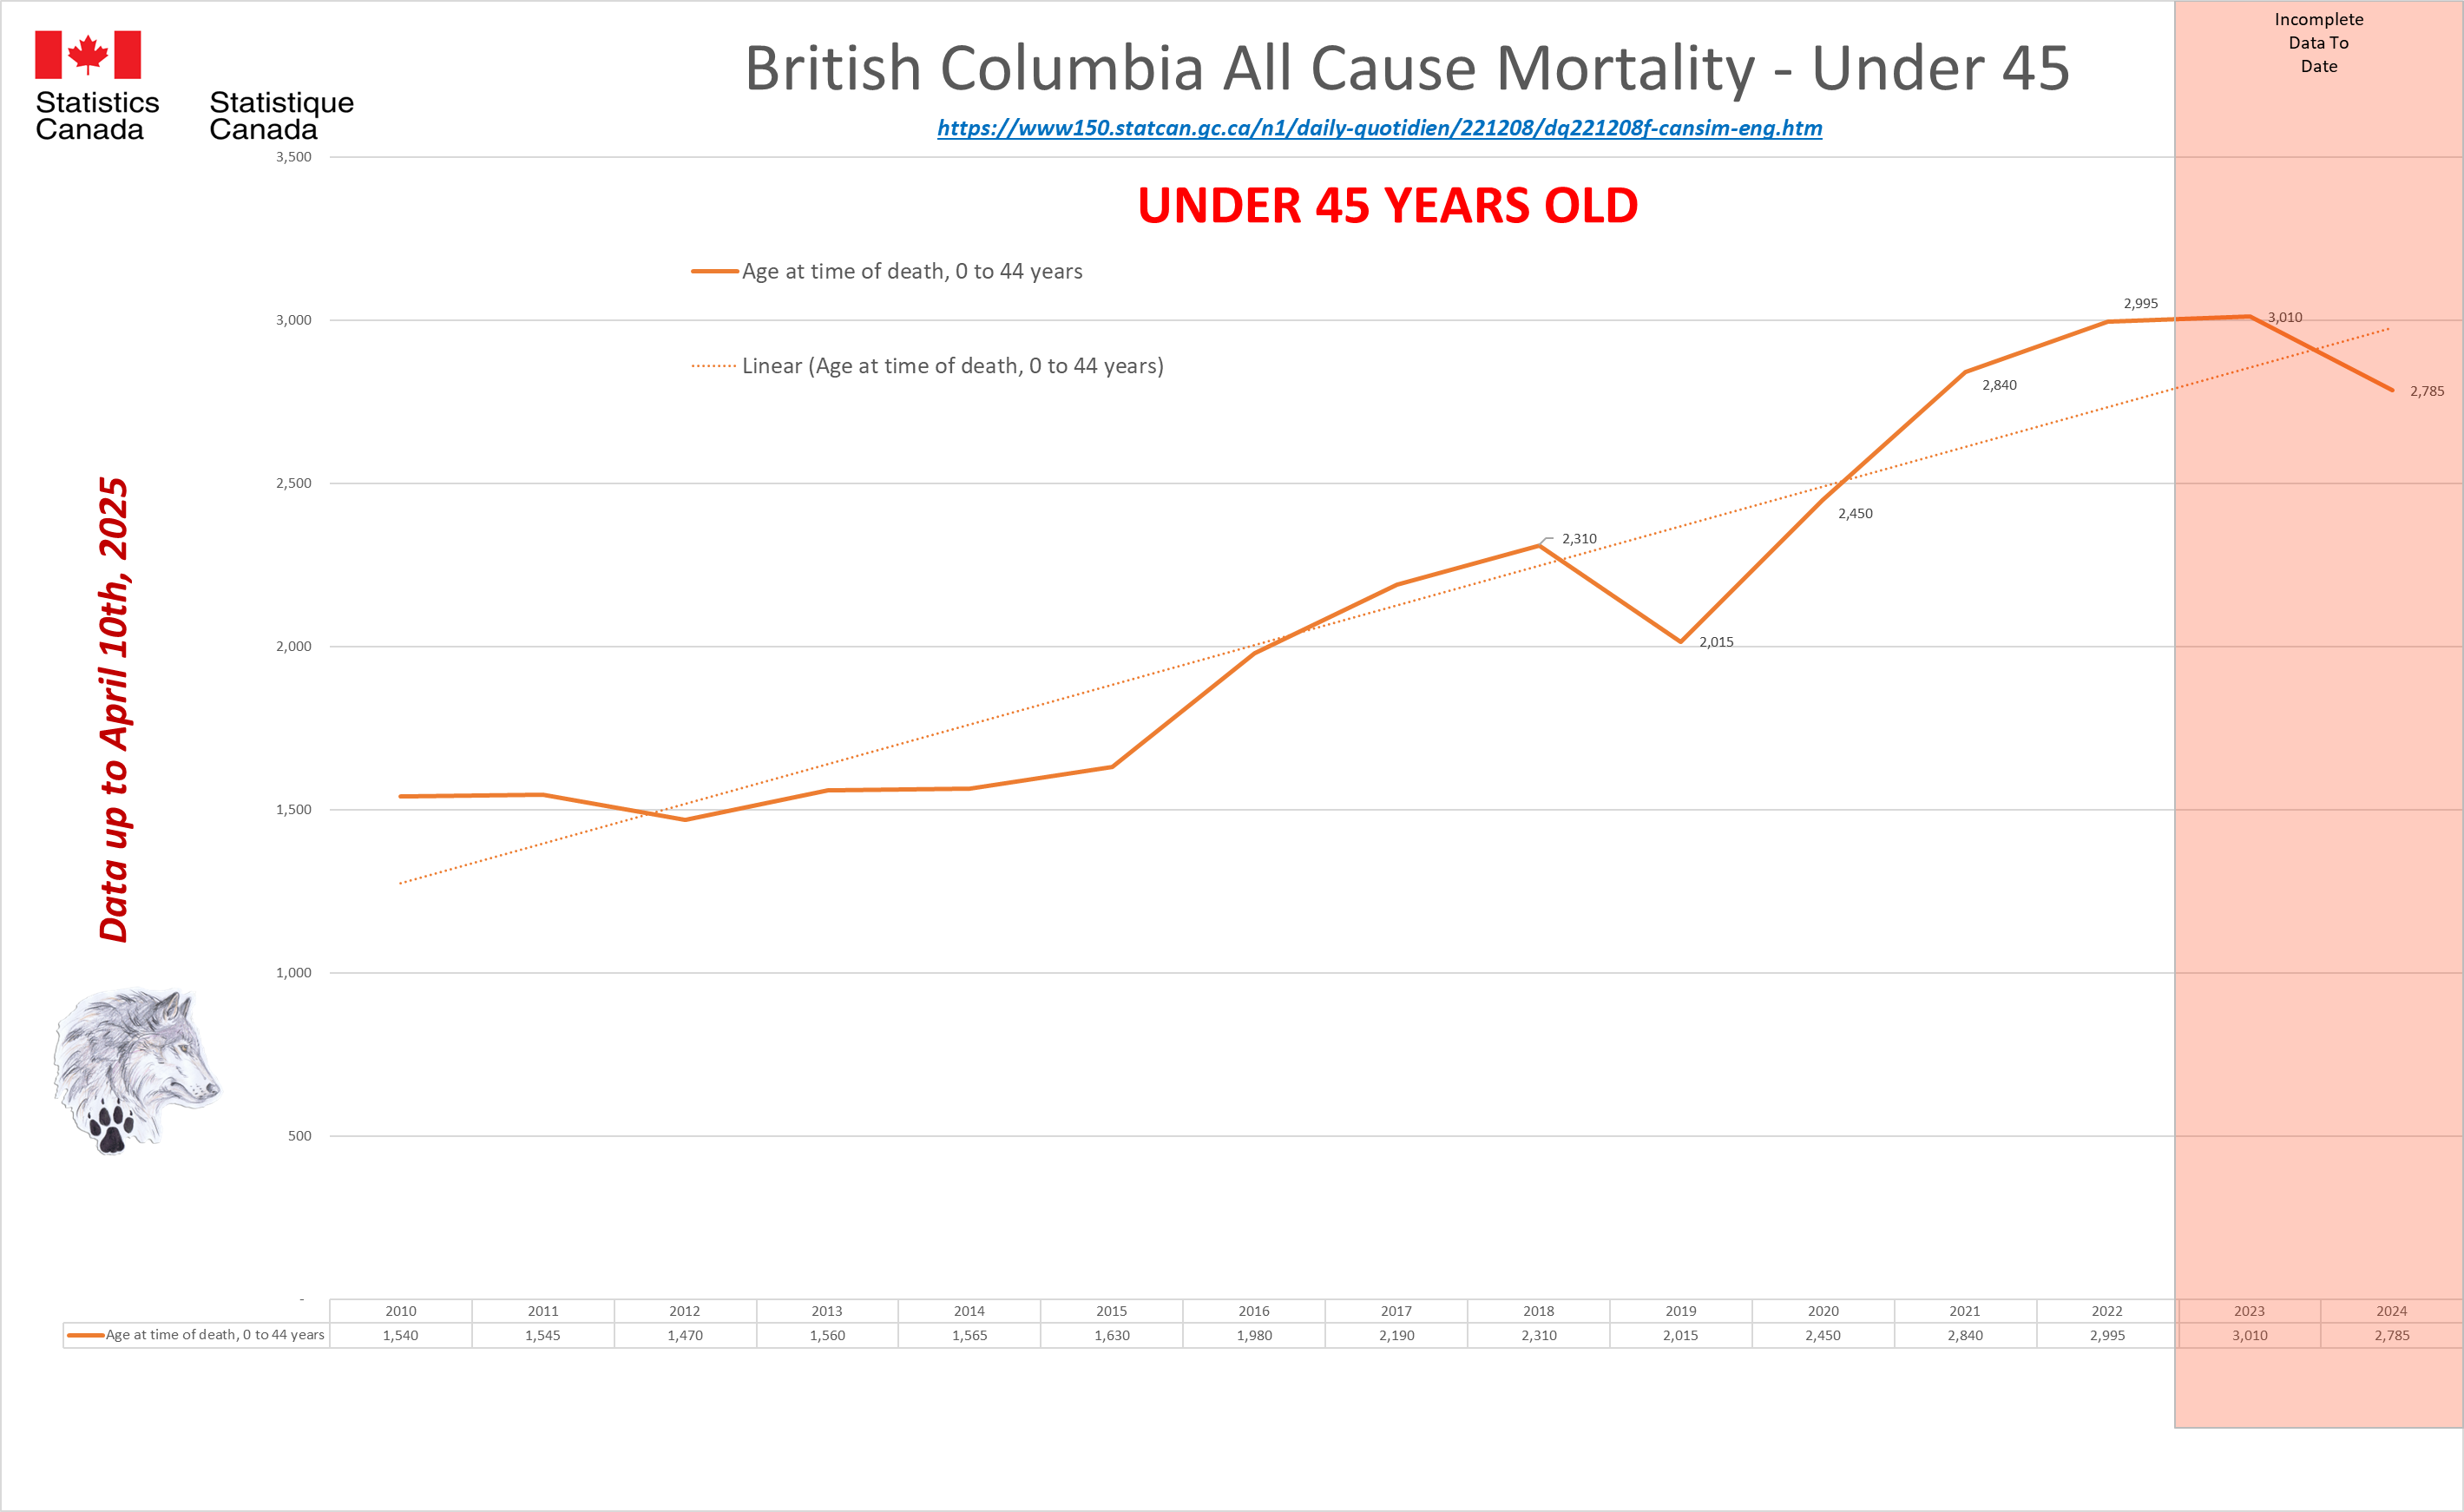 |
Saskatchewan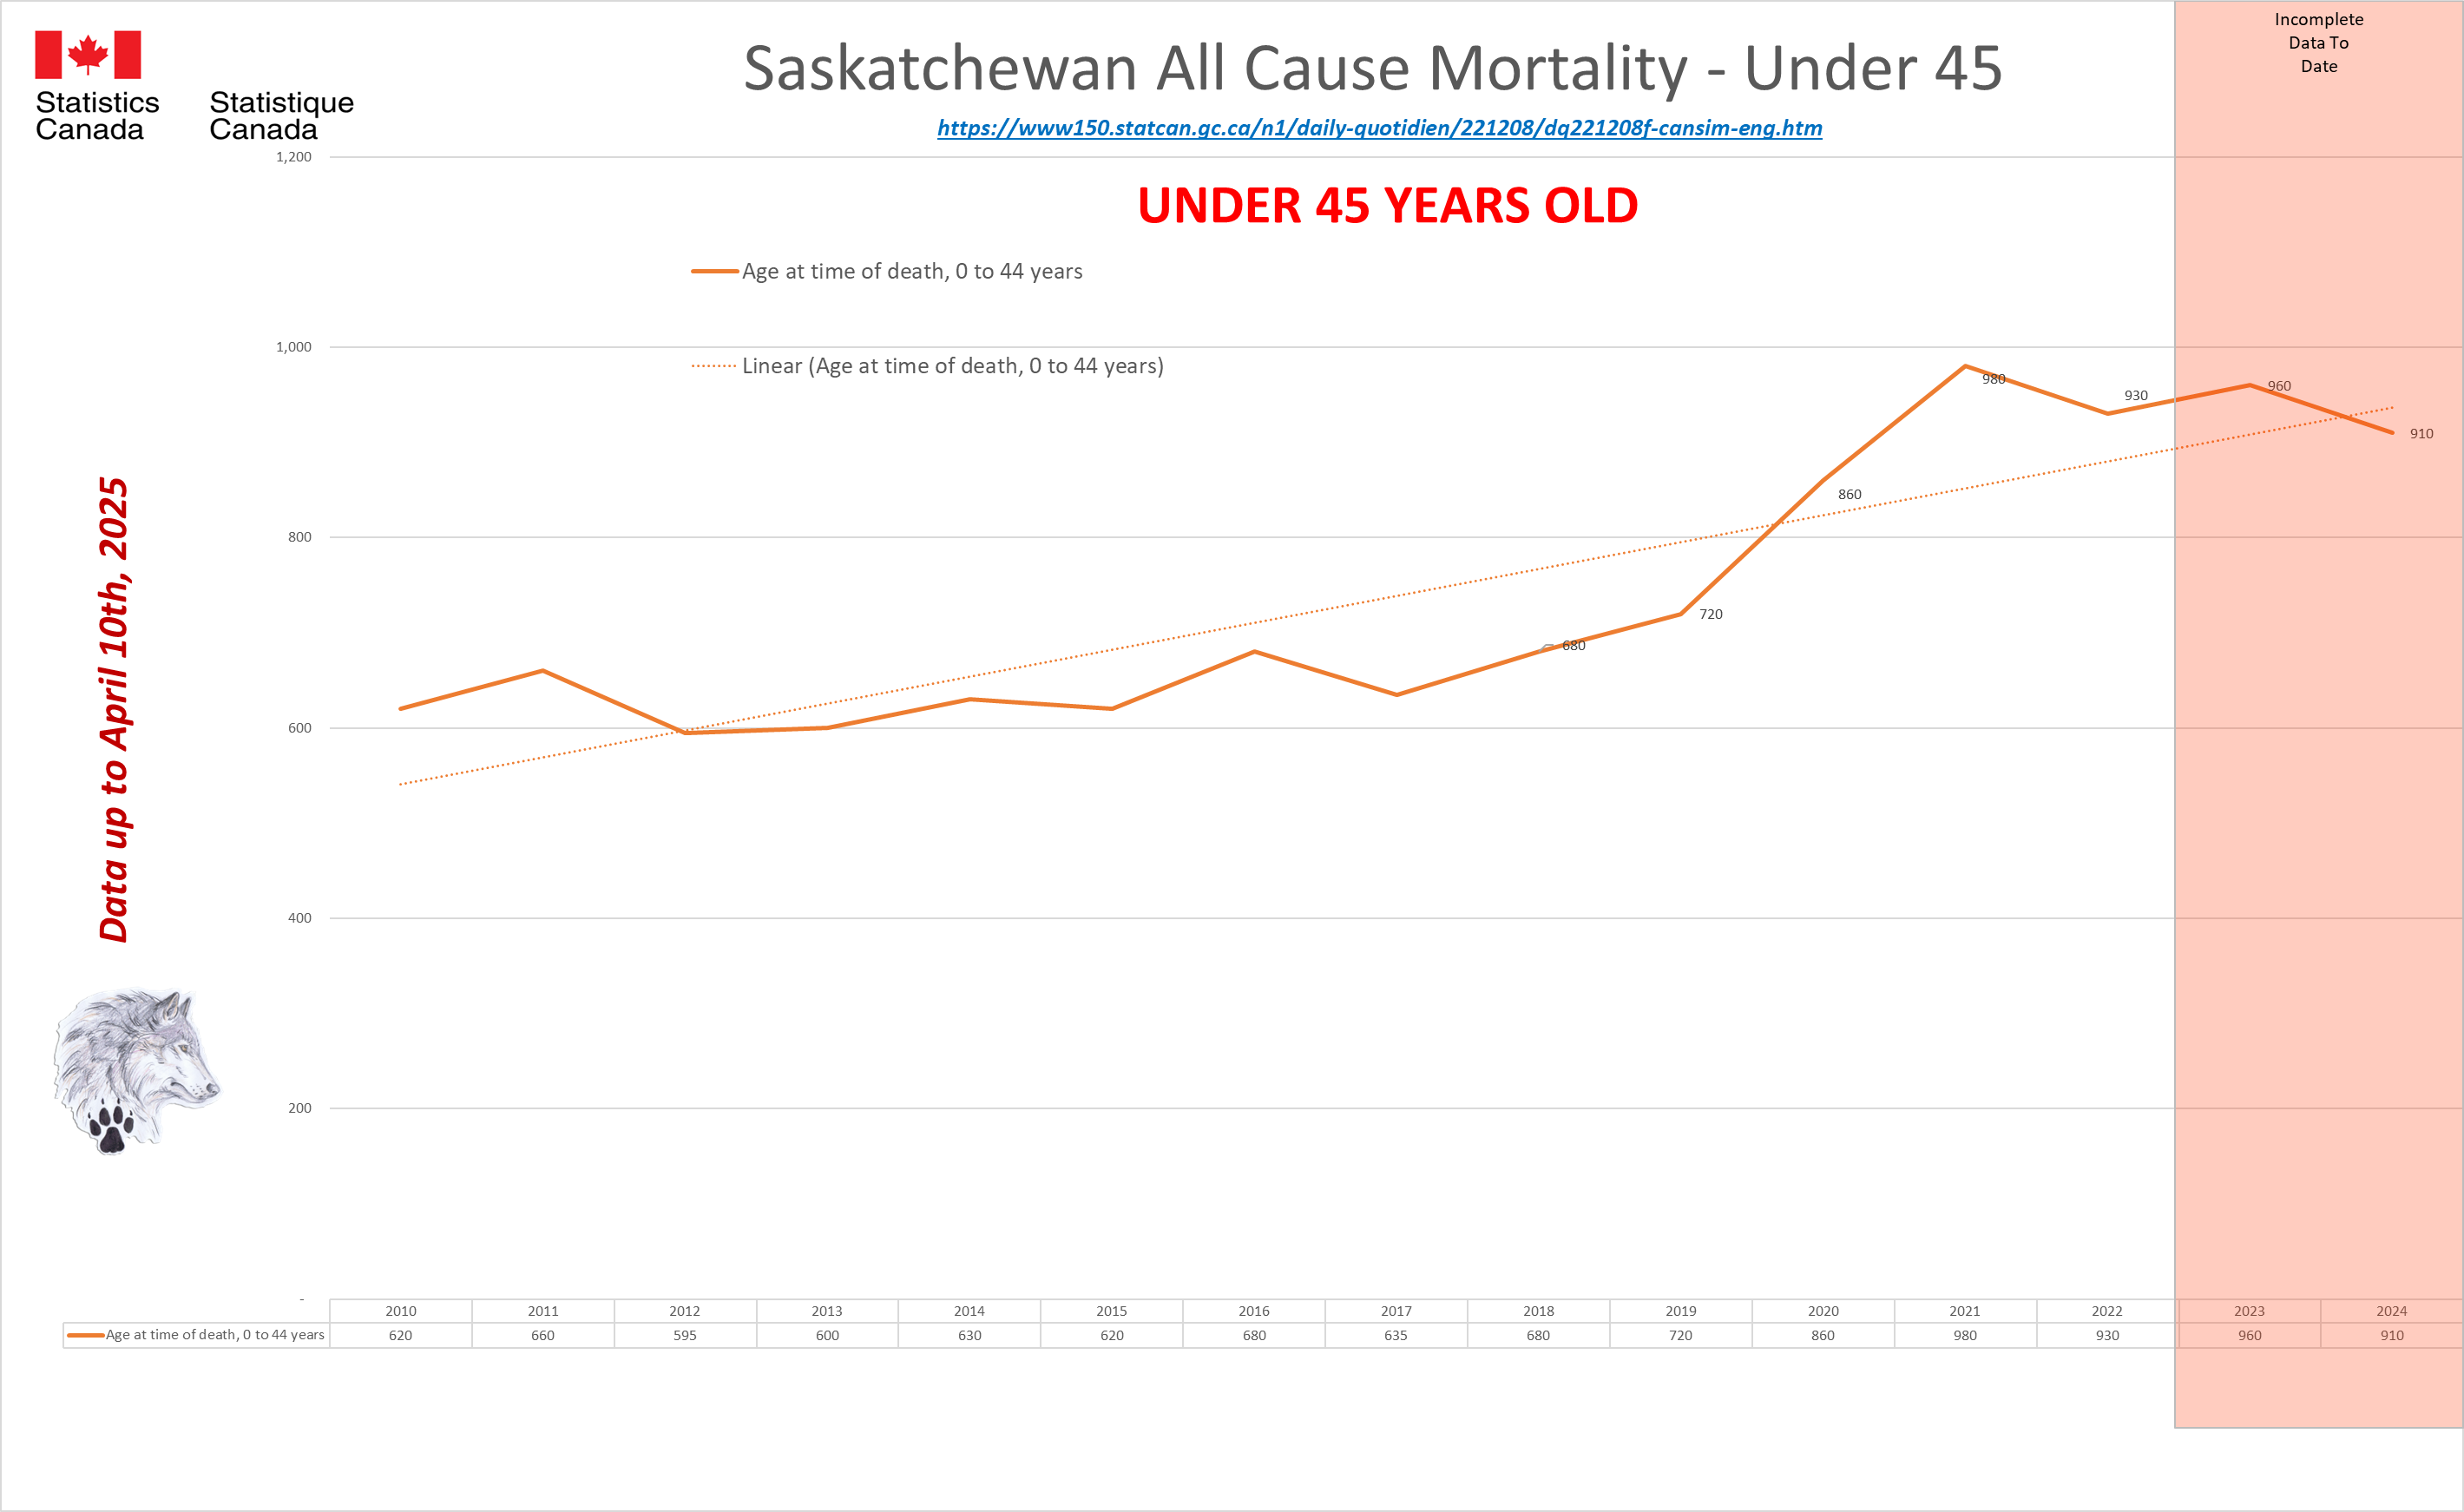 |
Manitoba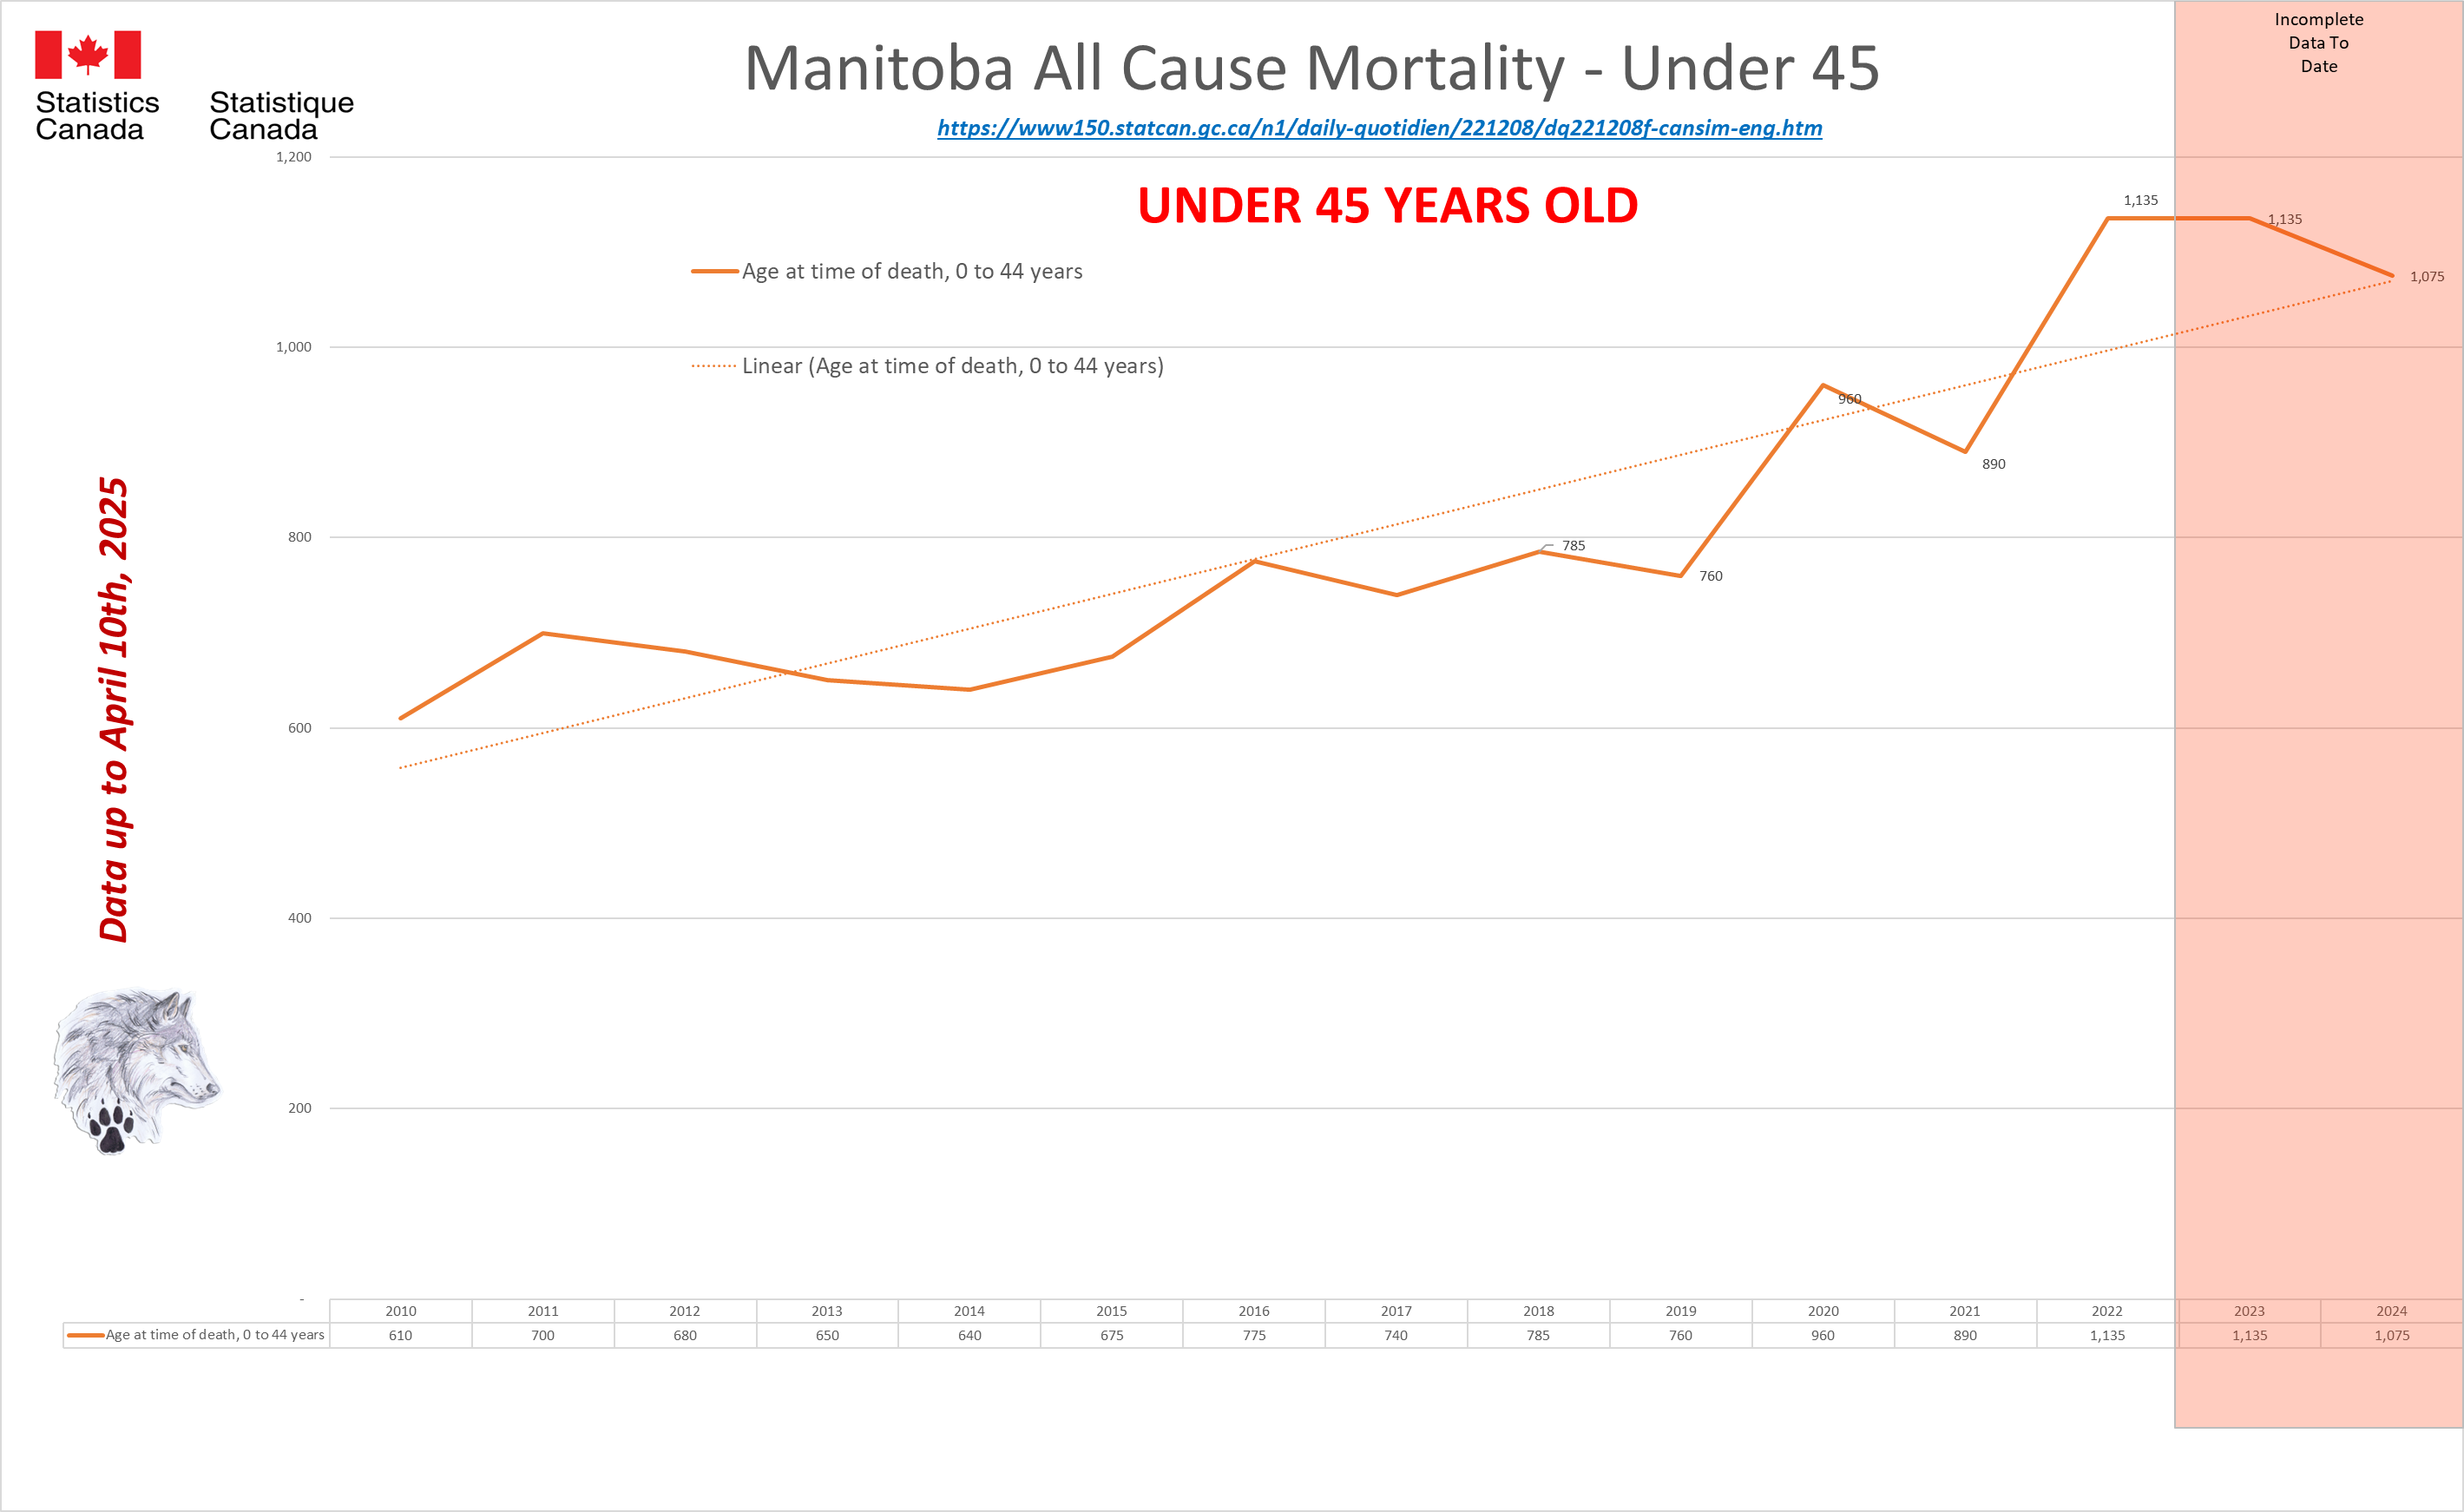 |
Ontario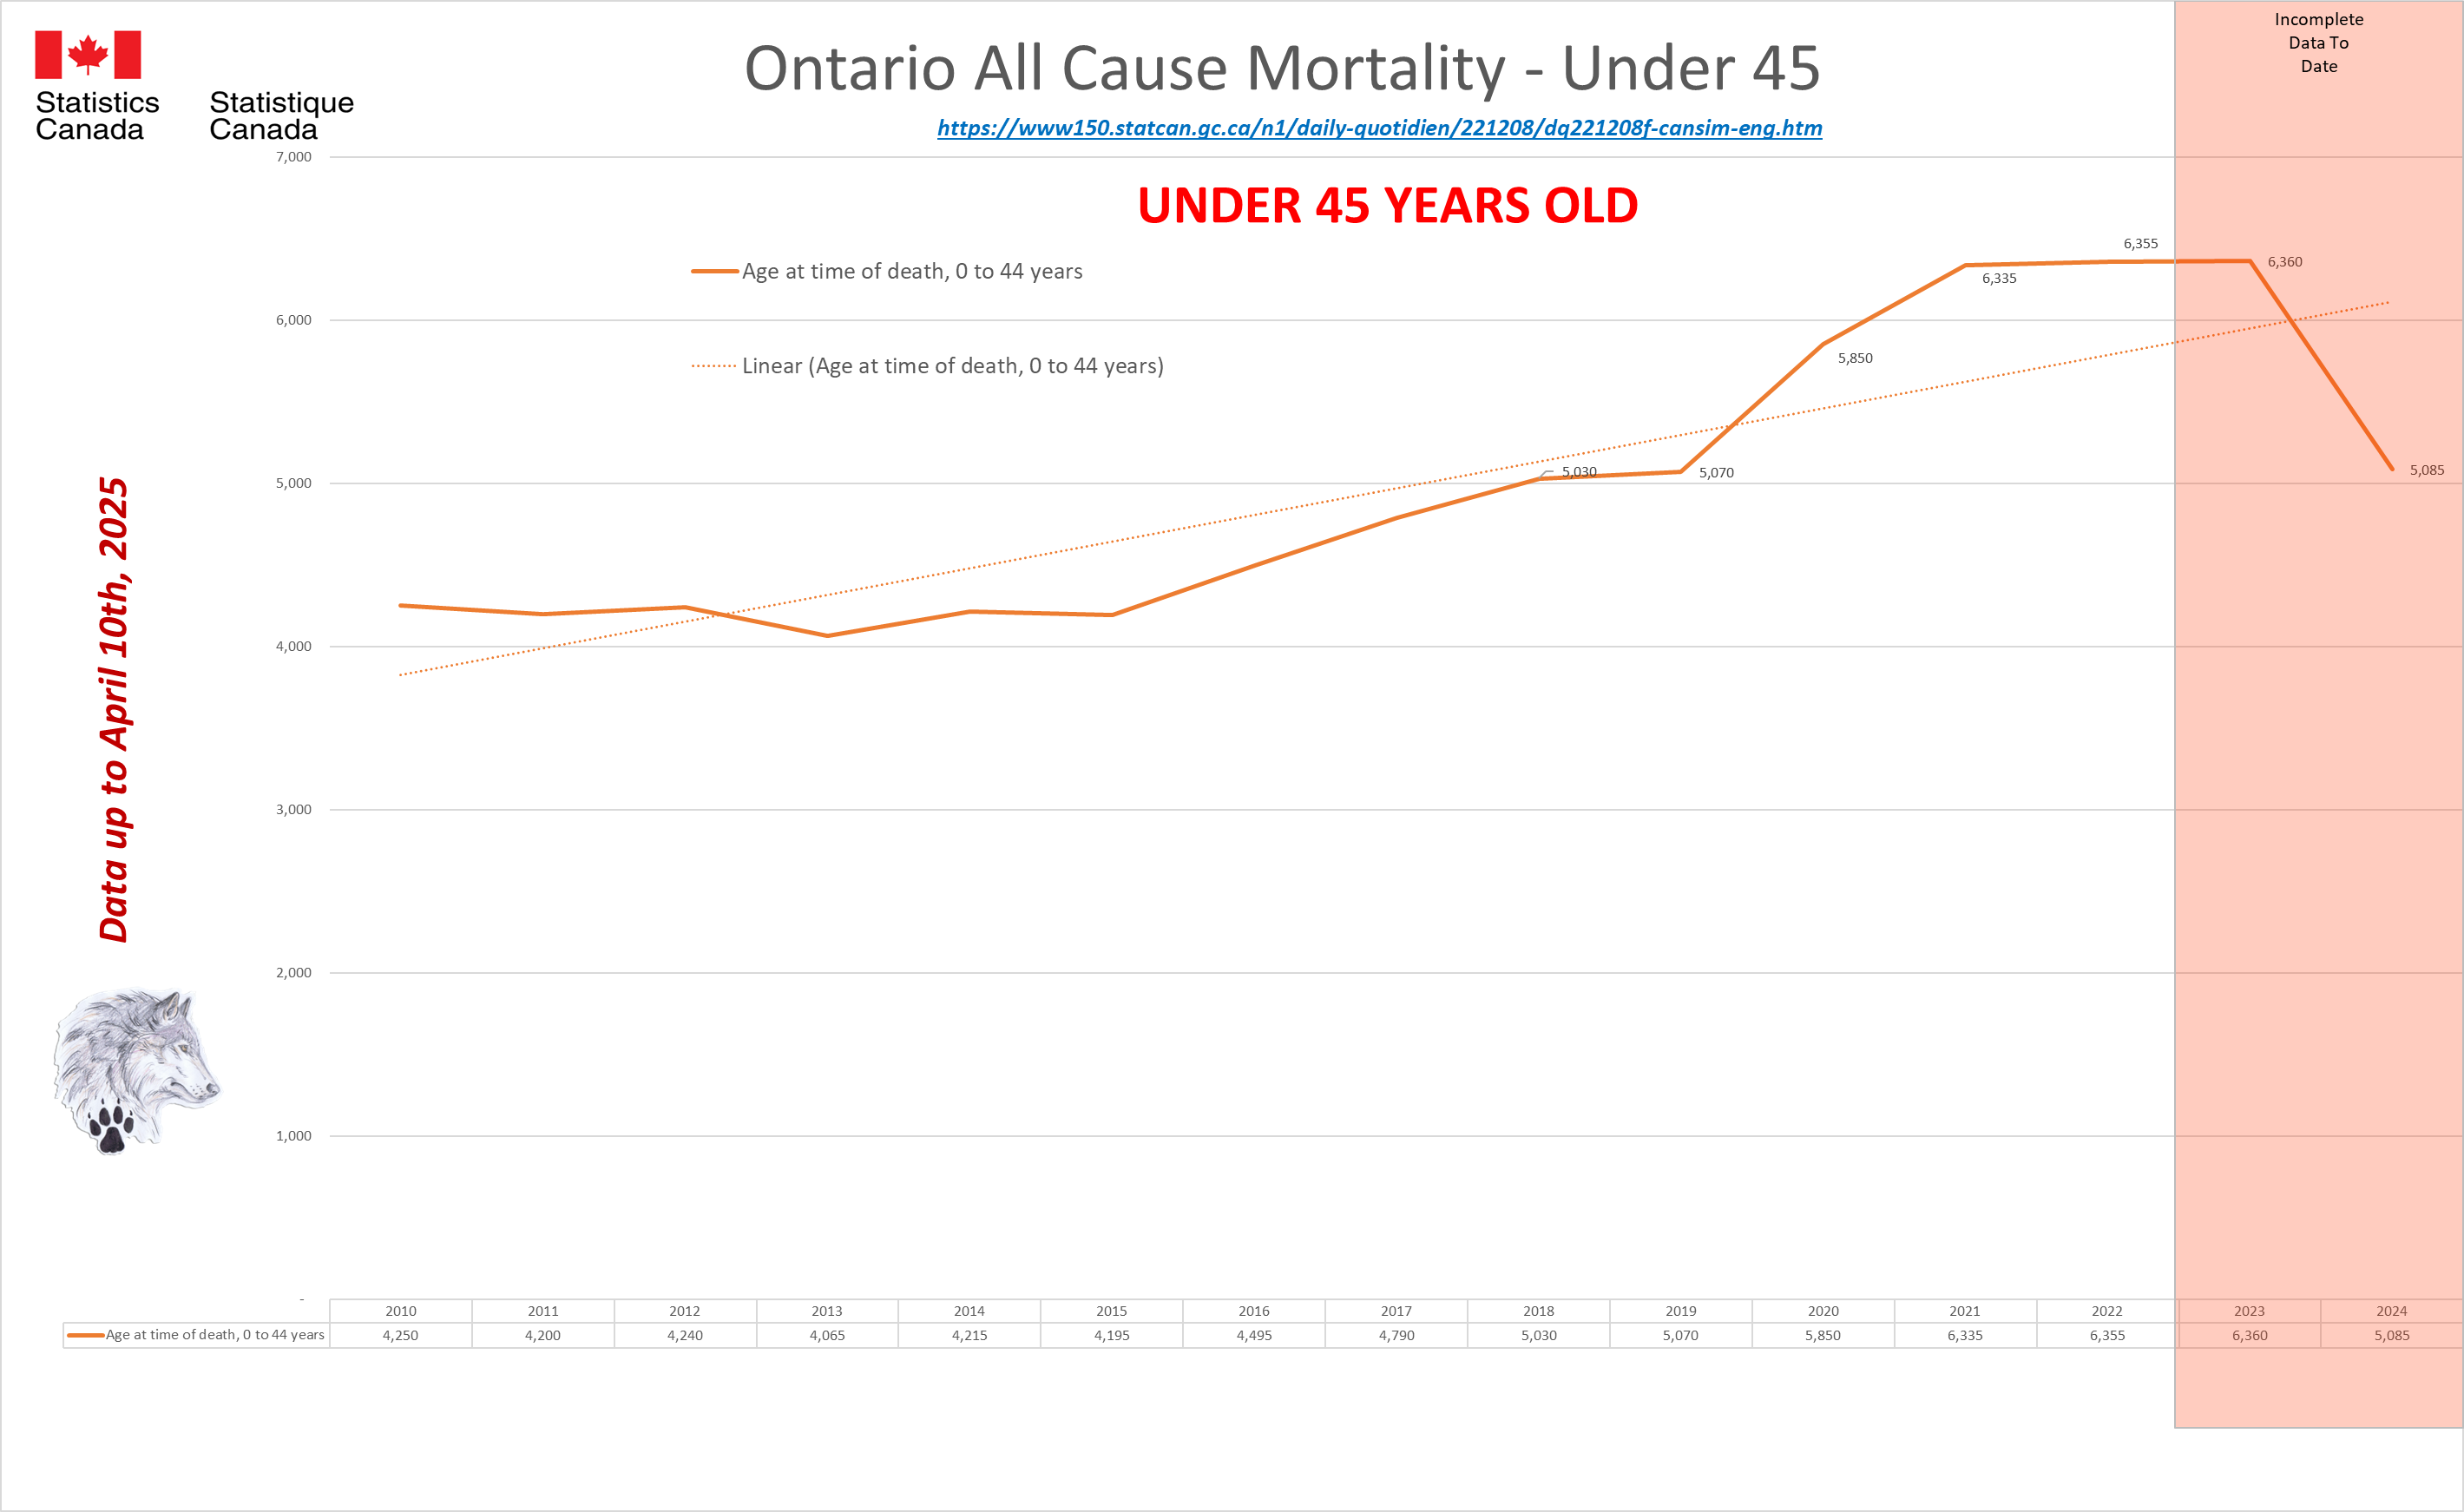 |
Quebec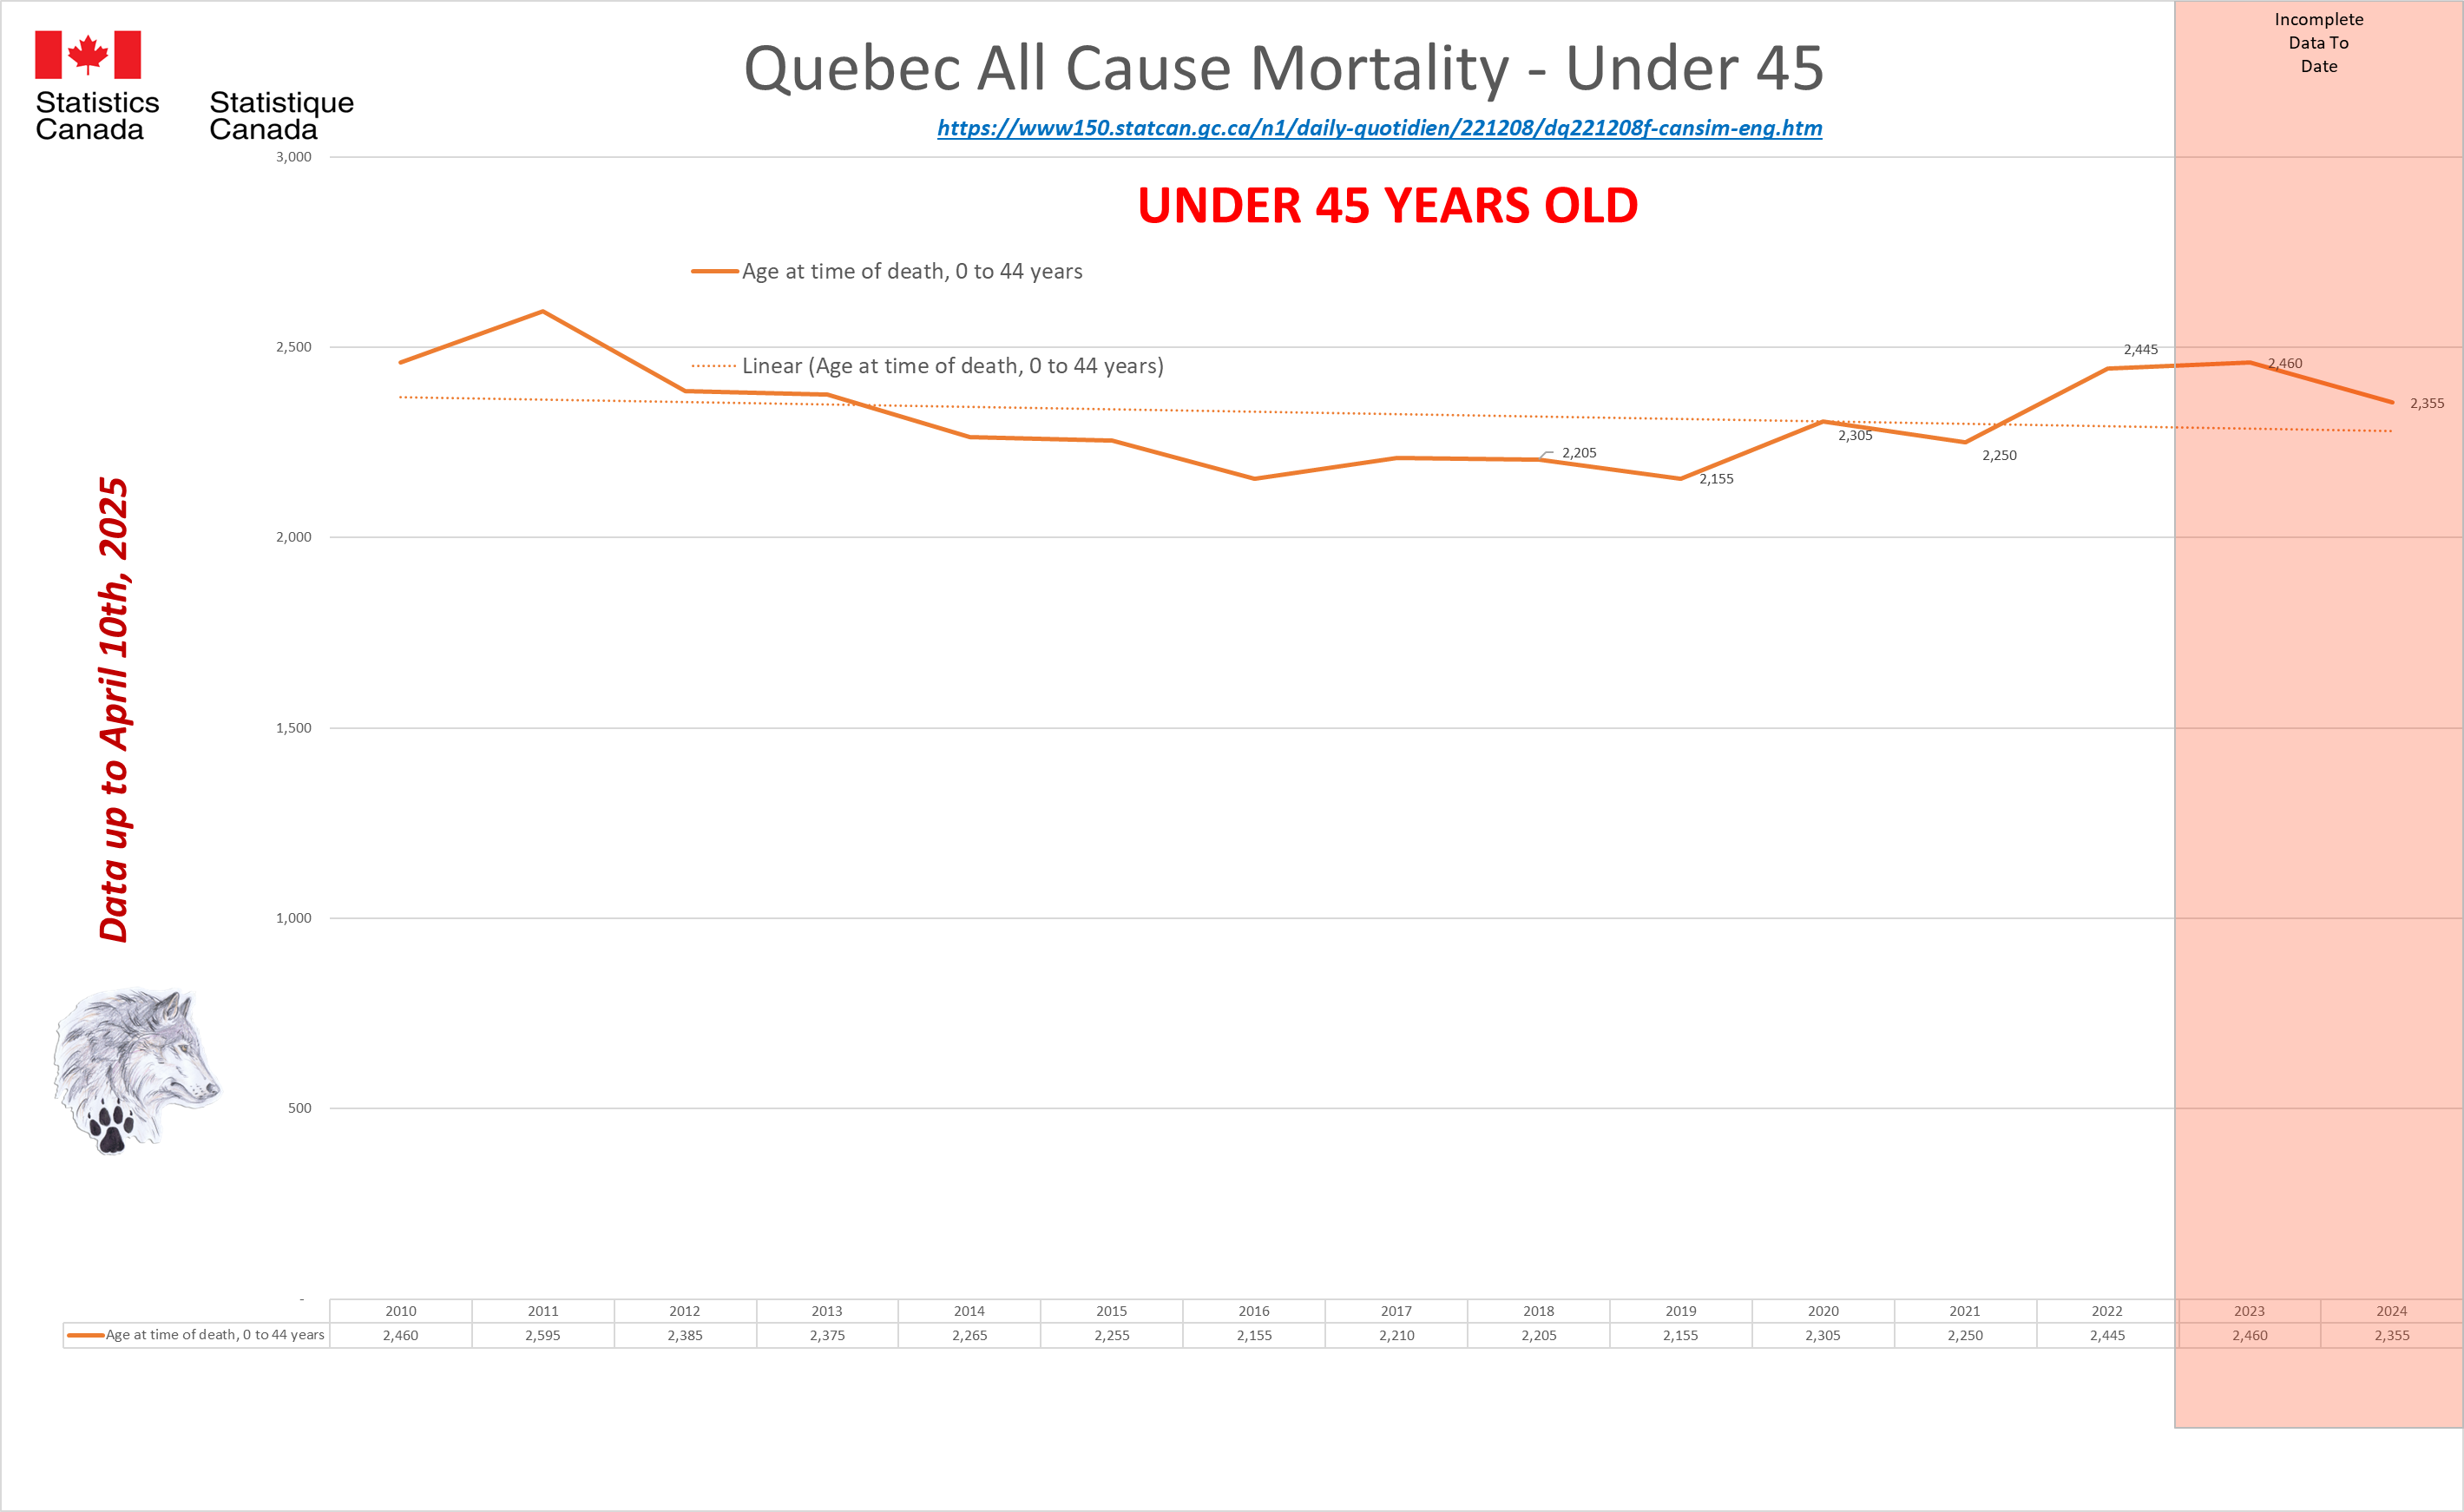 |
New Brunswick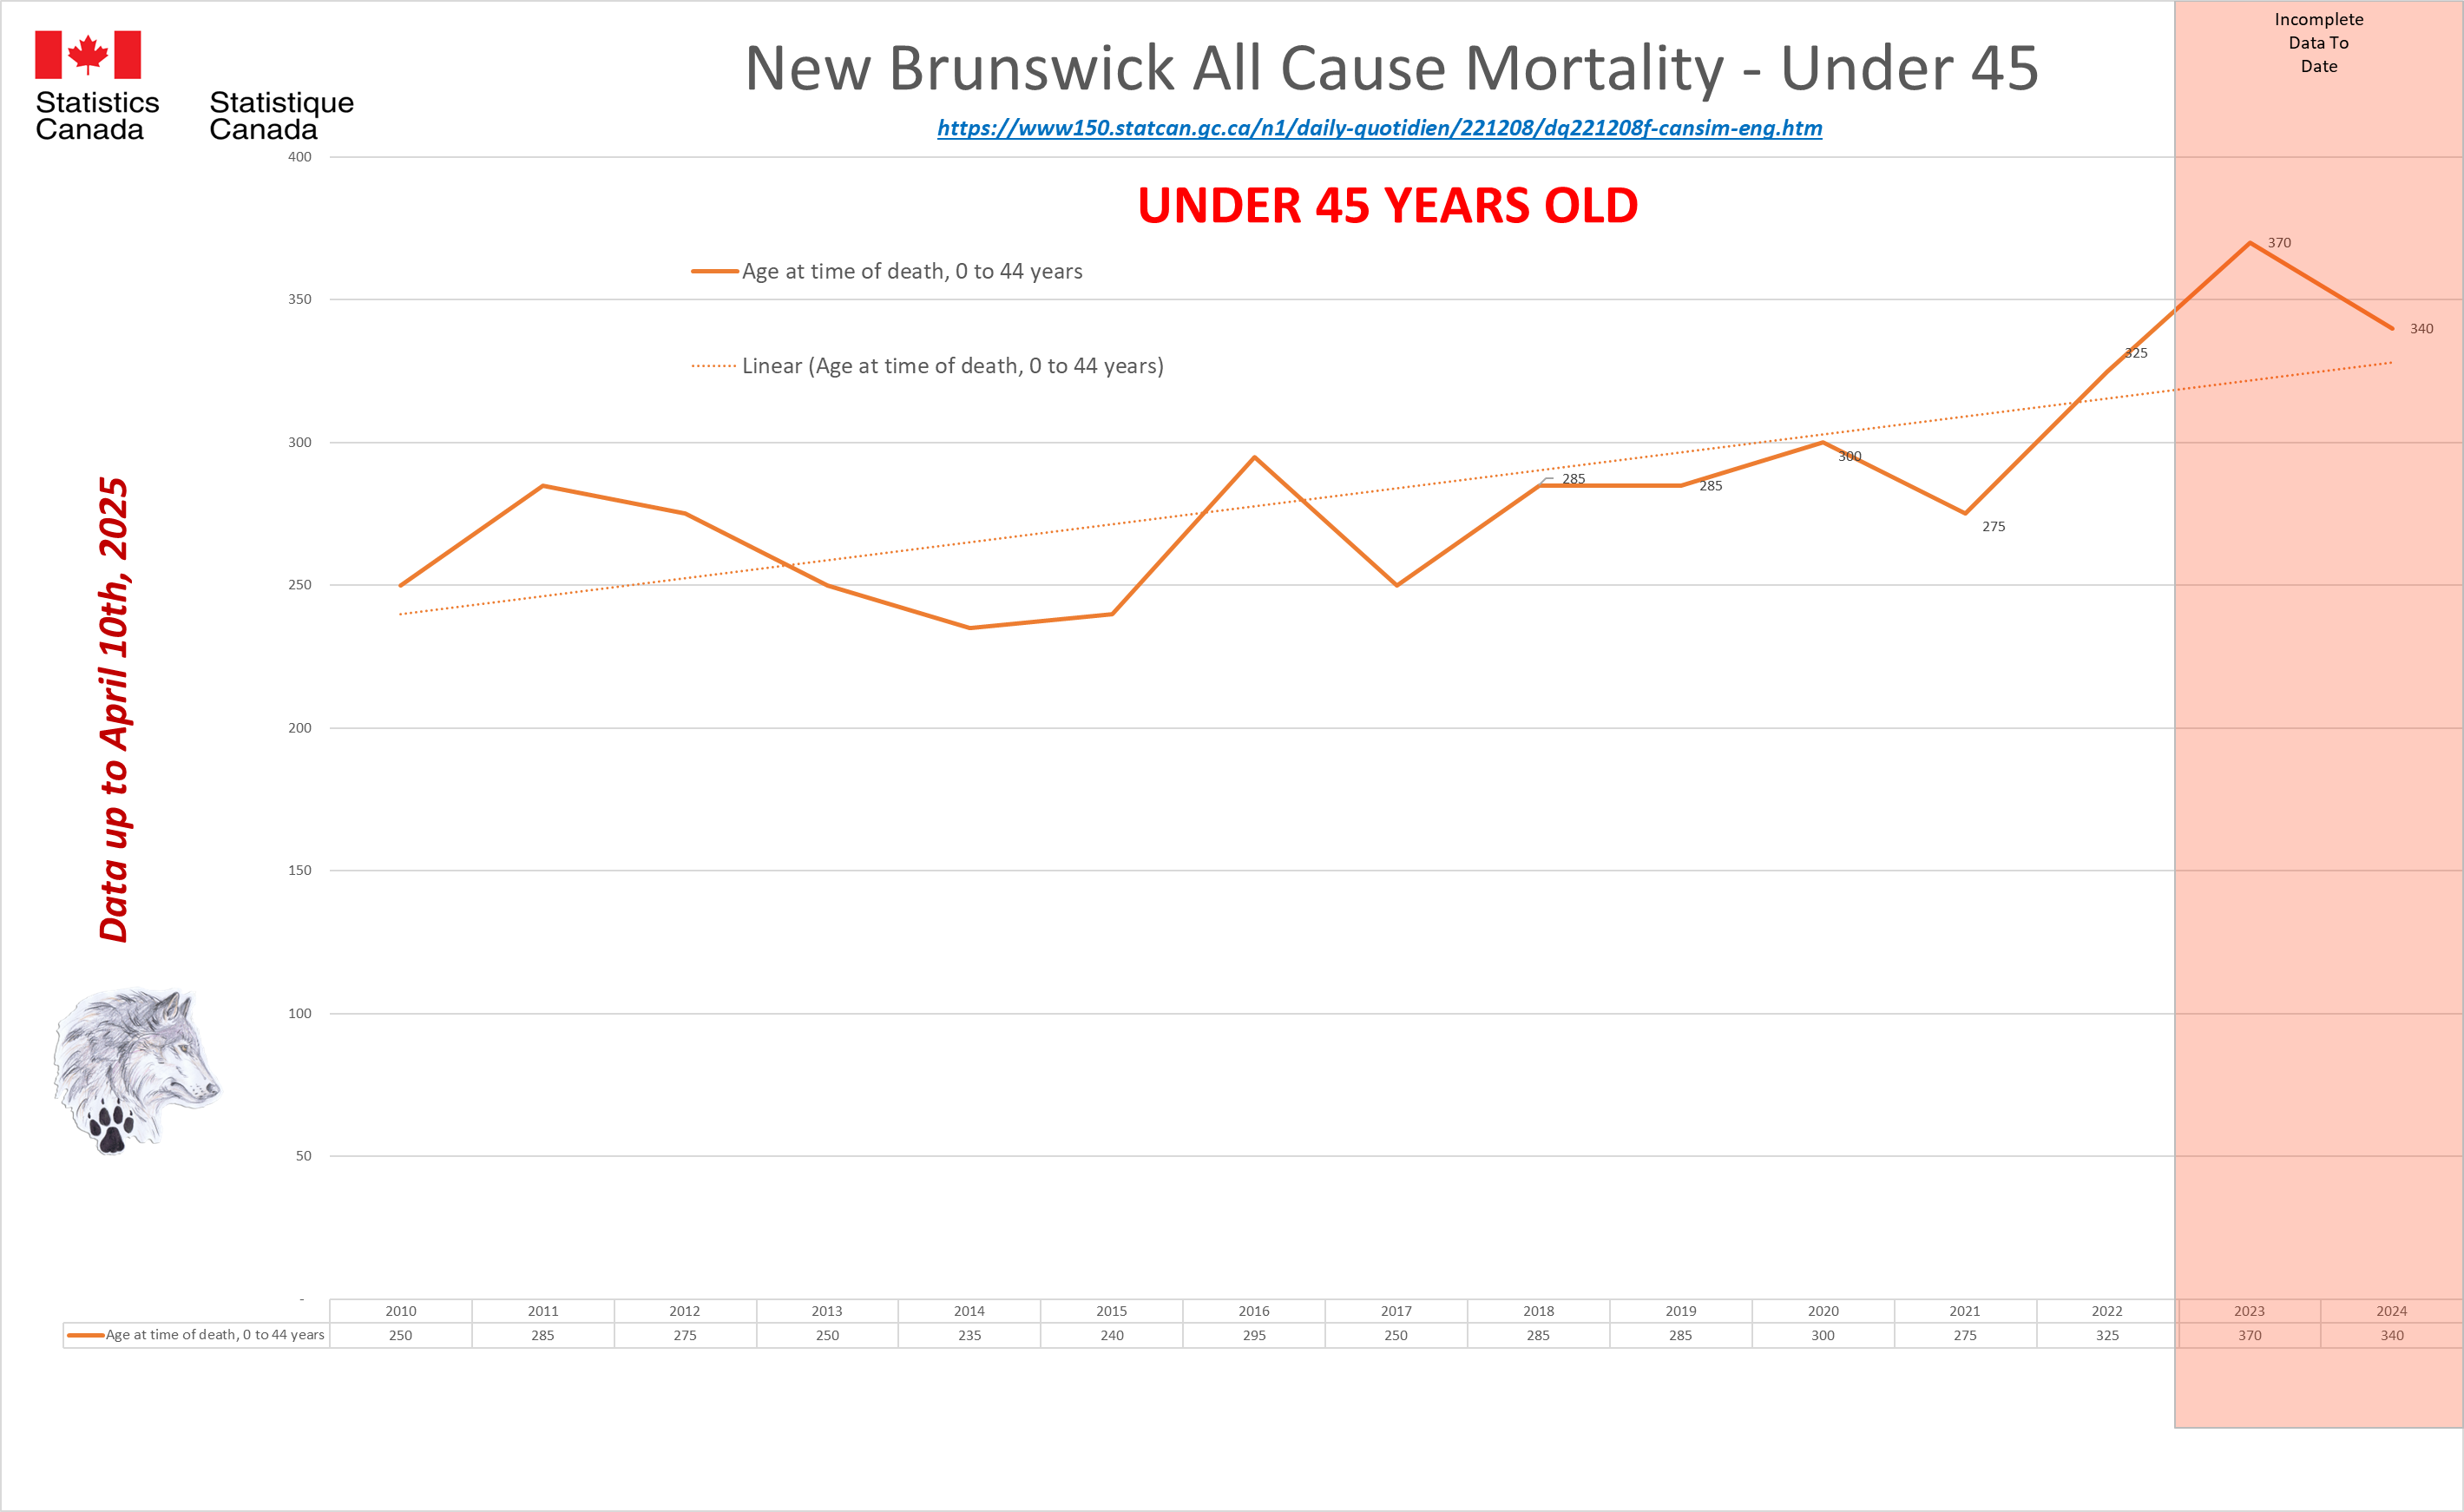 |
Newfoundland & Labrador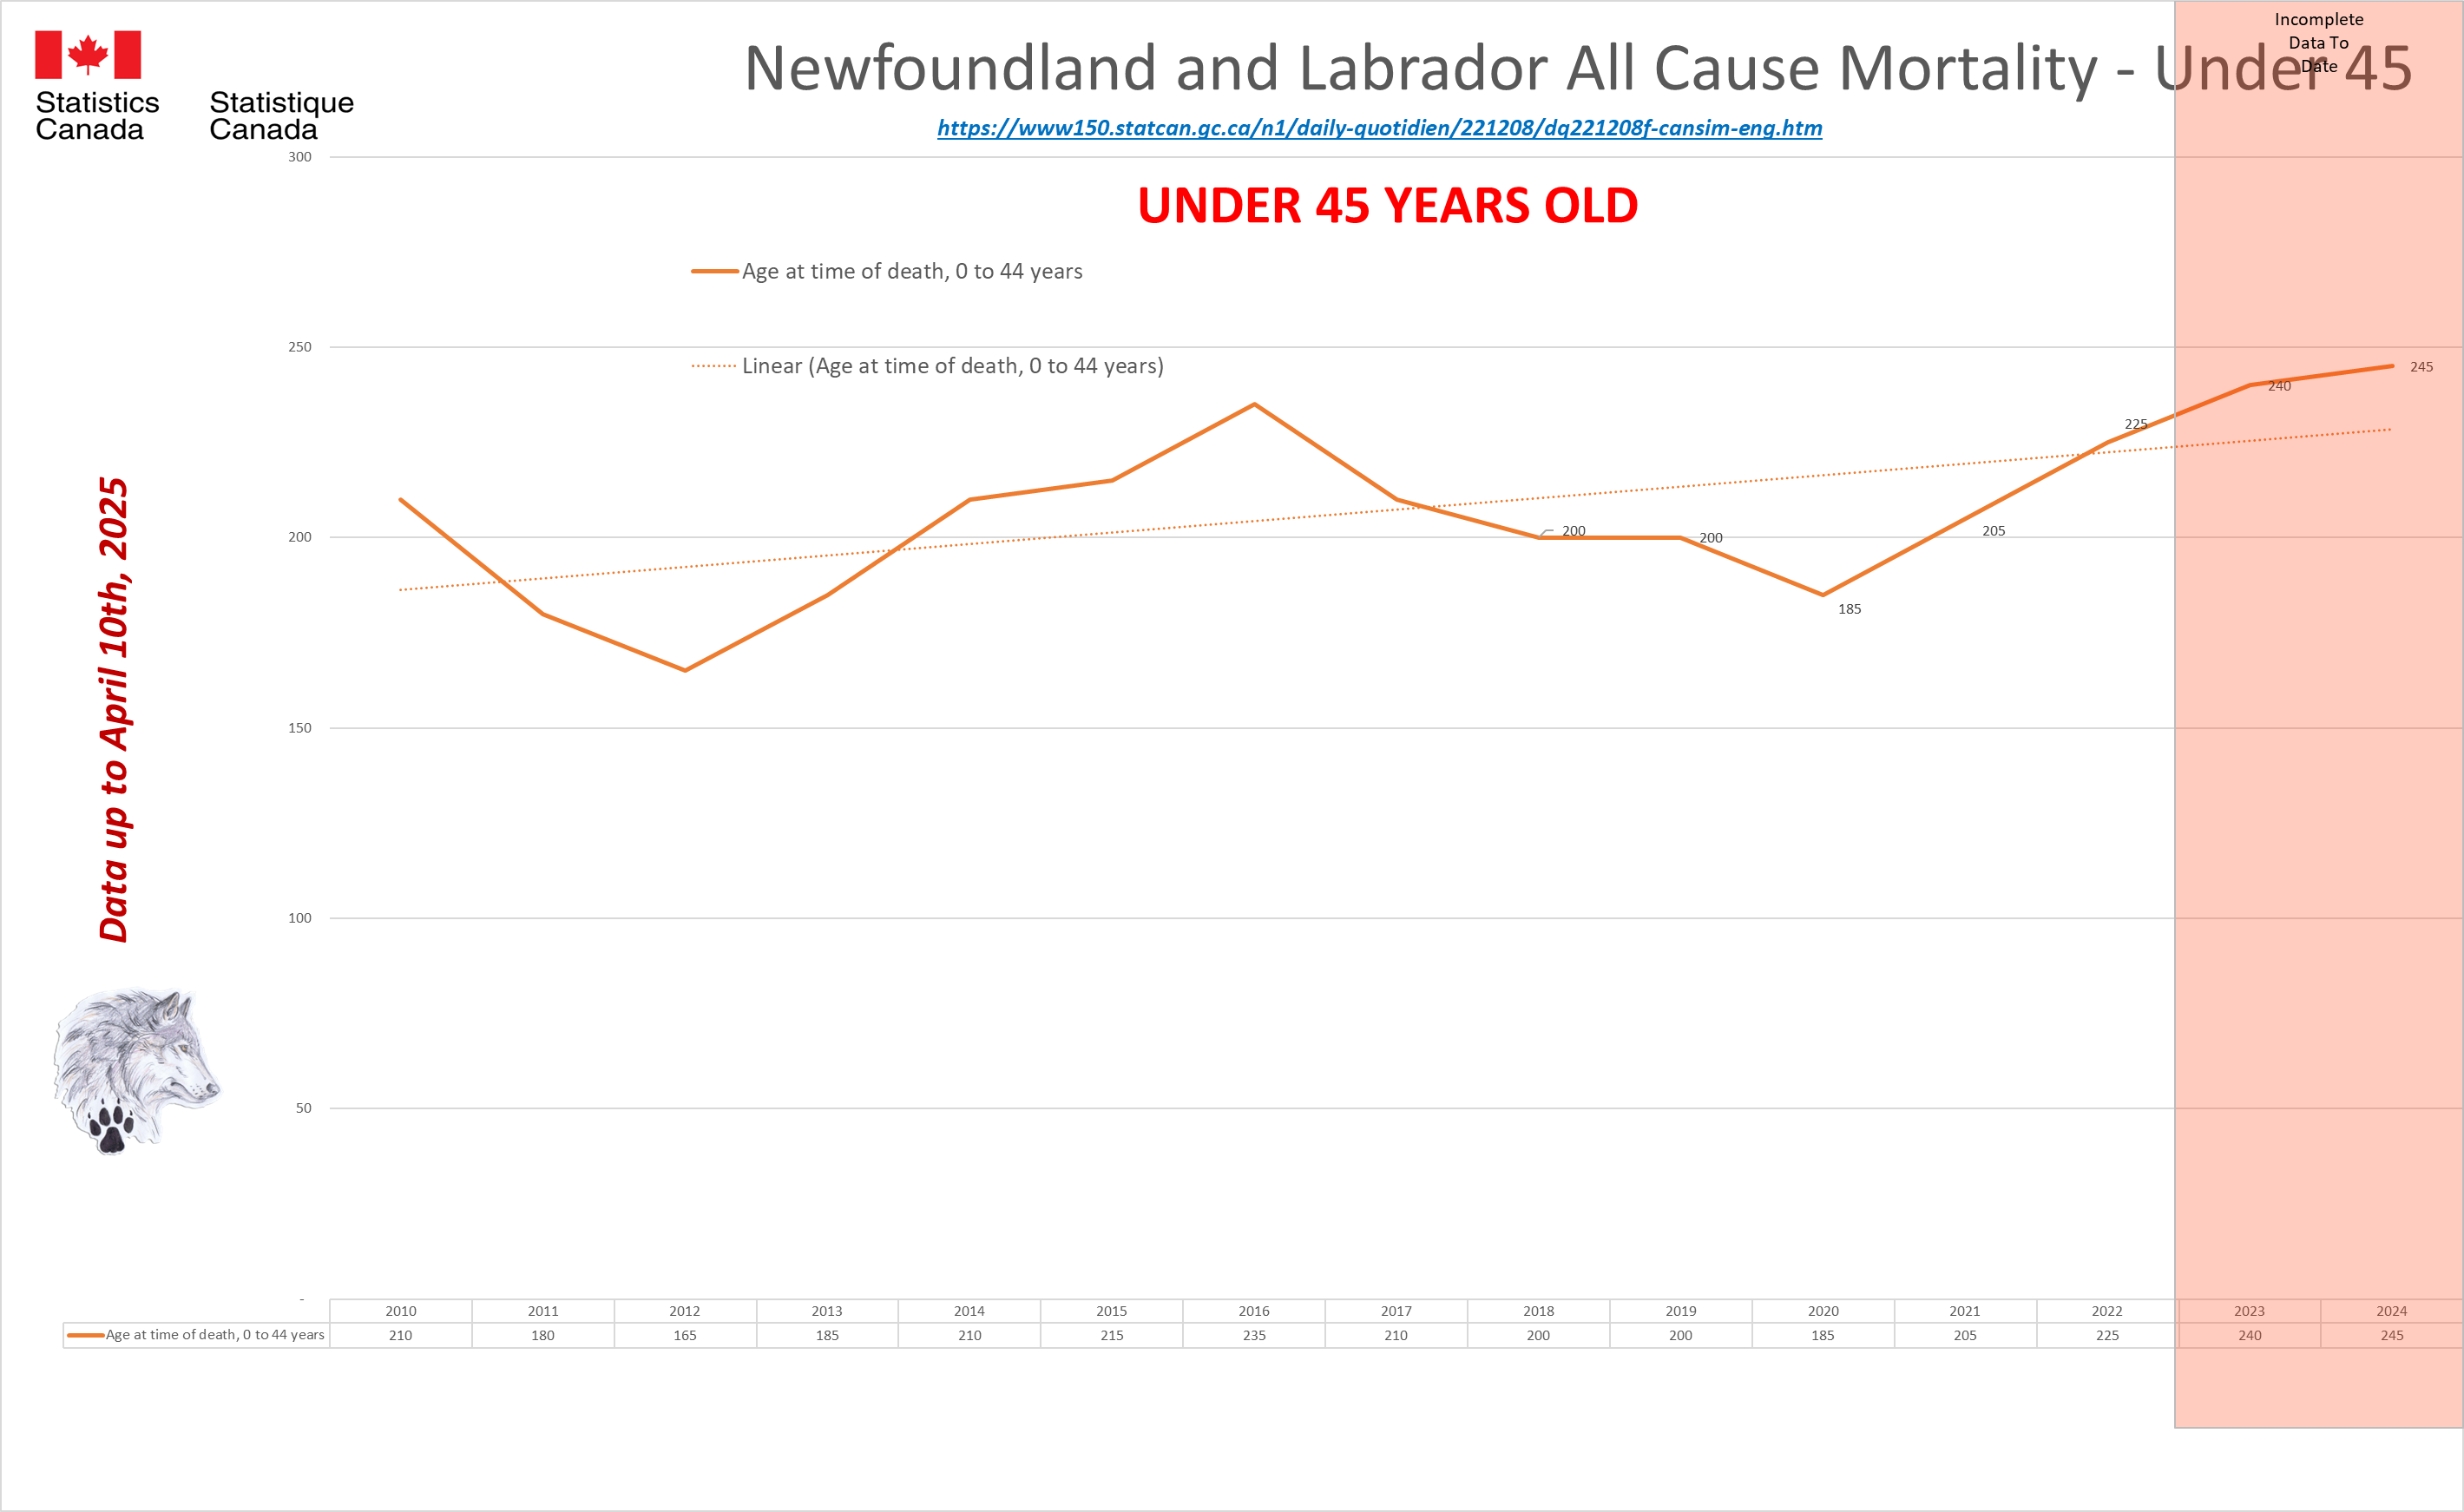 |
These numbers are alarming, but it is worse than it looks. Between the January and January 2025 updates the provinces added OVER 130K deaths to the total for Canada (to the end of 2023).
Federal and Provincial totals for 2021/2023 differ by 21,575 in the same data set. Federal “By Age” and Federal “By Cause” totals differ by 14,275 reported deaths. Alberta, BC, & NWT have reported up to Week 44 for 2024. Quebec posted partial data for Week 43. However, even these numbers are not yet confirmed and will rise in the coming months.
2021 Changes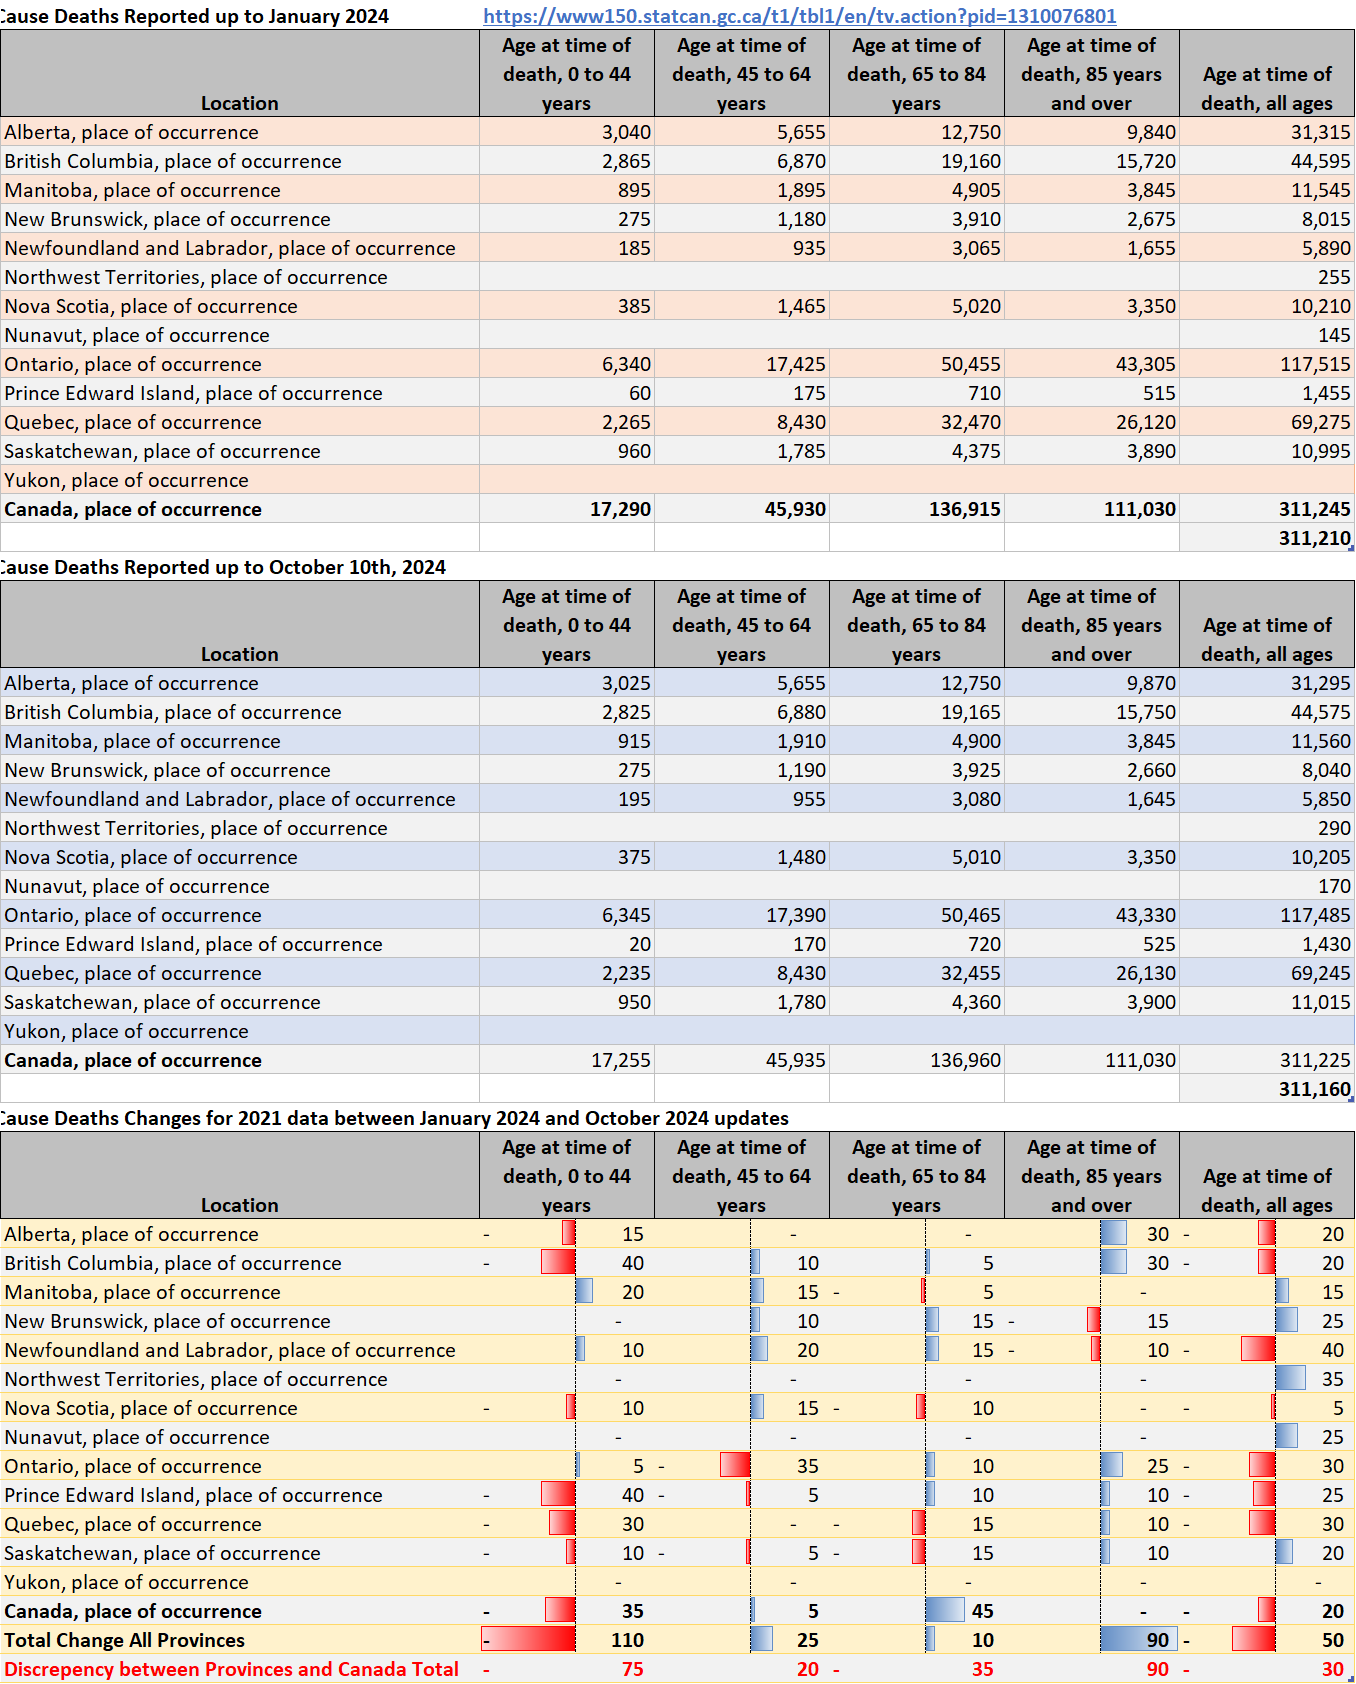 |
2022 Changes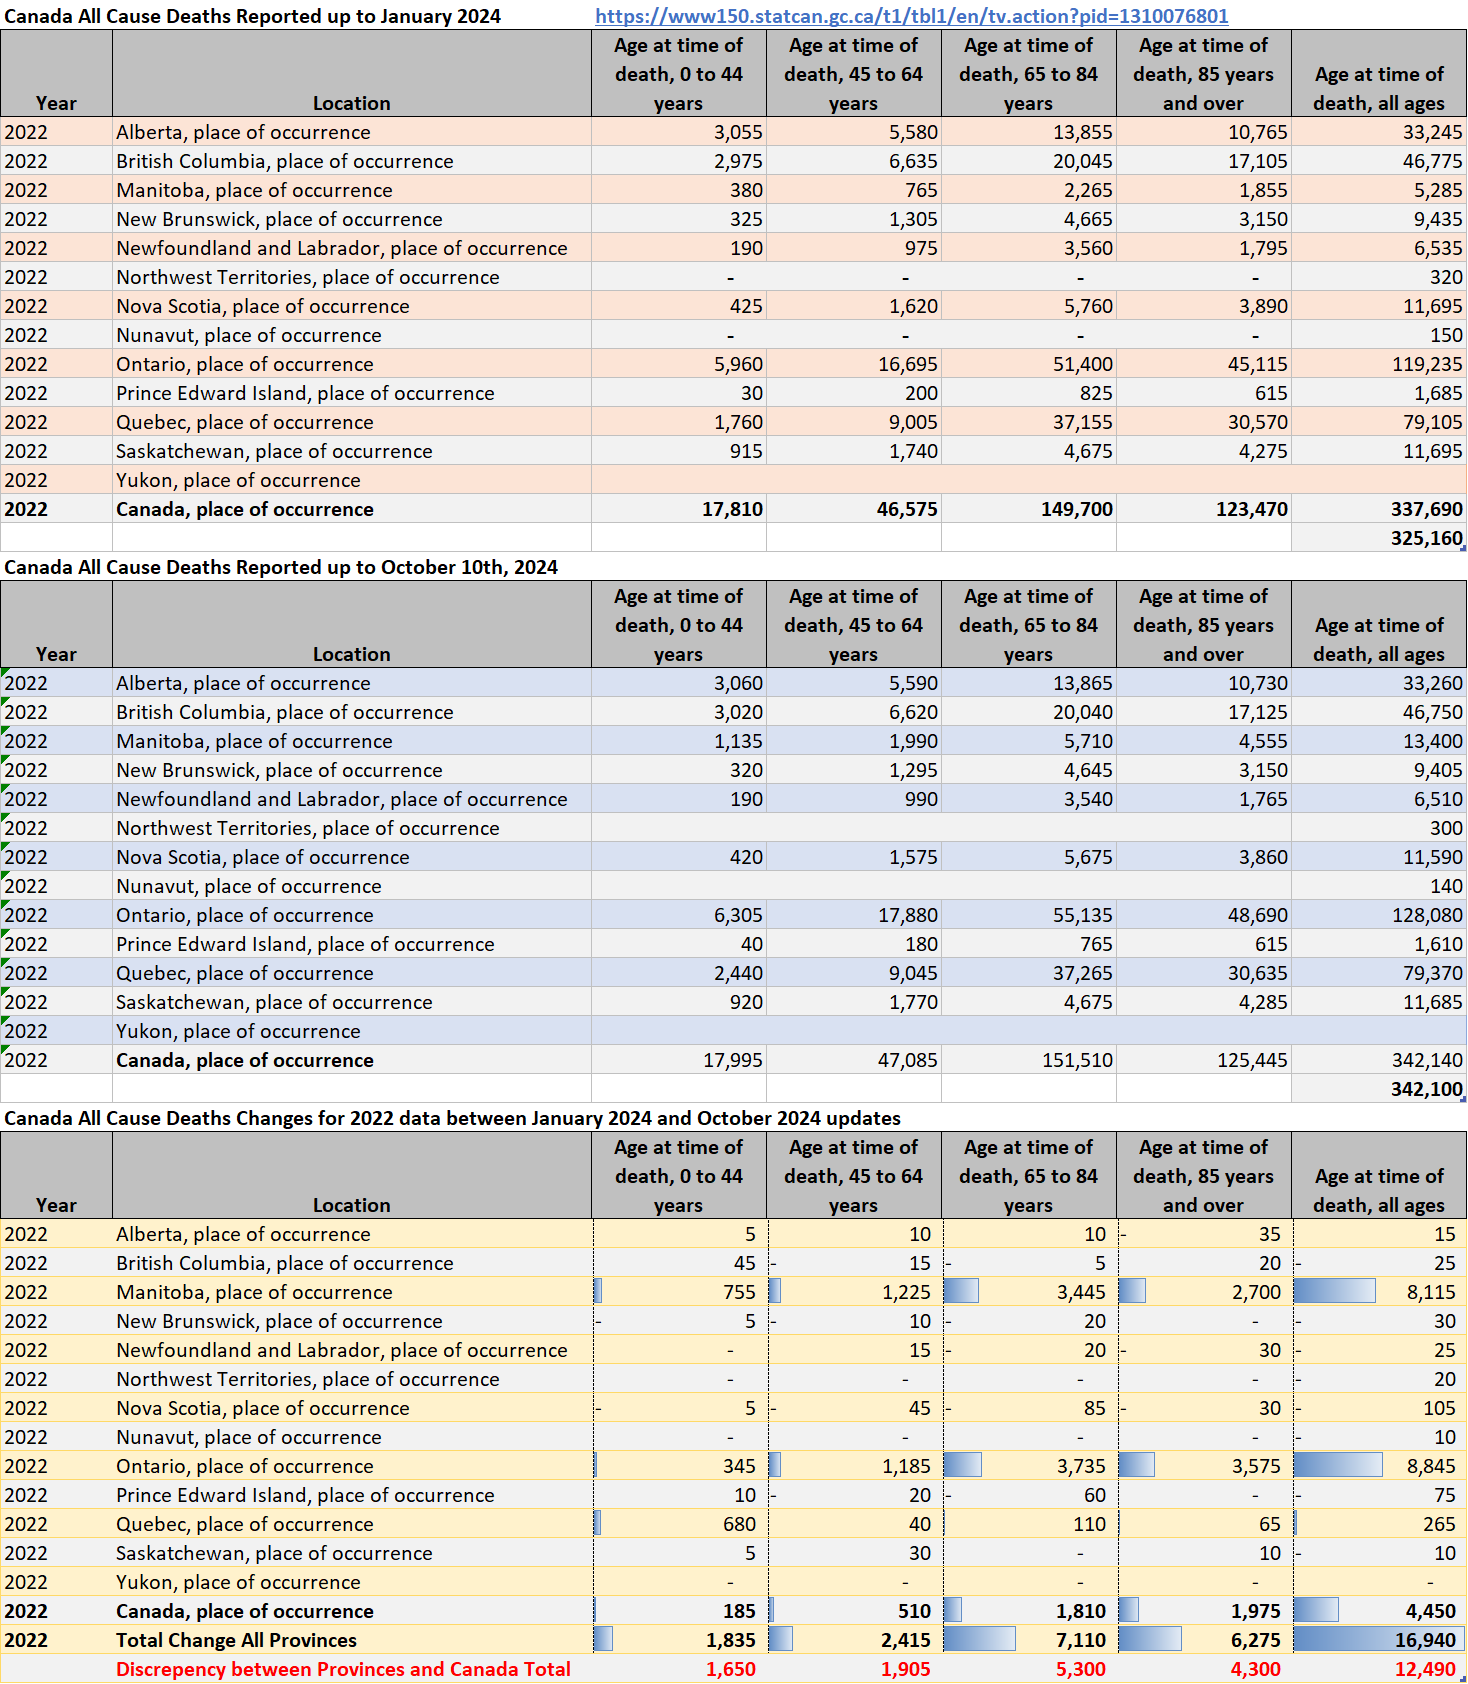 |
2023 Changes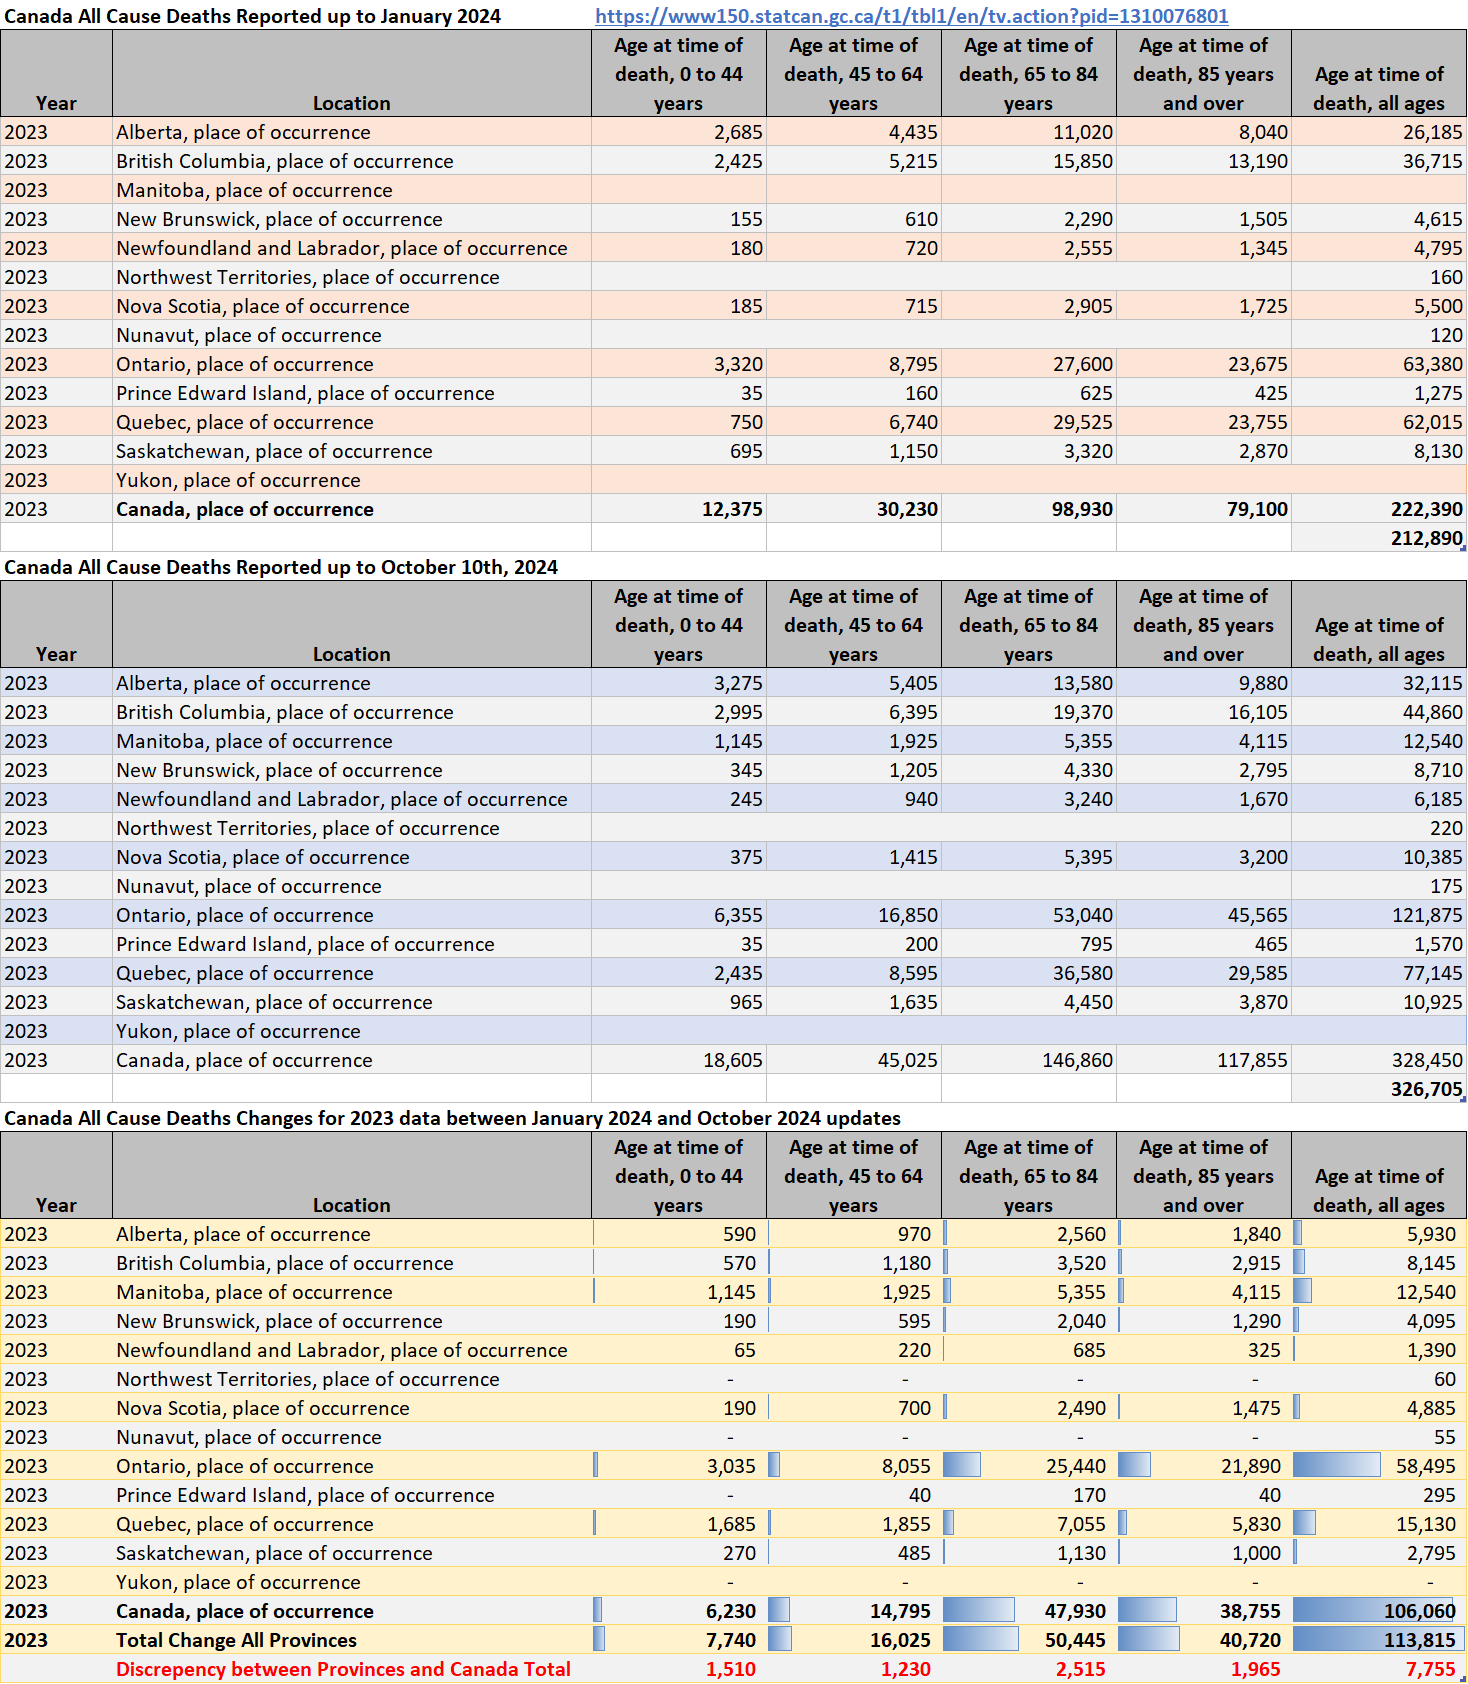 |
2024 Changes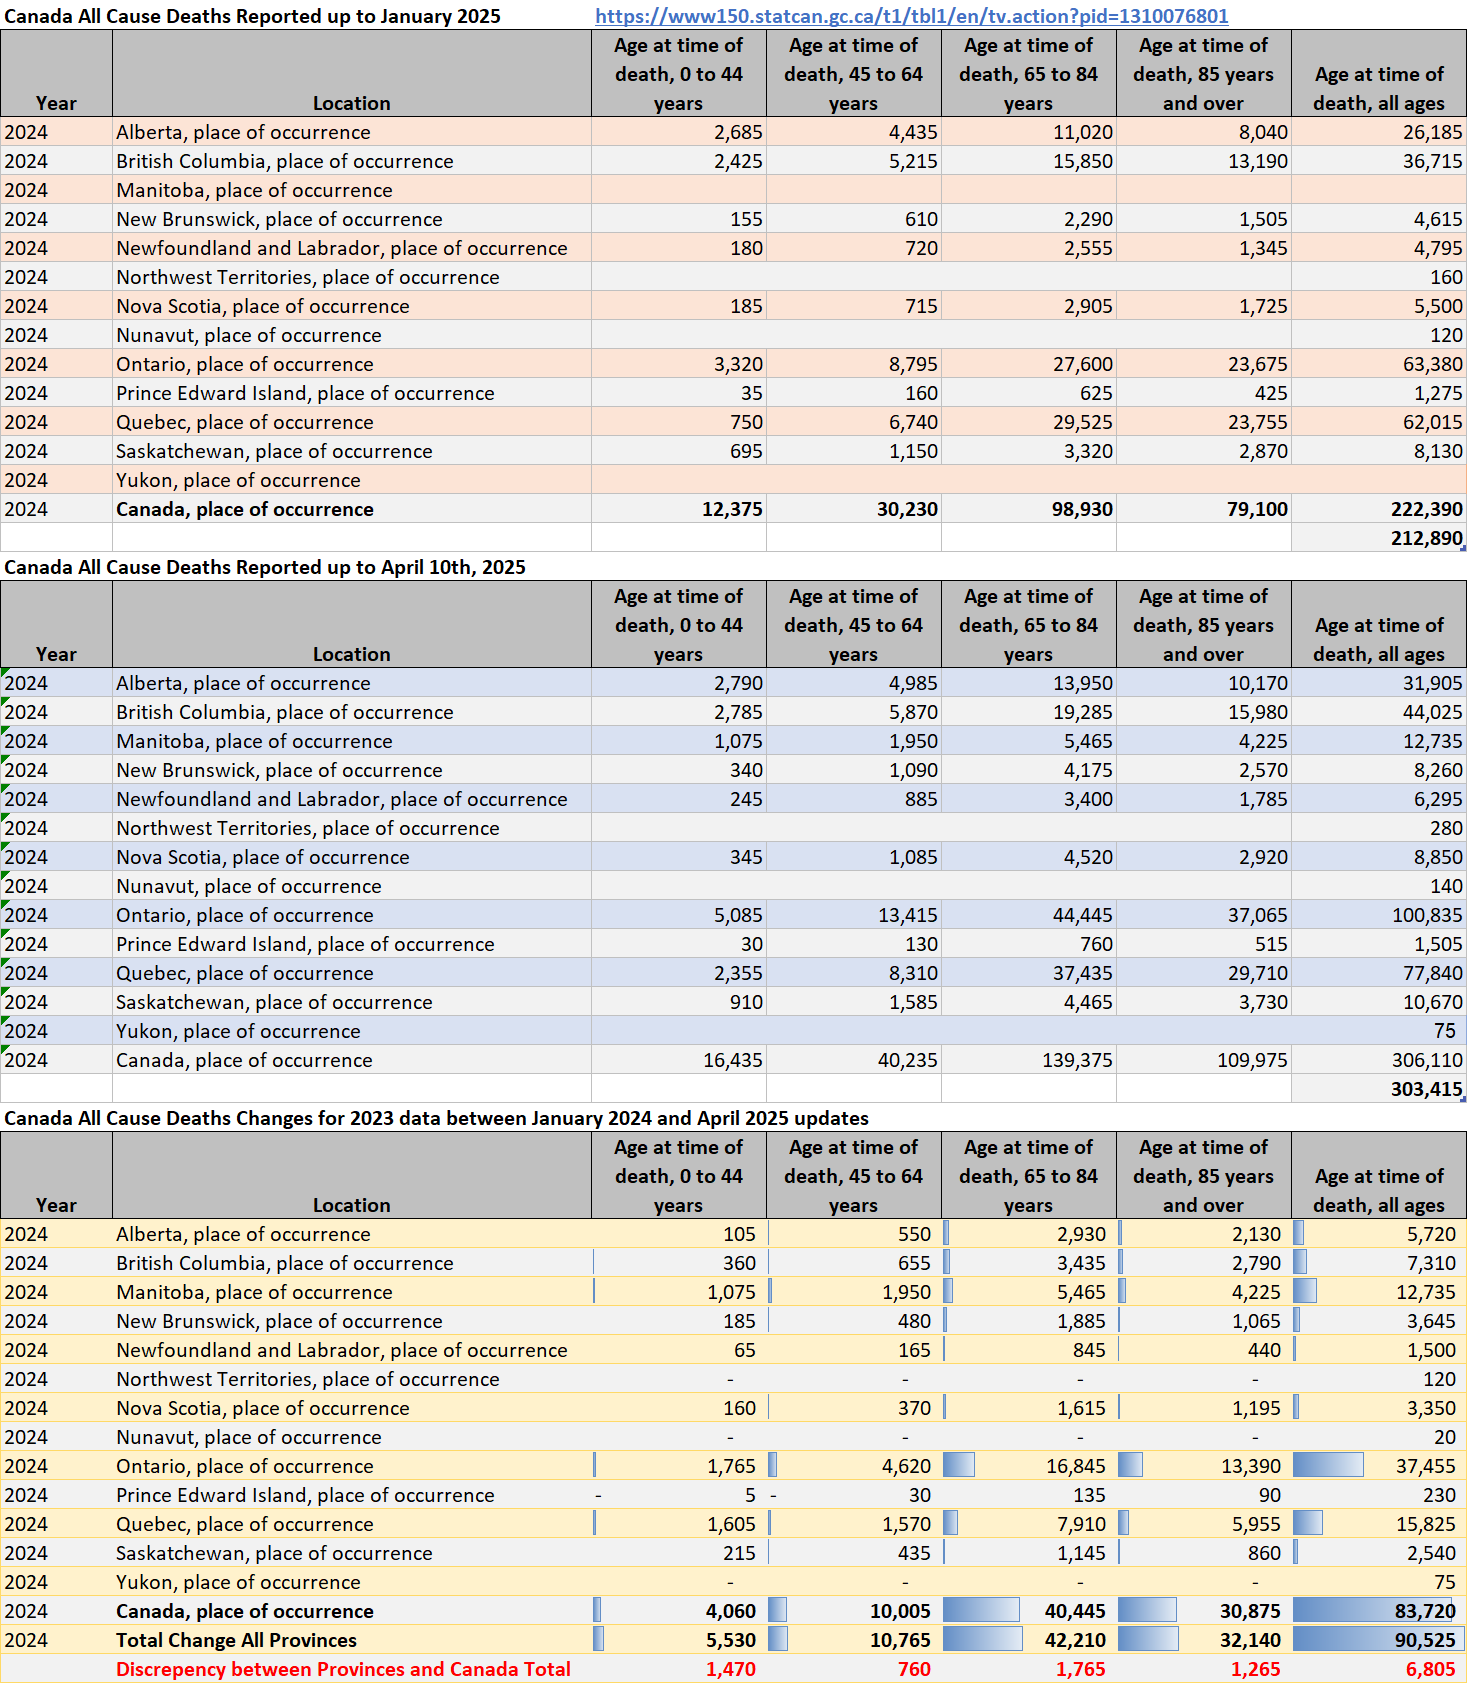 |
All-Cause Mortality-COVID/Non COVID (2019-2024)
All Provinces
[Download PDF Link for June 2025 Data]
[Download PDF Link for By Cause - Jan-Jun compare Data]
[Download PDF Link for By Age - Jan-Jun compare Data]
Canada Archived reports
[Download PDF Link for May 2023 Data]
[Download PDF Link for June 2023 Data]
[Download PDF Link for July 2023 Data]
[Download PDF Link for August 2023 Data]
[Download PDF Link for September 2023 Data]
[Download PDF Link for October 2023 Data]
[Download PDF Link for November 2023 Data]
[Download PDF Link for December 2023 Data]
[Download PDF Link for January 2024 Data]
[Download PDF Link for February 2024 Data]
[Download PDF Link for March 2024 Data]
[Download PDF Link for April 2024 Data]
[Download PDF Link for May 2024 Data]
[Download PDF Link for June 2024 Data]
[Download PDF Link for July 2024 Data]
[Download PDF Link for August 2024 Data]
[Download PDF Link for September 2024 Data]
[Download PDF Link for October 2024 Data]
[Download PDF Link for November 2024 Data]
[Download PDF Link for December 2024 Data]
[Download PDF Link for January 2025 Data]
[Download PDF Link for February 2025 Data]
[Download PDF Link for March 2025 Data]
[Download PDF Link for April 2025 Data]
[Download PDF Link for May 2025 Data]
back to top of page
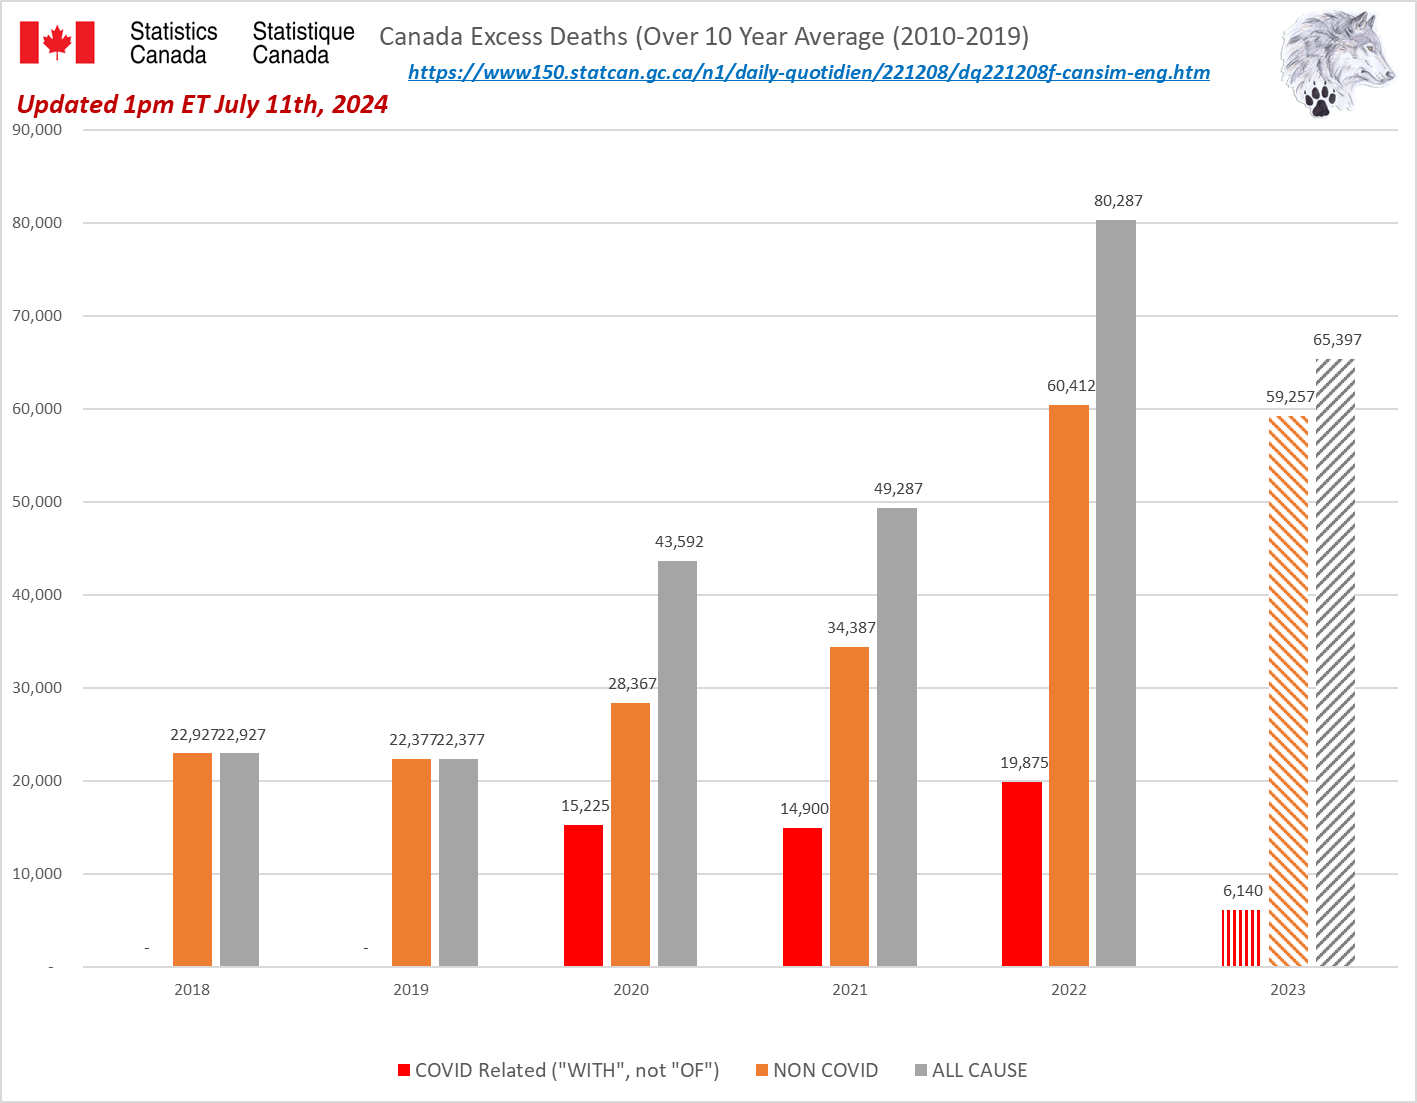
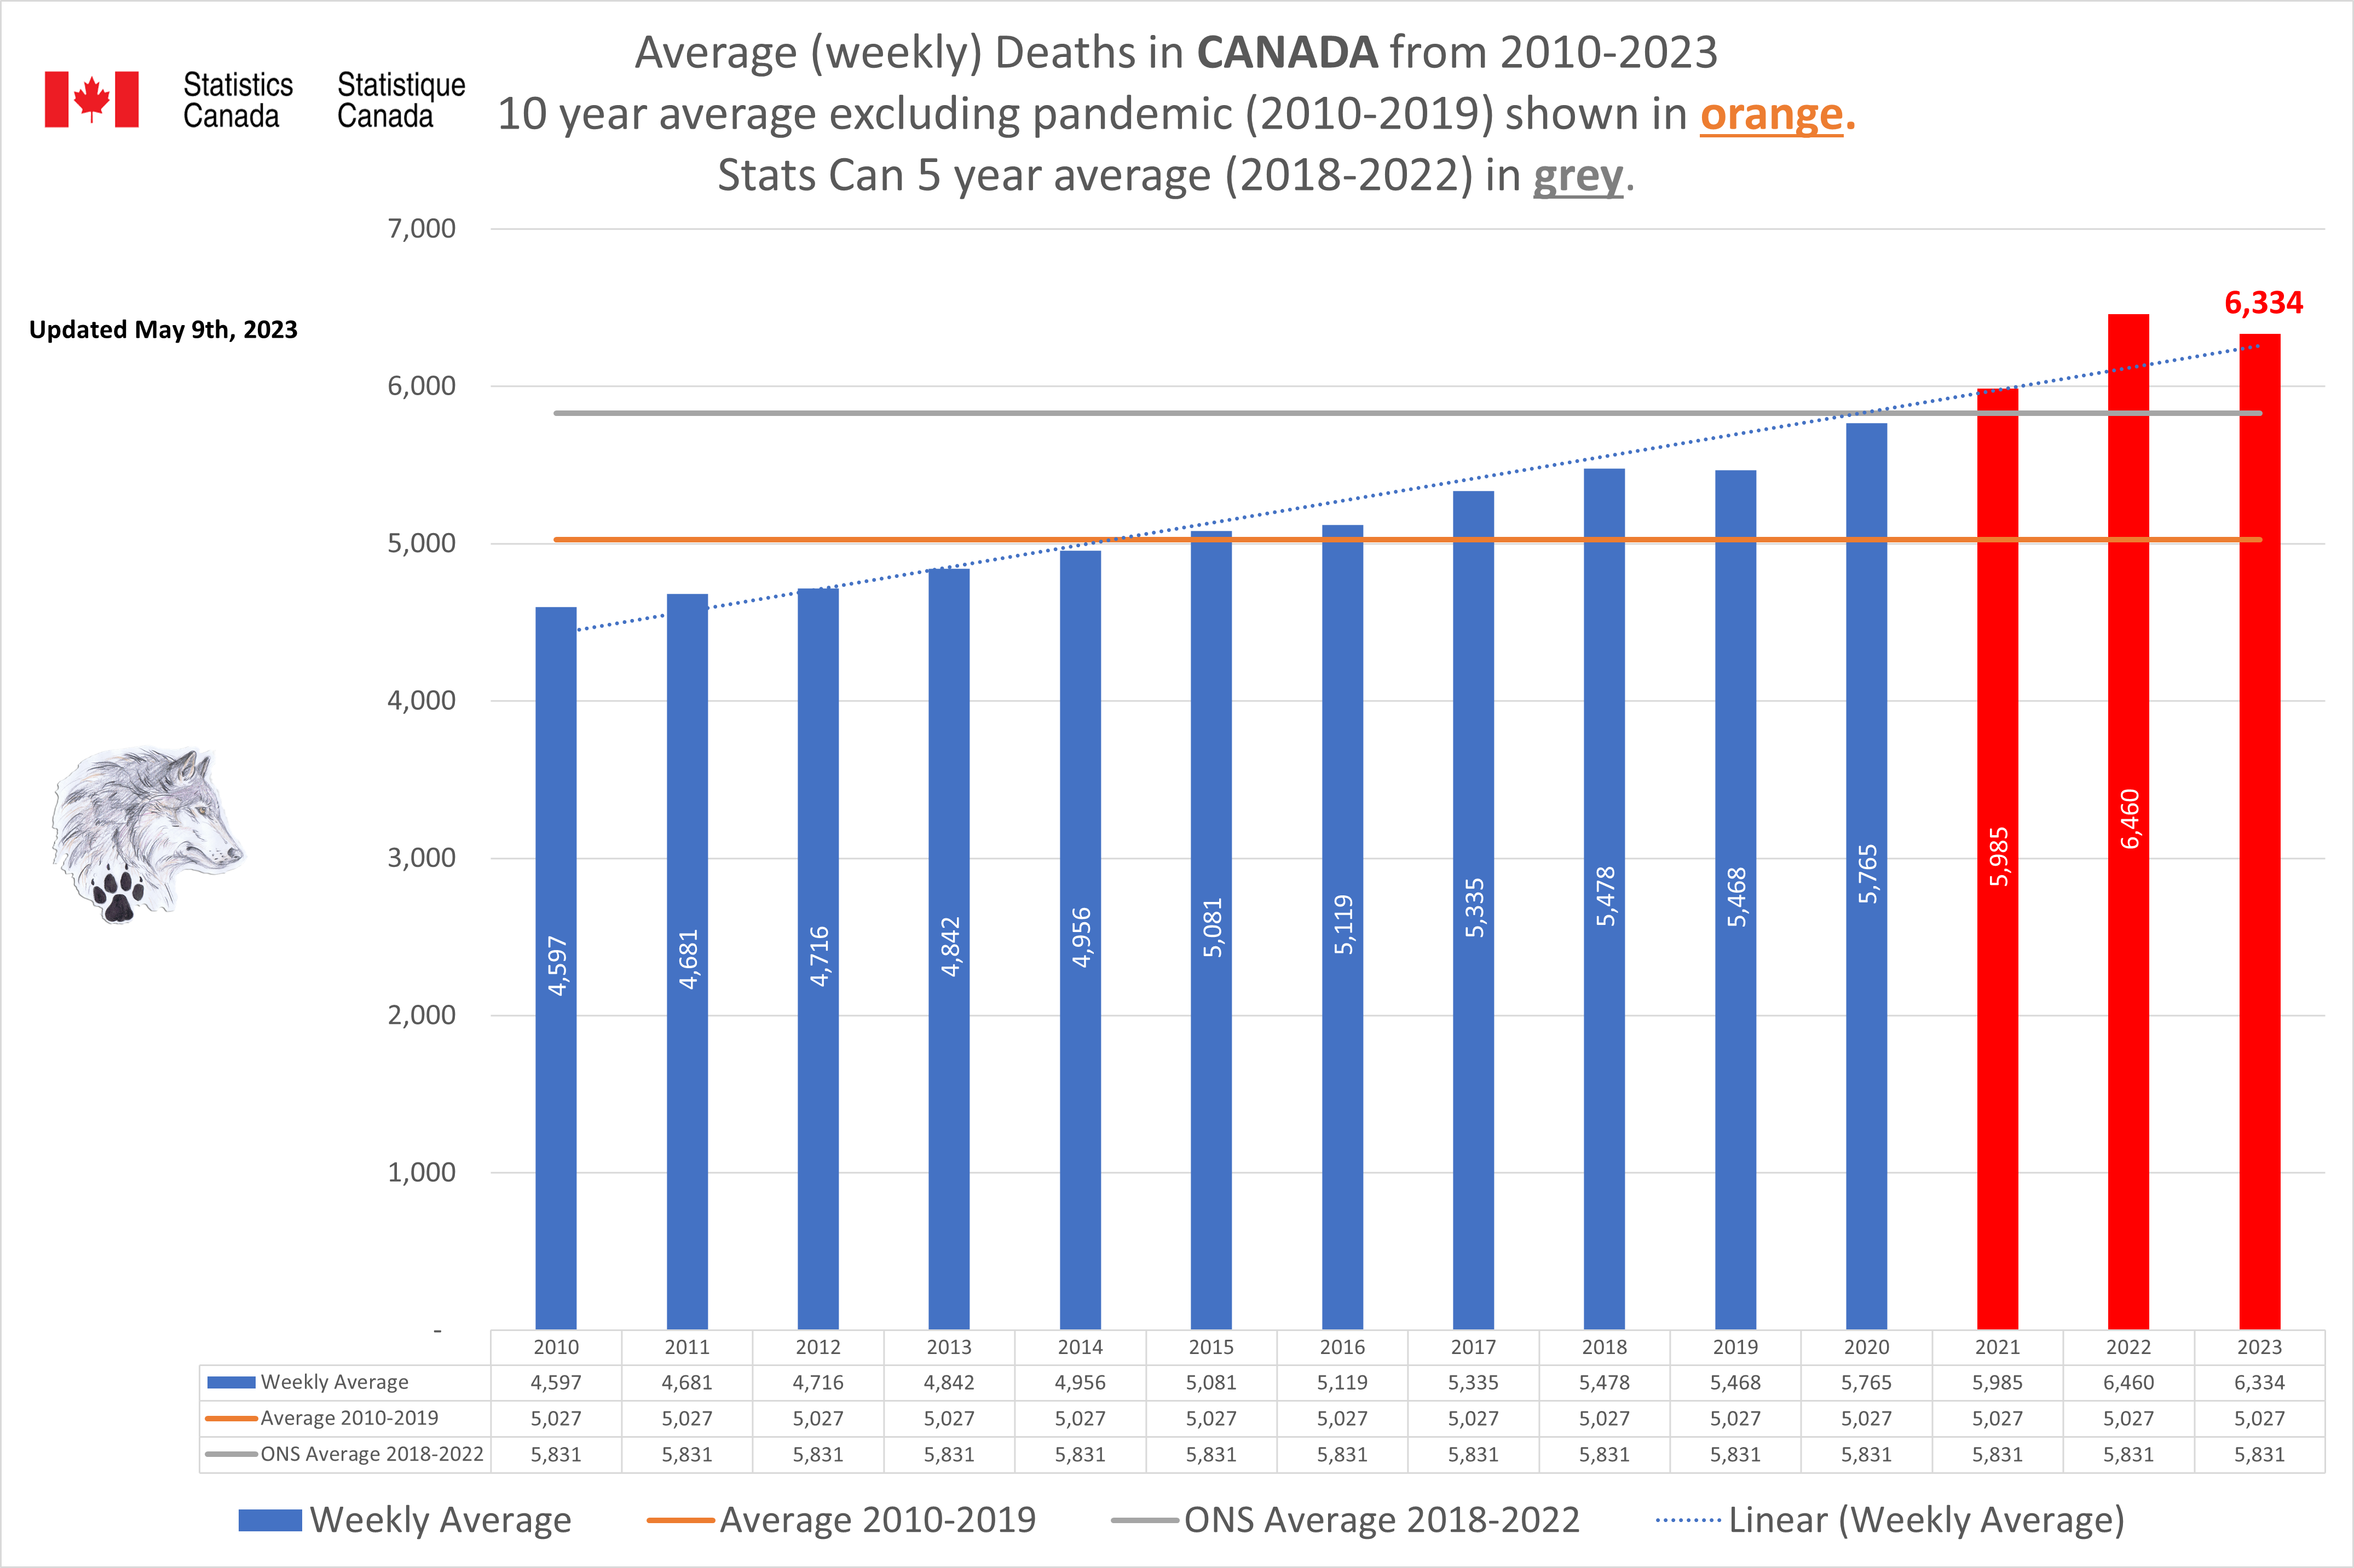
Canada's Reported (average weekly and annual total) Deaths for 2020 were below the 5 year average (2018-2020). Since then total annual reported annual and weekly average reported deaths have climbed with 2023 being projected to be the worst on record. Note that 2022 and 2023 are expected to be worse than currently reported due to a significant lag in reporting from most provinces in 2023 and some larger provinces in 2022/2021.
Reported deaths in 2020 were up over a slight decline in 2019 which can be attributed to the lockdowns specifically. However, that should have resulted in a drop in reported deaths in 2021 and beyond (as the most vulnerable had died early). So what is really killing Canadian's in such large quantities since 2021?
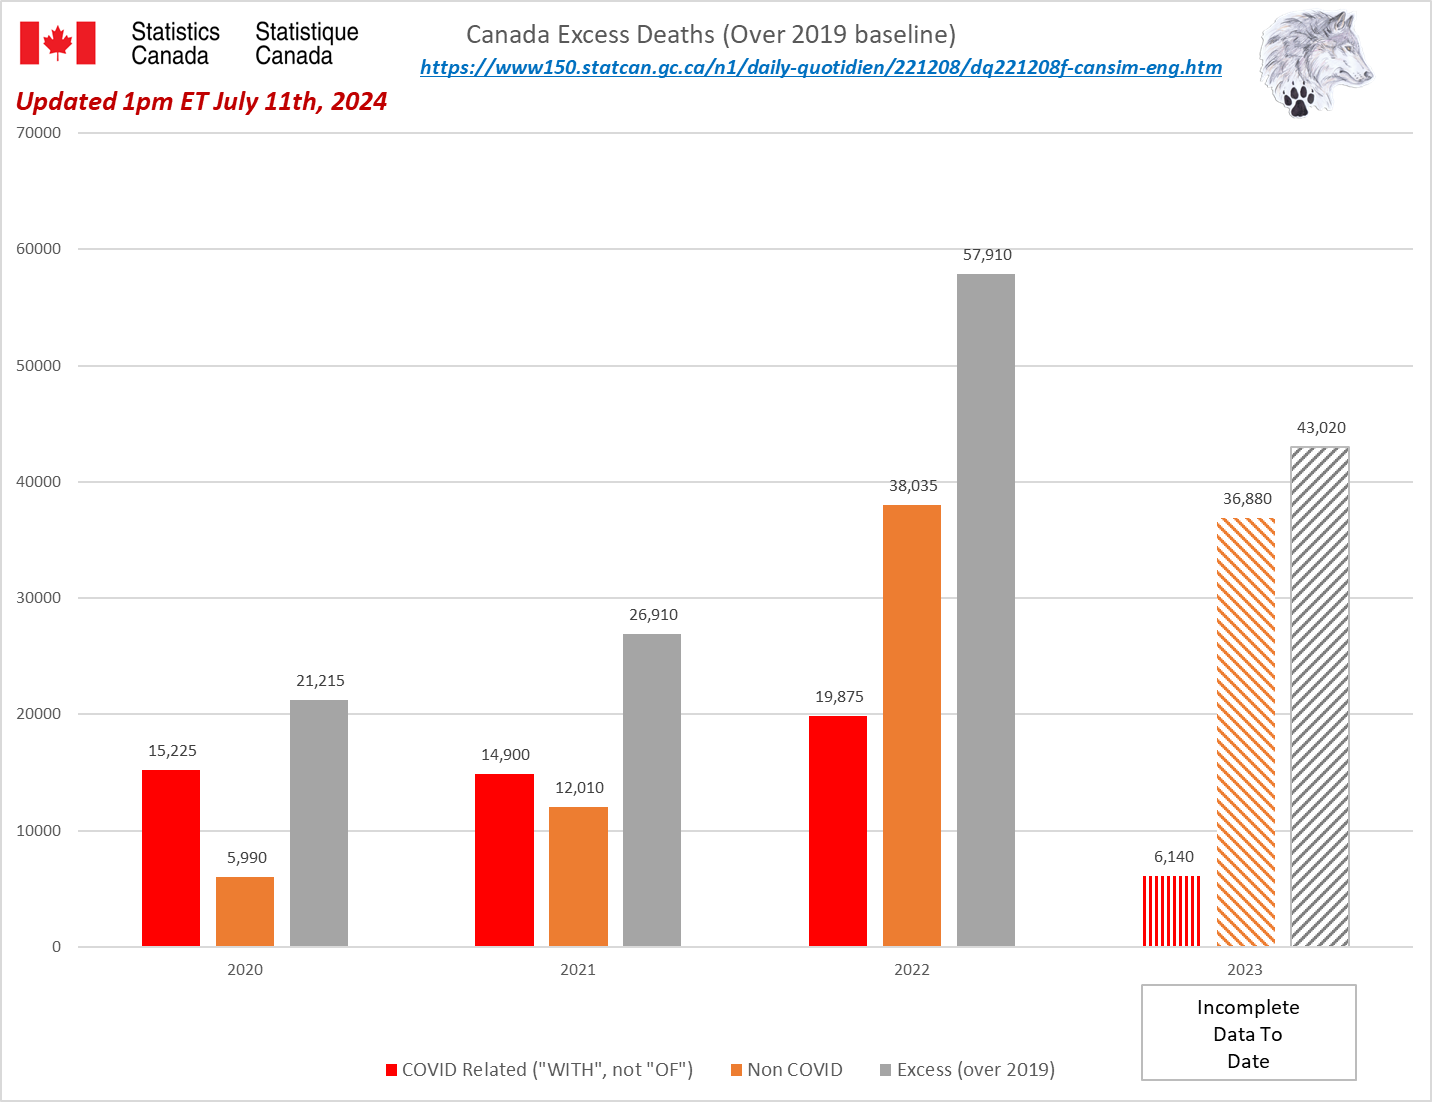
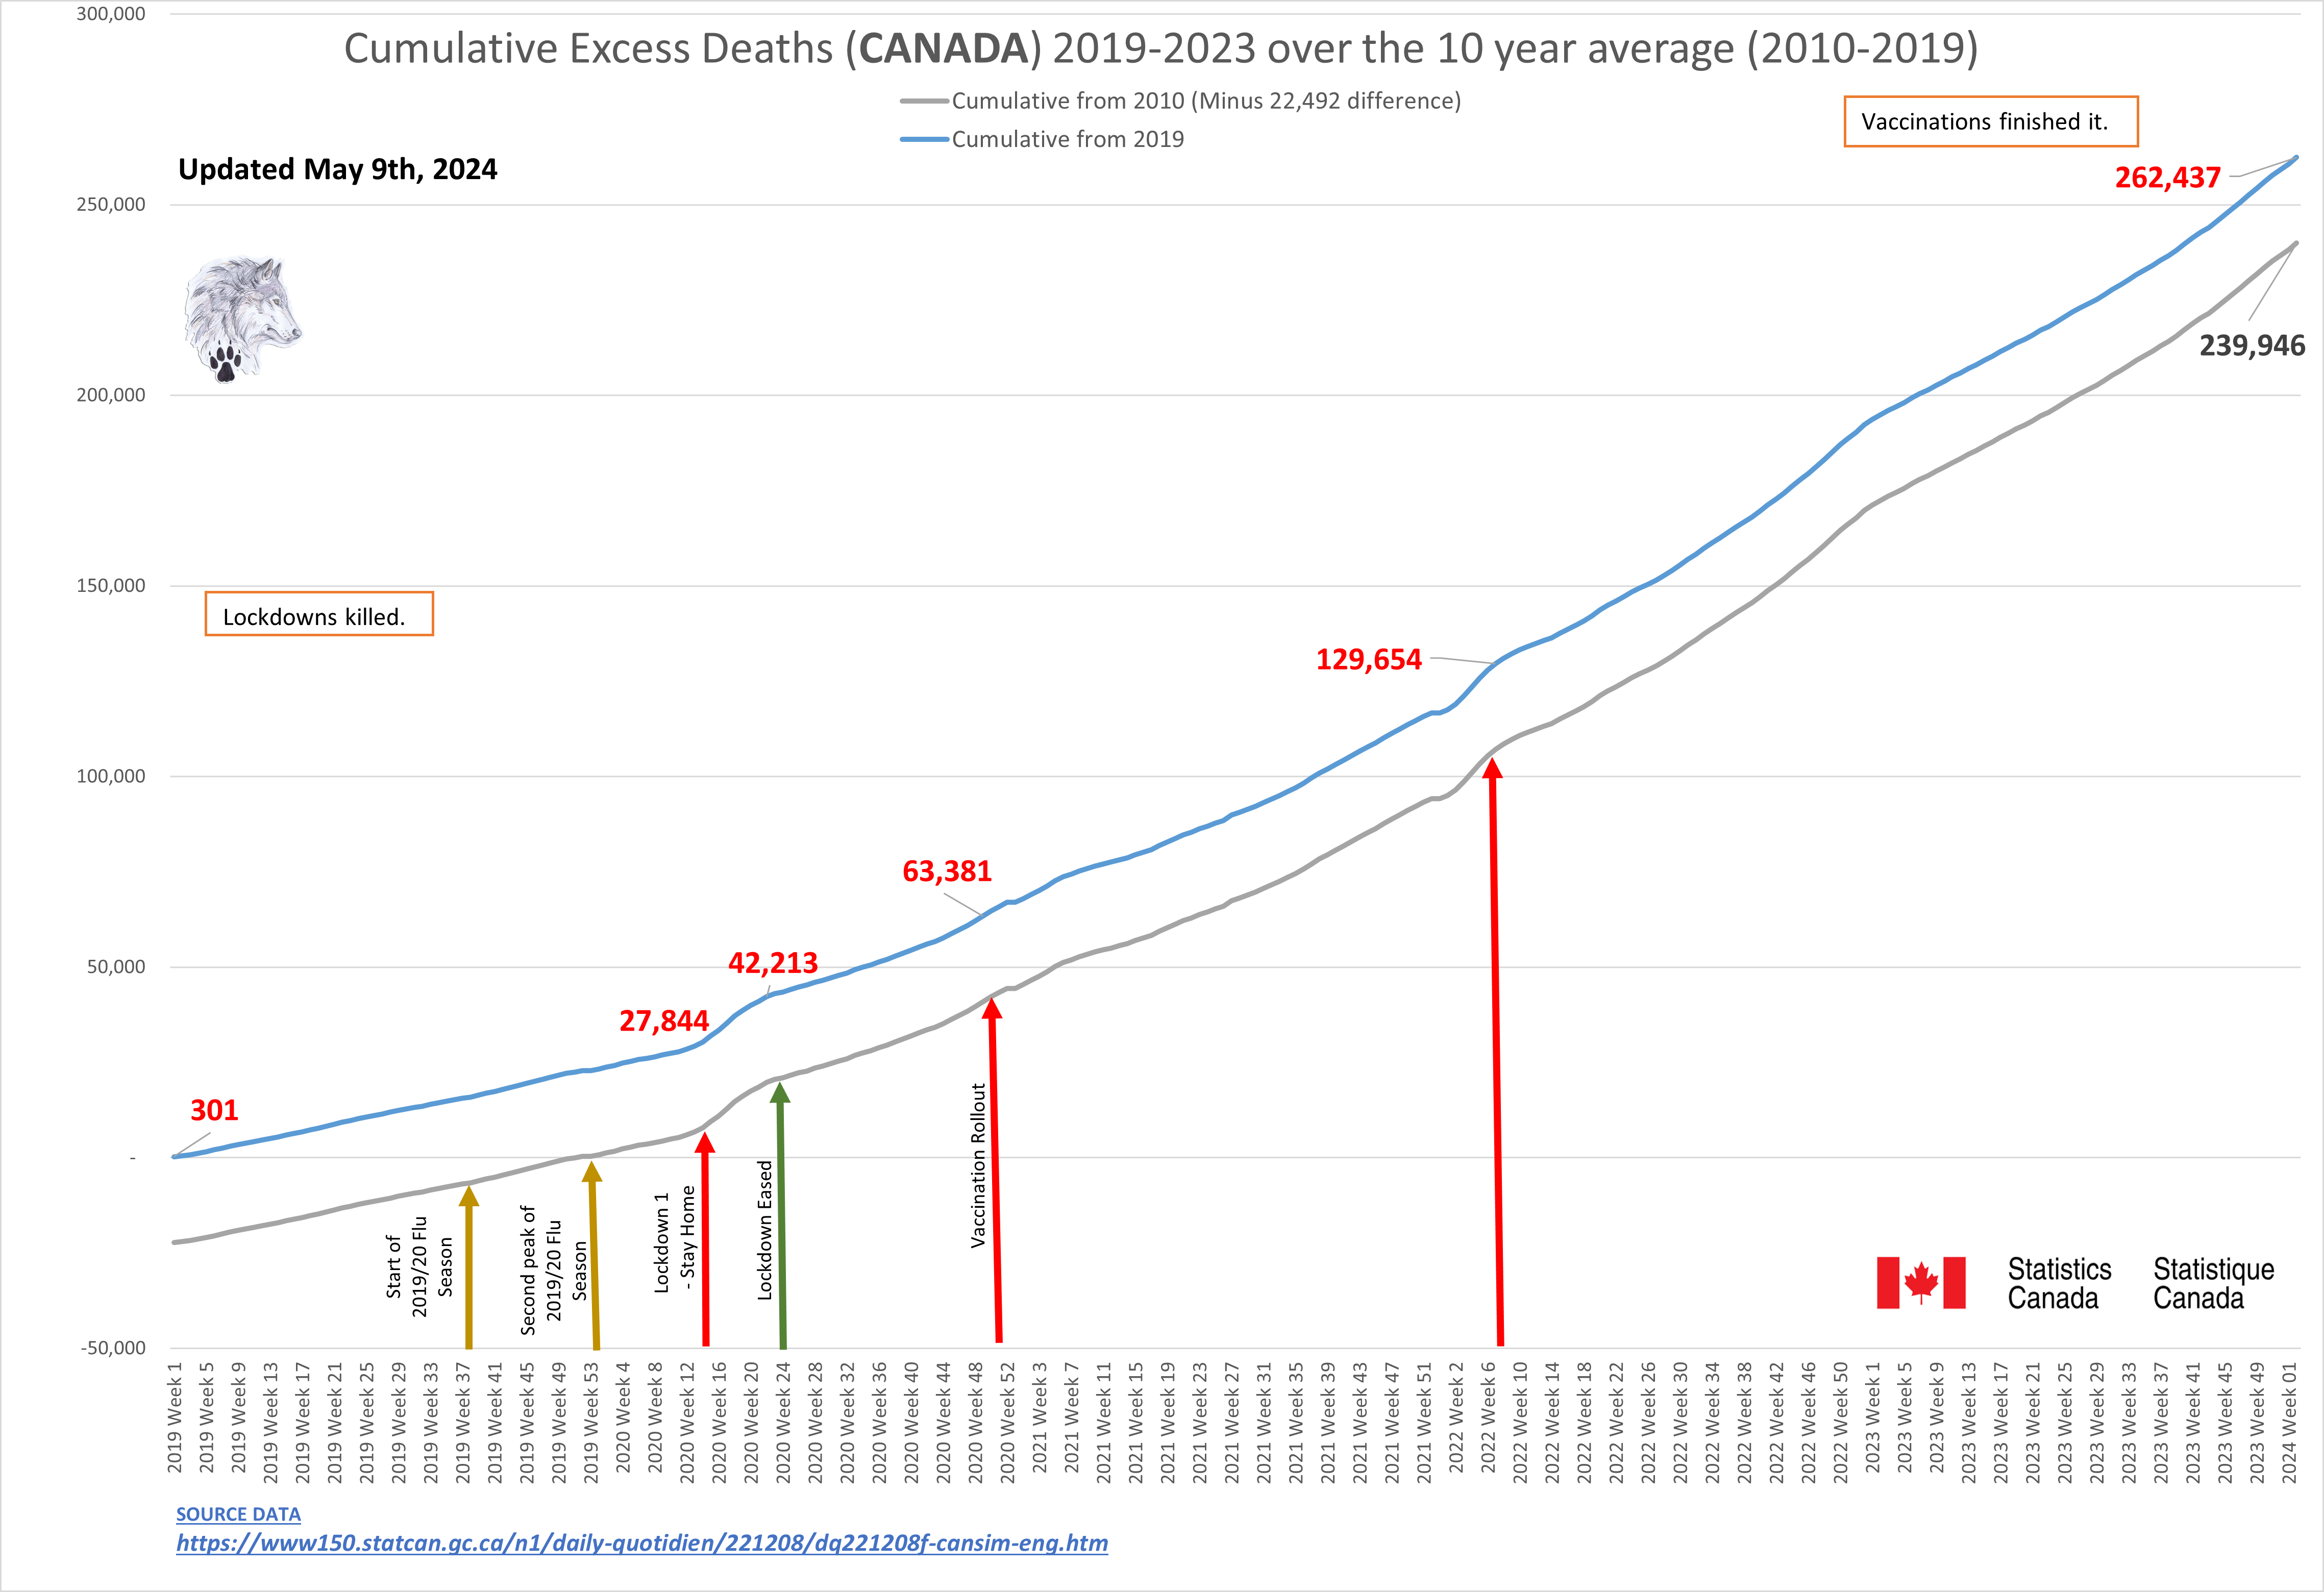
The current excess deaths for Canada (over the 10 year pre pandemic average) sits at almost 260,000 with that number projected to be over 340,000 EXCESS DEATHS by the end of 2024.
The below chart is a visualization of the above table. This shows the relationship between the current reported Excess Deaths for 2022 in Canada and England and Wales (solid red) along with the current projected Excess Deaths for 2023 (striped red). The columns on the chart represent the per capita Excess Deaths to highlight the comparative risk for every person from both countries and each province. As can be seen the situation in the UK is concerning, but the situation in Canada is nothing less than alarming.
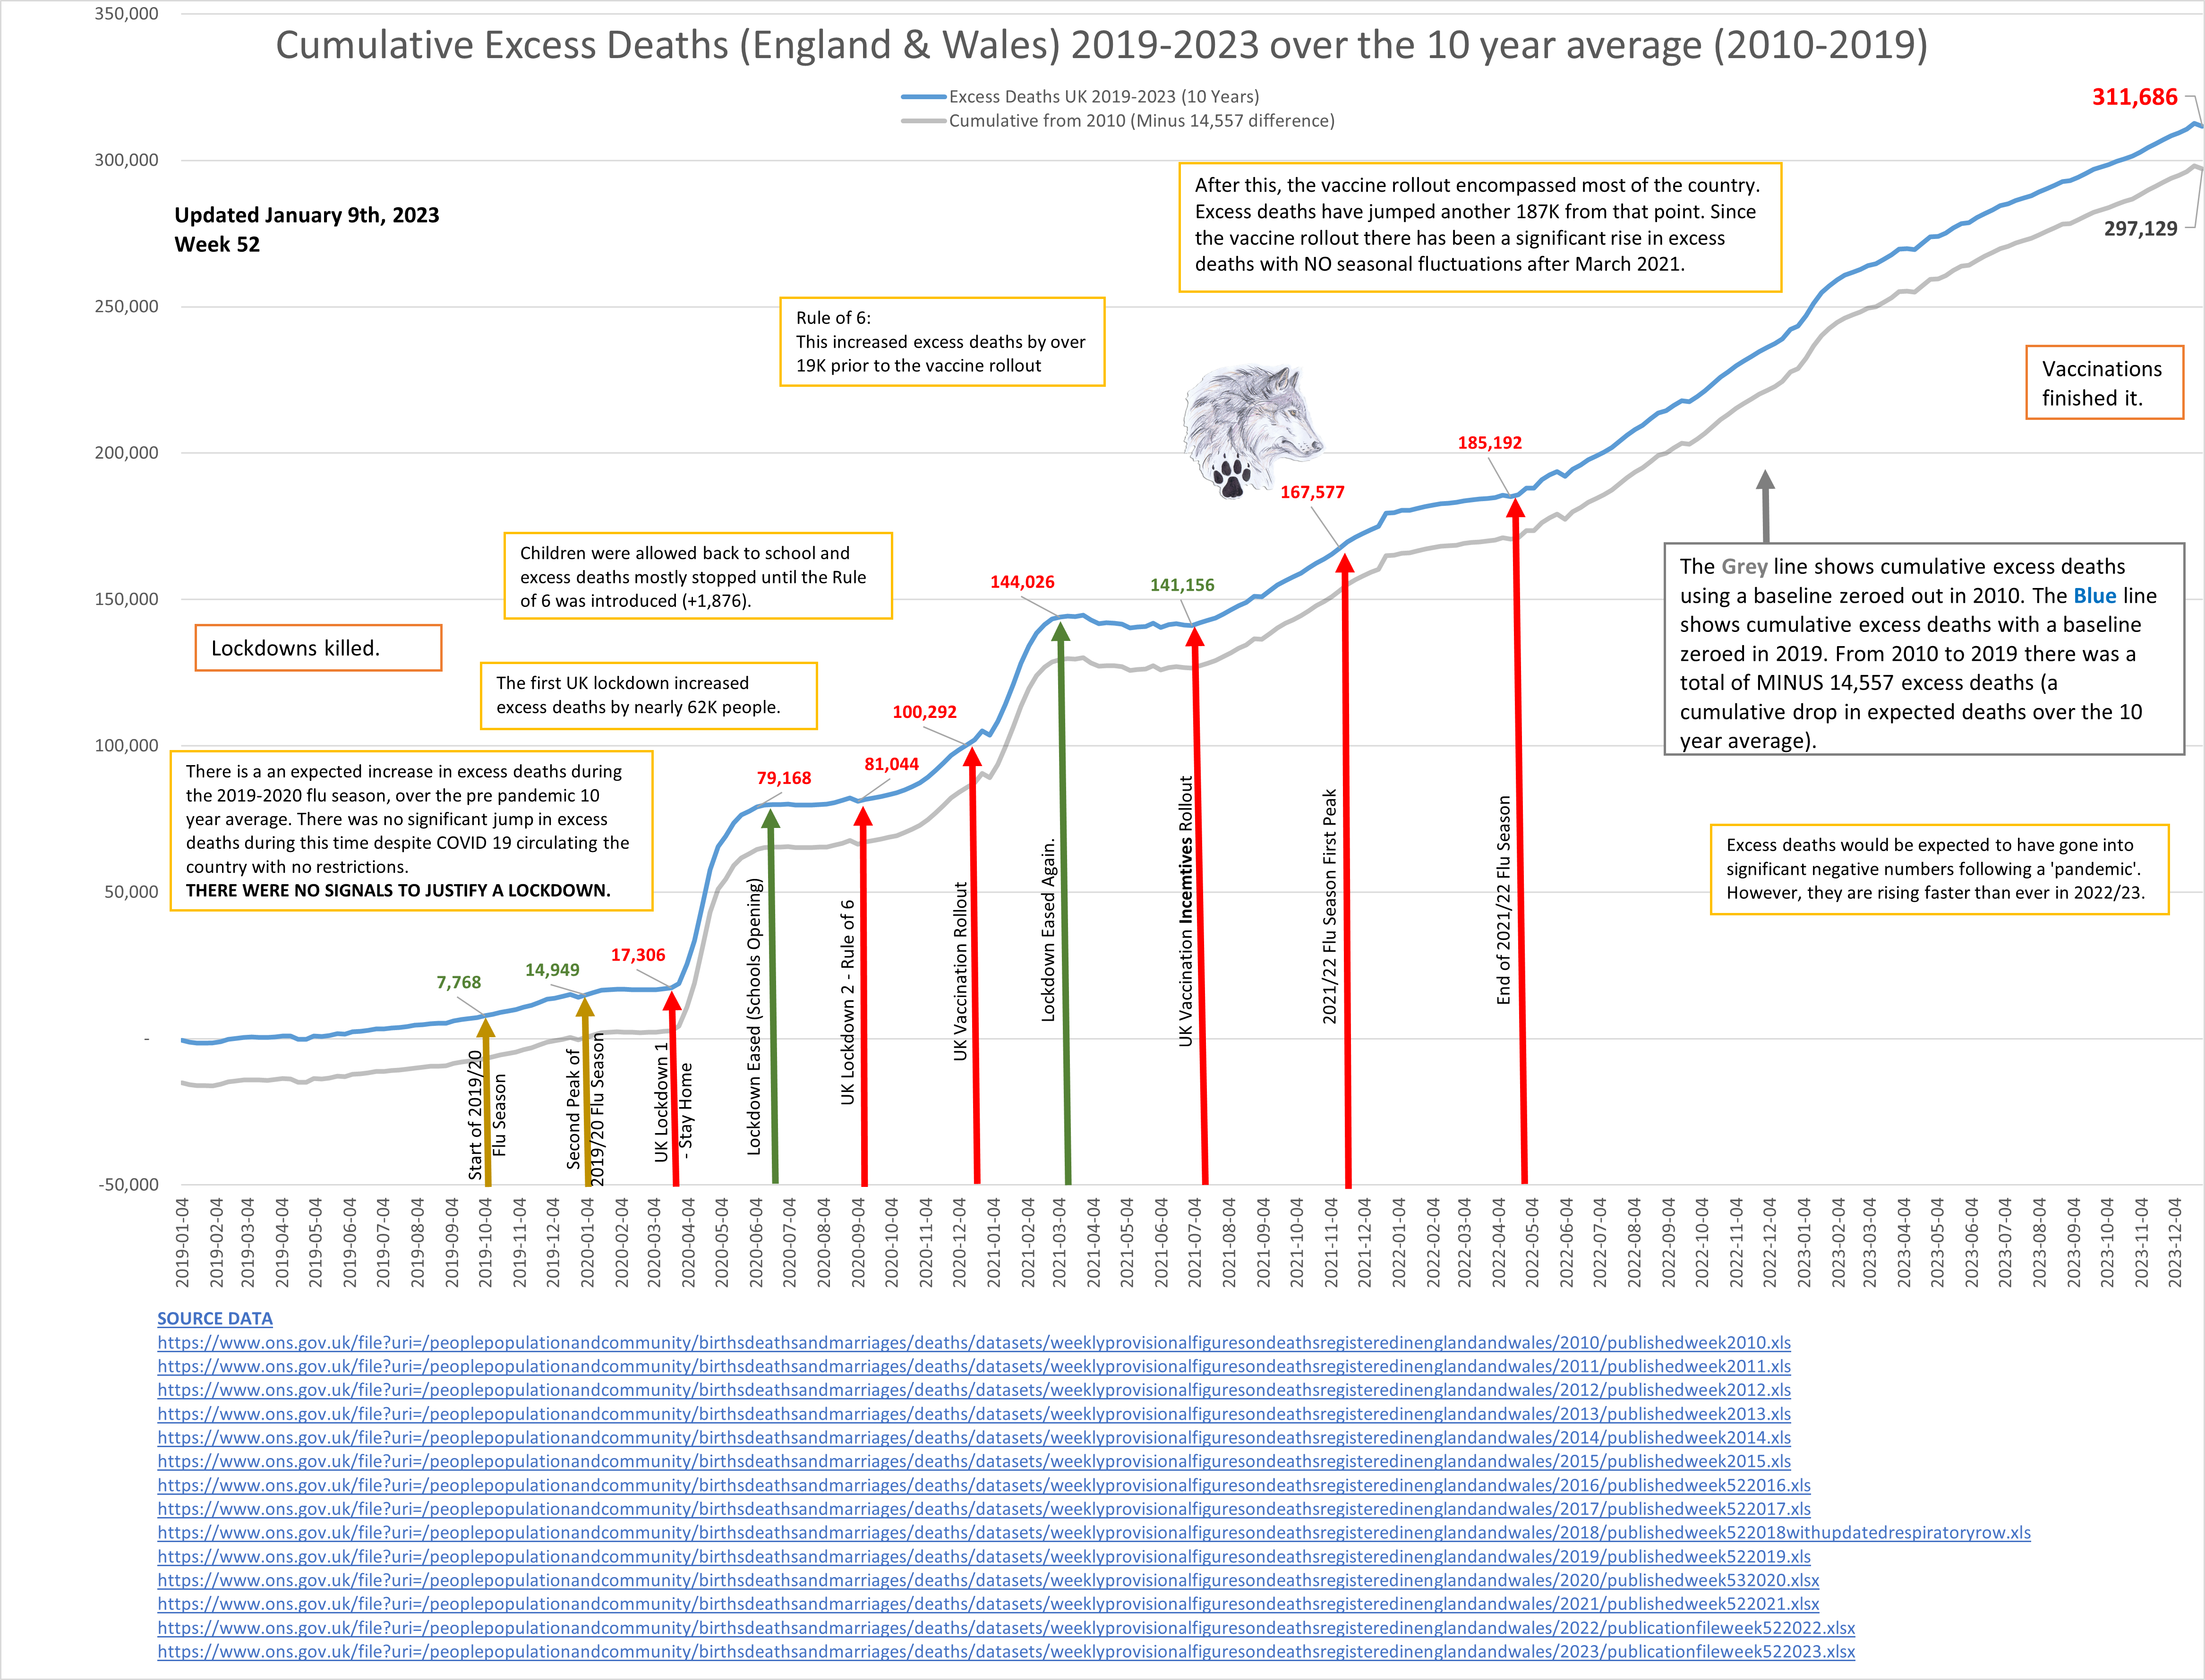
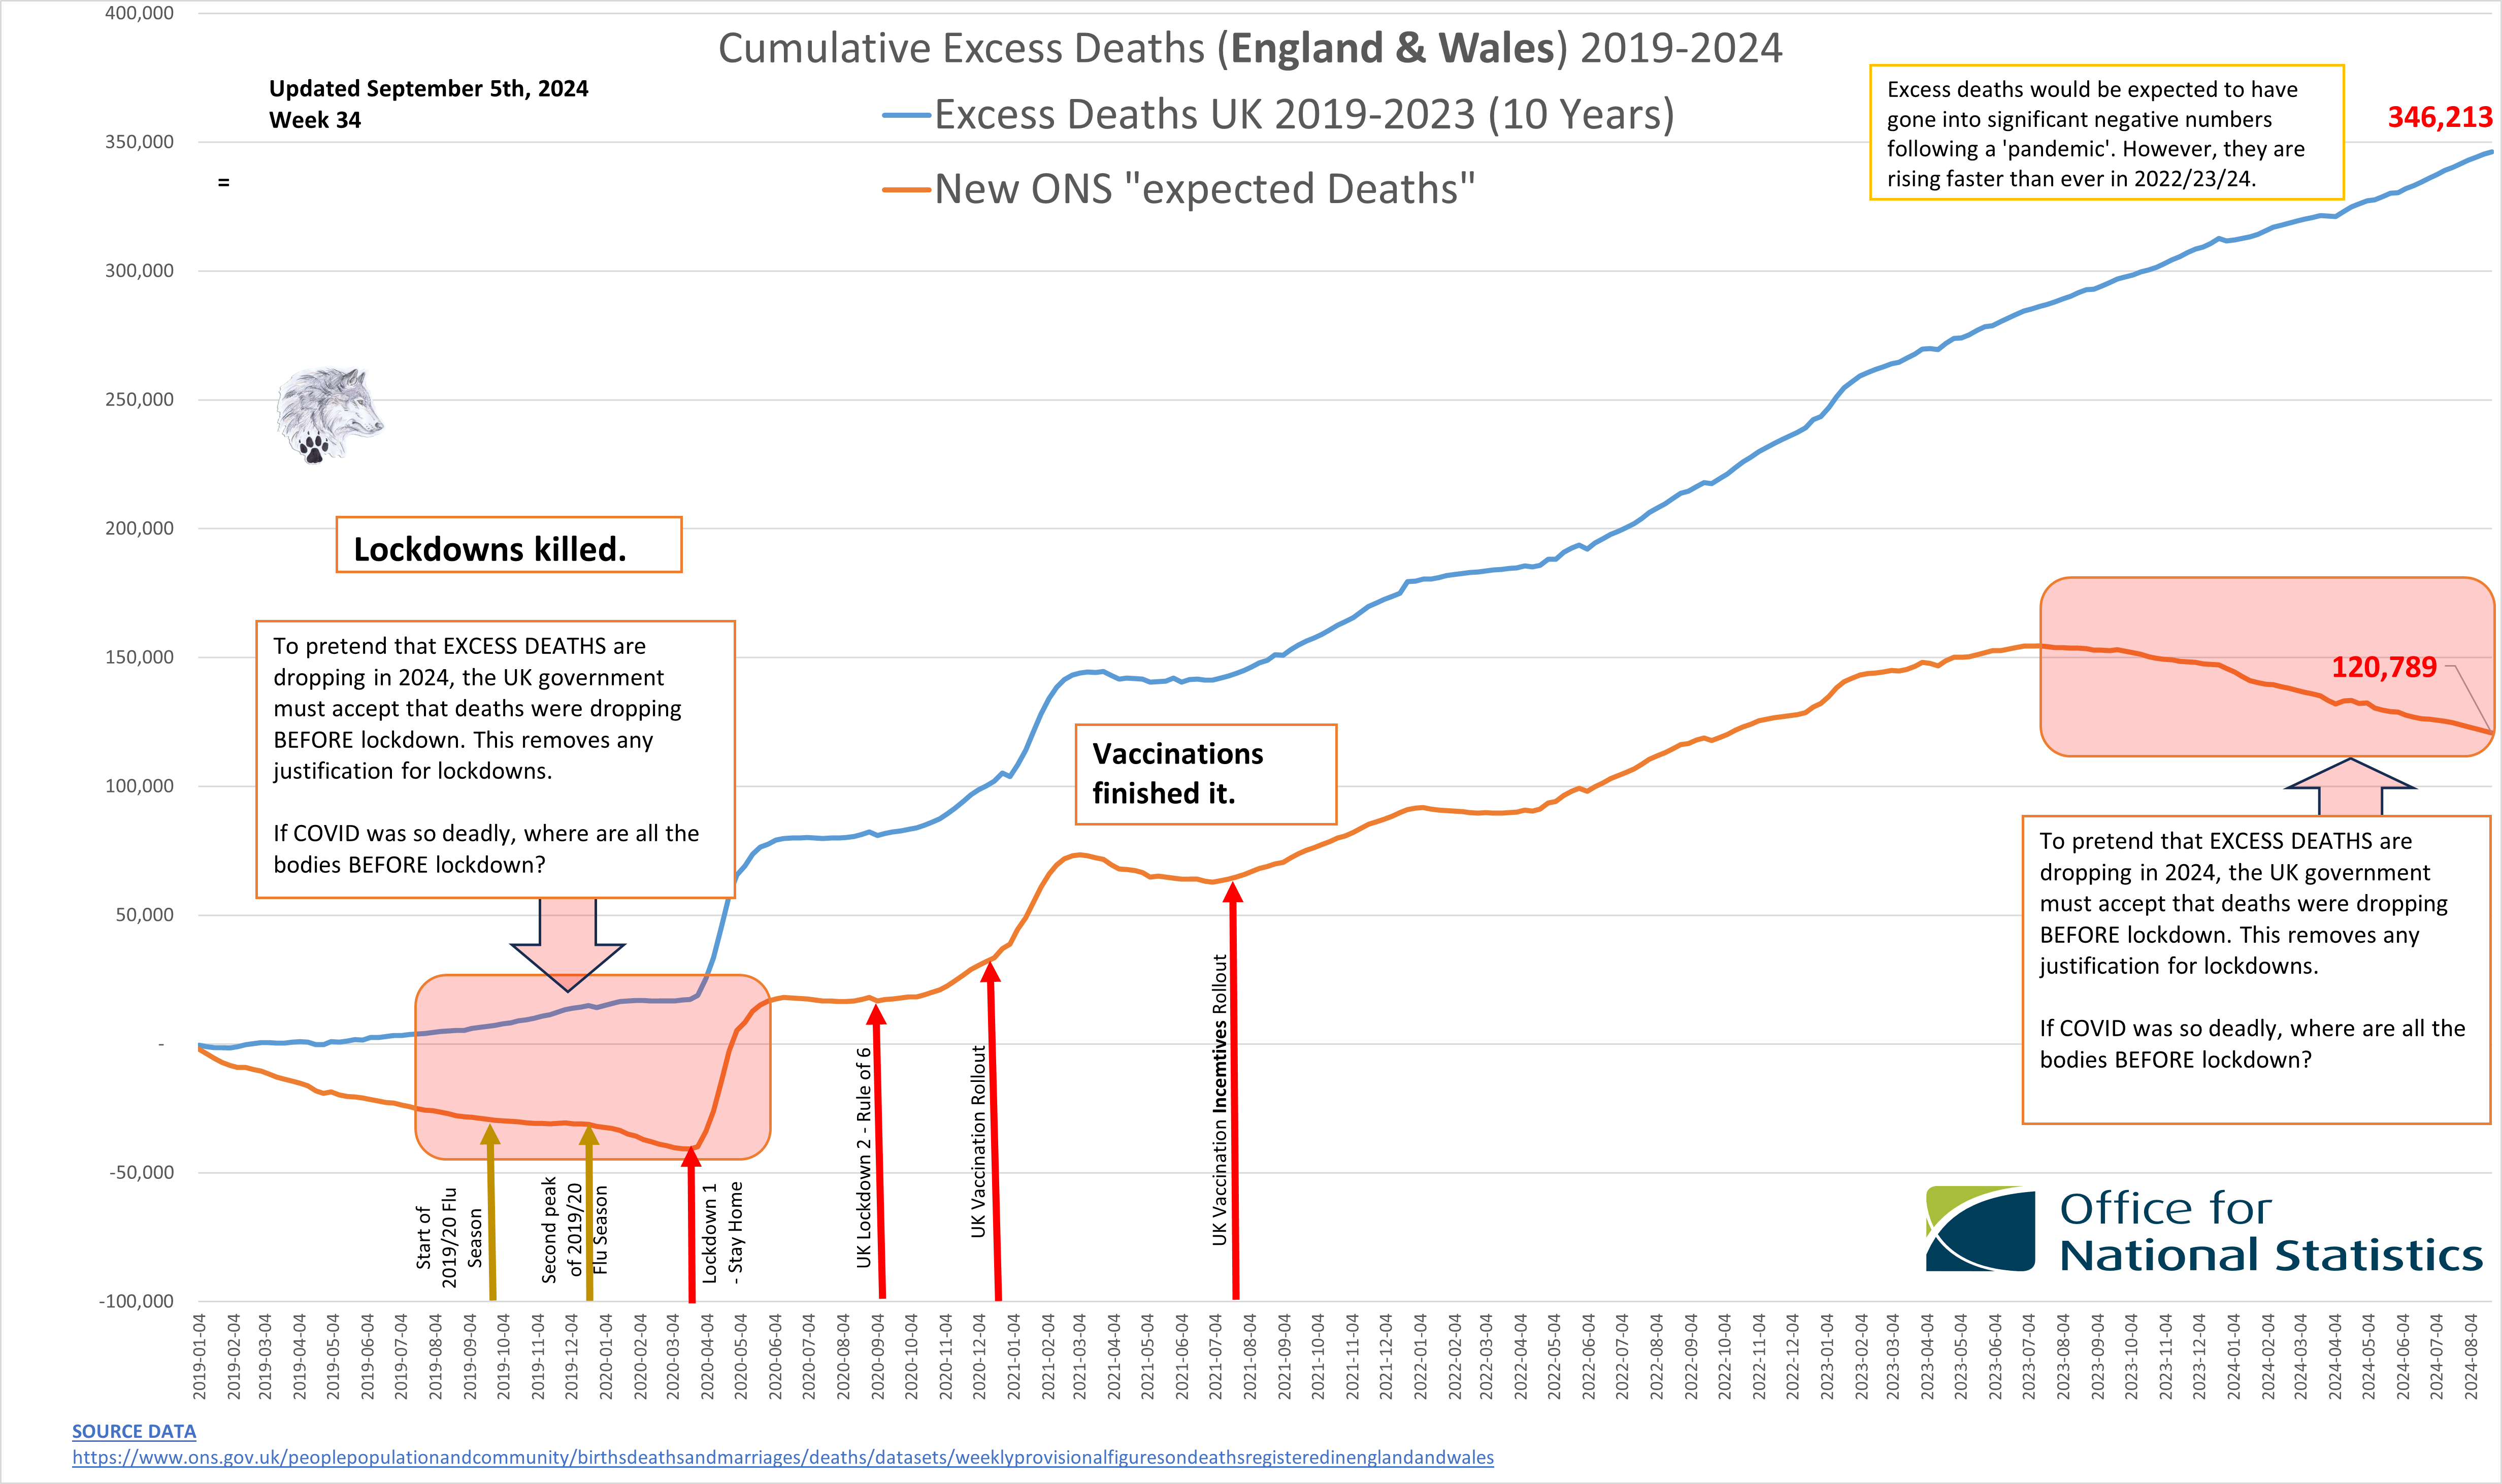
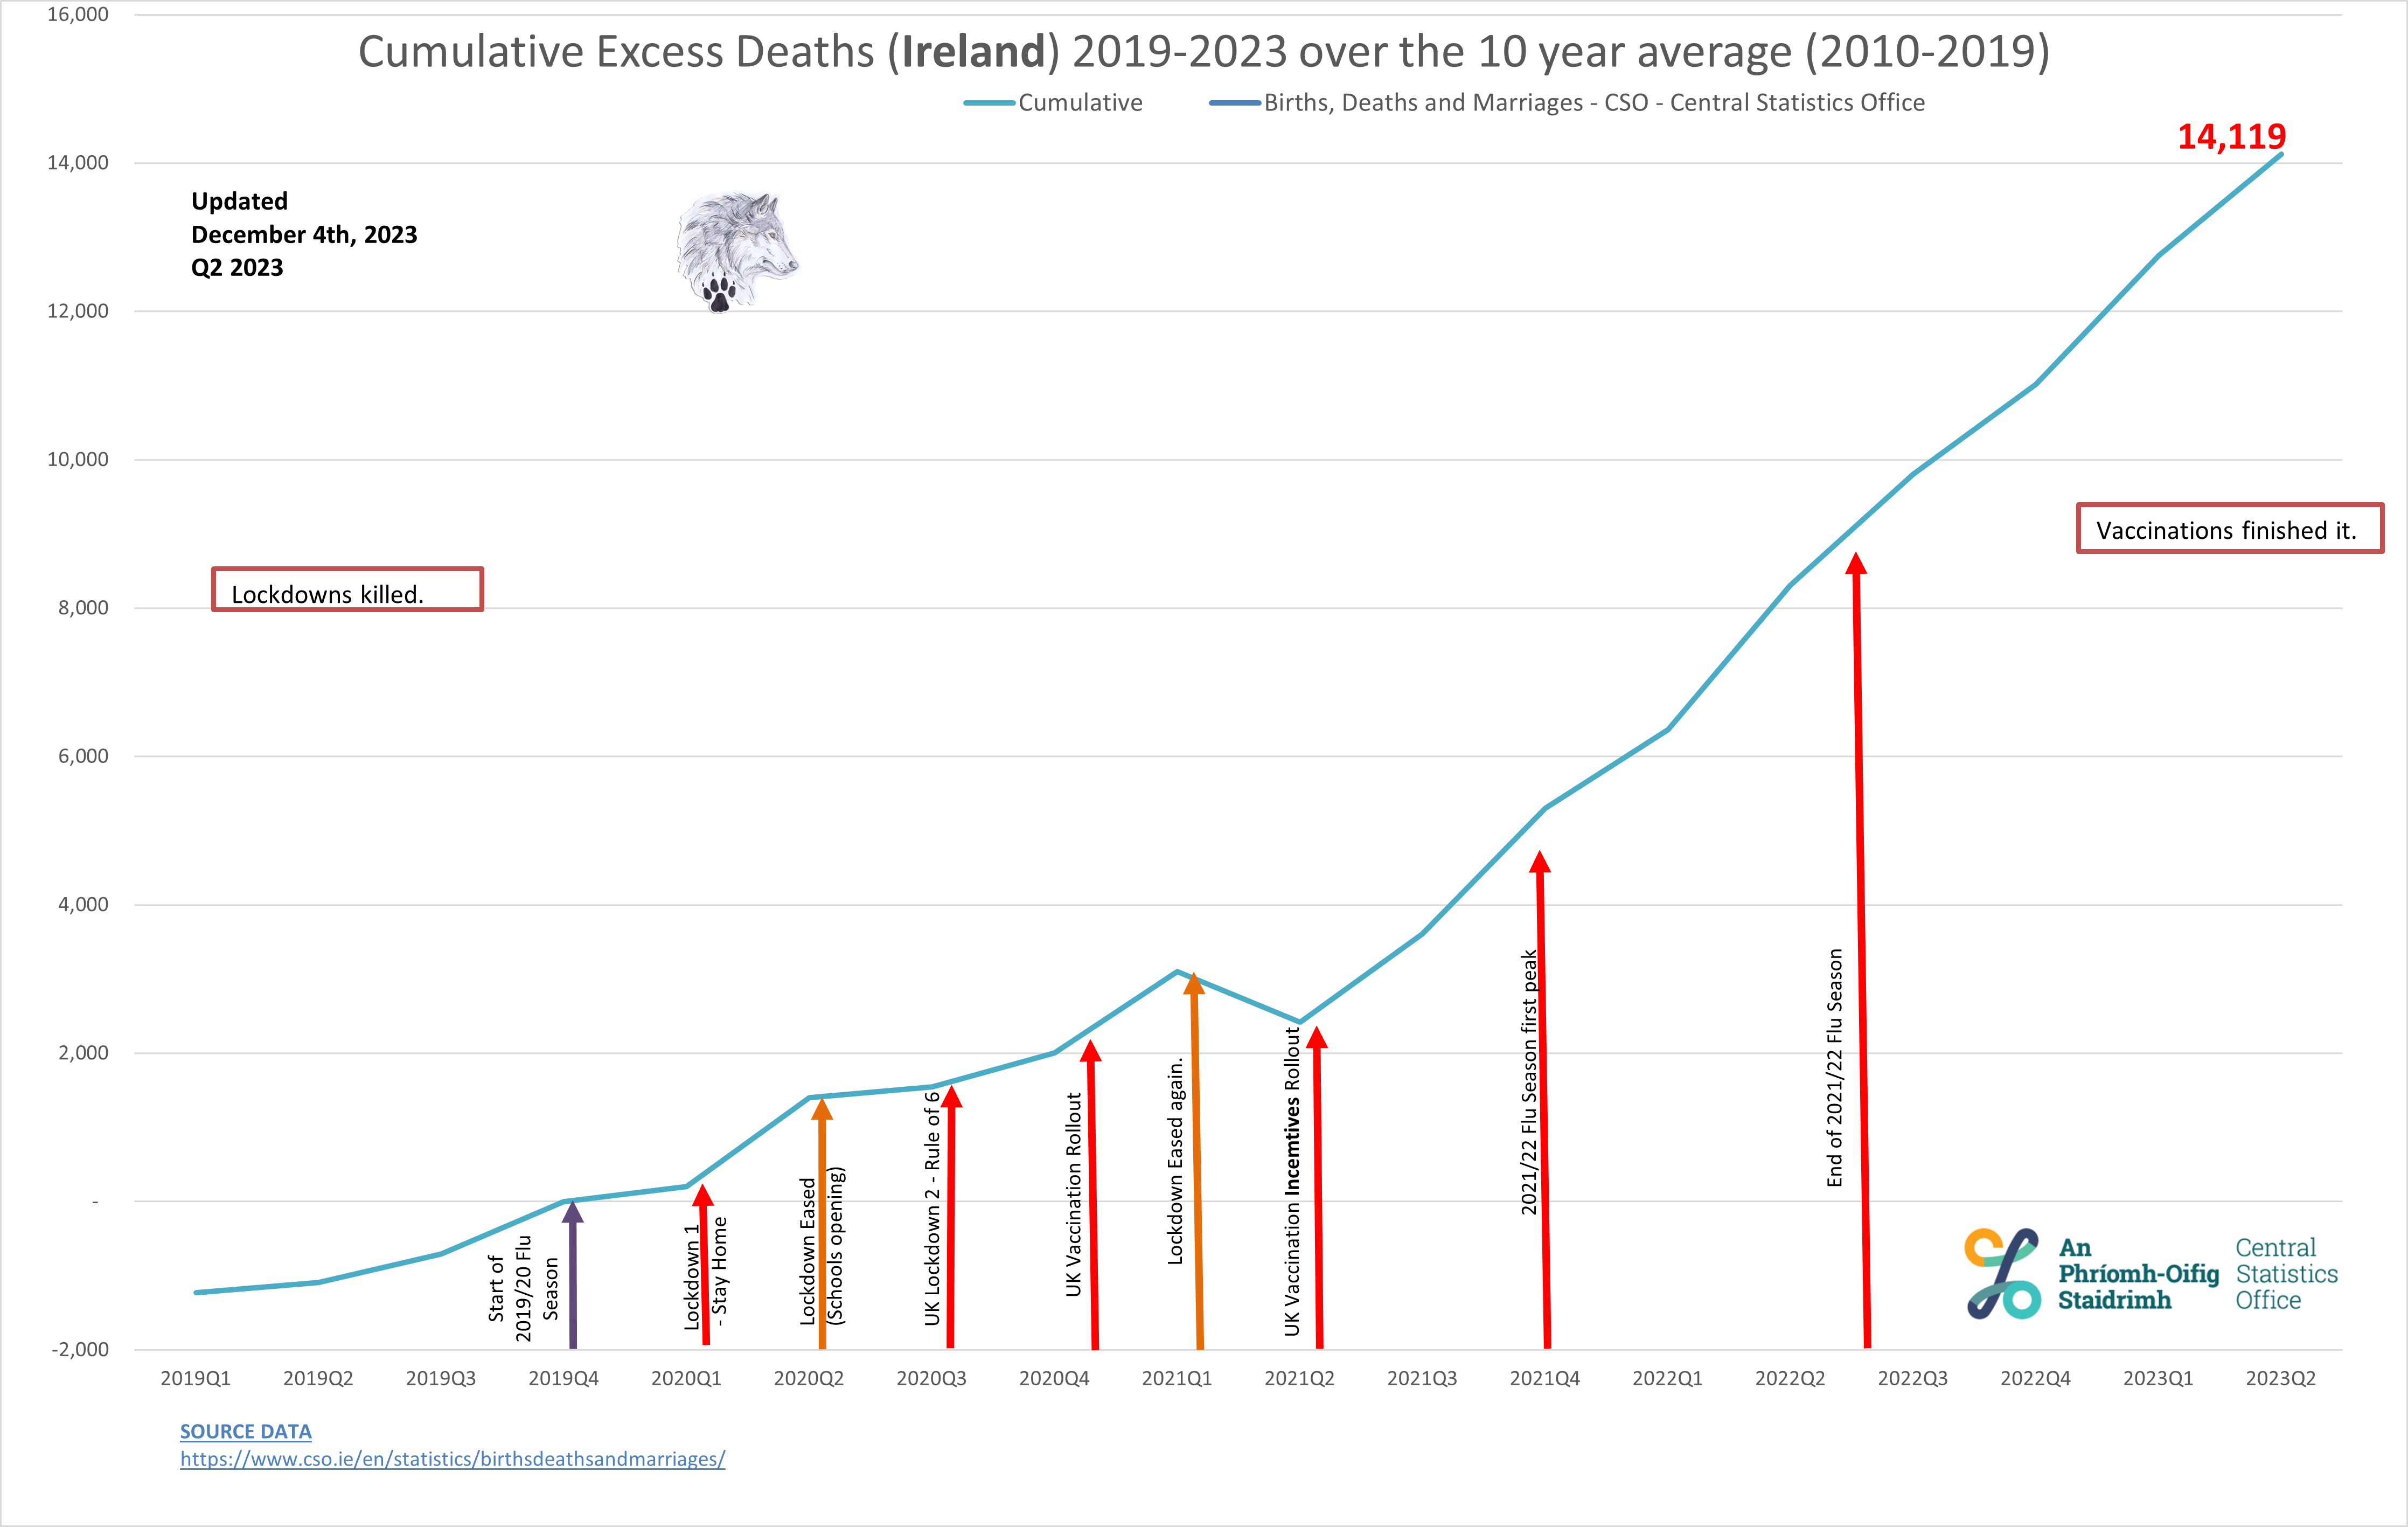
UK Cumulative Excess Deaths 2019-2023
Lockdowns killed. Vaccinations finished it.
As originally reported by the UK government (Year on Year - with rolling 5 year average.
See links below).
The Government Lied and People Died…and they will continue to do so, until enough people STAND UP AND SAY NO MORE!
After a recent discussion with Professors Norman Fenton (
Twitter) and Martin Neil (
Twitter), I decided to use the same methodology employed on the Canadian charts (deaths reported vs. the 10 year average from 2010-2019).
Under this lens, the UK deaths look worse, but follow a similar damning pattern.
Using any of these methodologies, it shows that excess deaths are rising rapidly year on year and this cannot be attributed to COVID.
Lockdowns and Vaccines are the clear causal indicator in the government's own data.
As can be seen here, from 2010 to 2019 the Excess Deaths in England and Wales were MINUS 14,455 (over the 10 year weekly average 2010-2019).
This chart shows the Excess Deaths recorded for all causes in England and Wales from 2019-2023 comparing the cumulative total from 2010 and 2019.
In 10 years the cumulative Excess Deaths in England and Wales reduced by 14,557. The response to COVID has increased that from a negative number to over 340,000 additional unexpected and avoidable deaths.
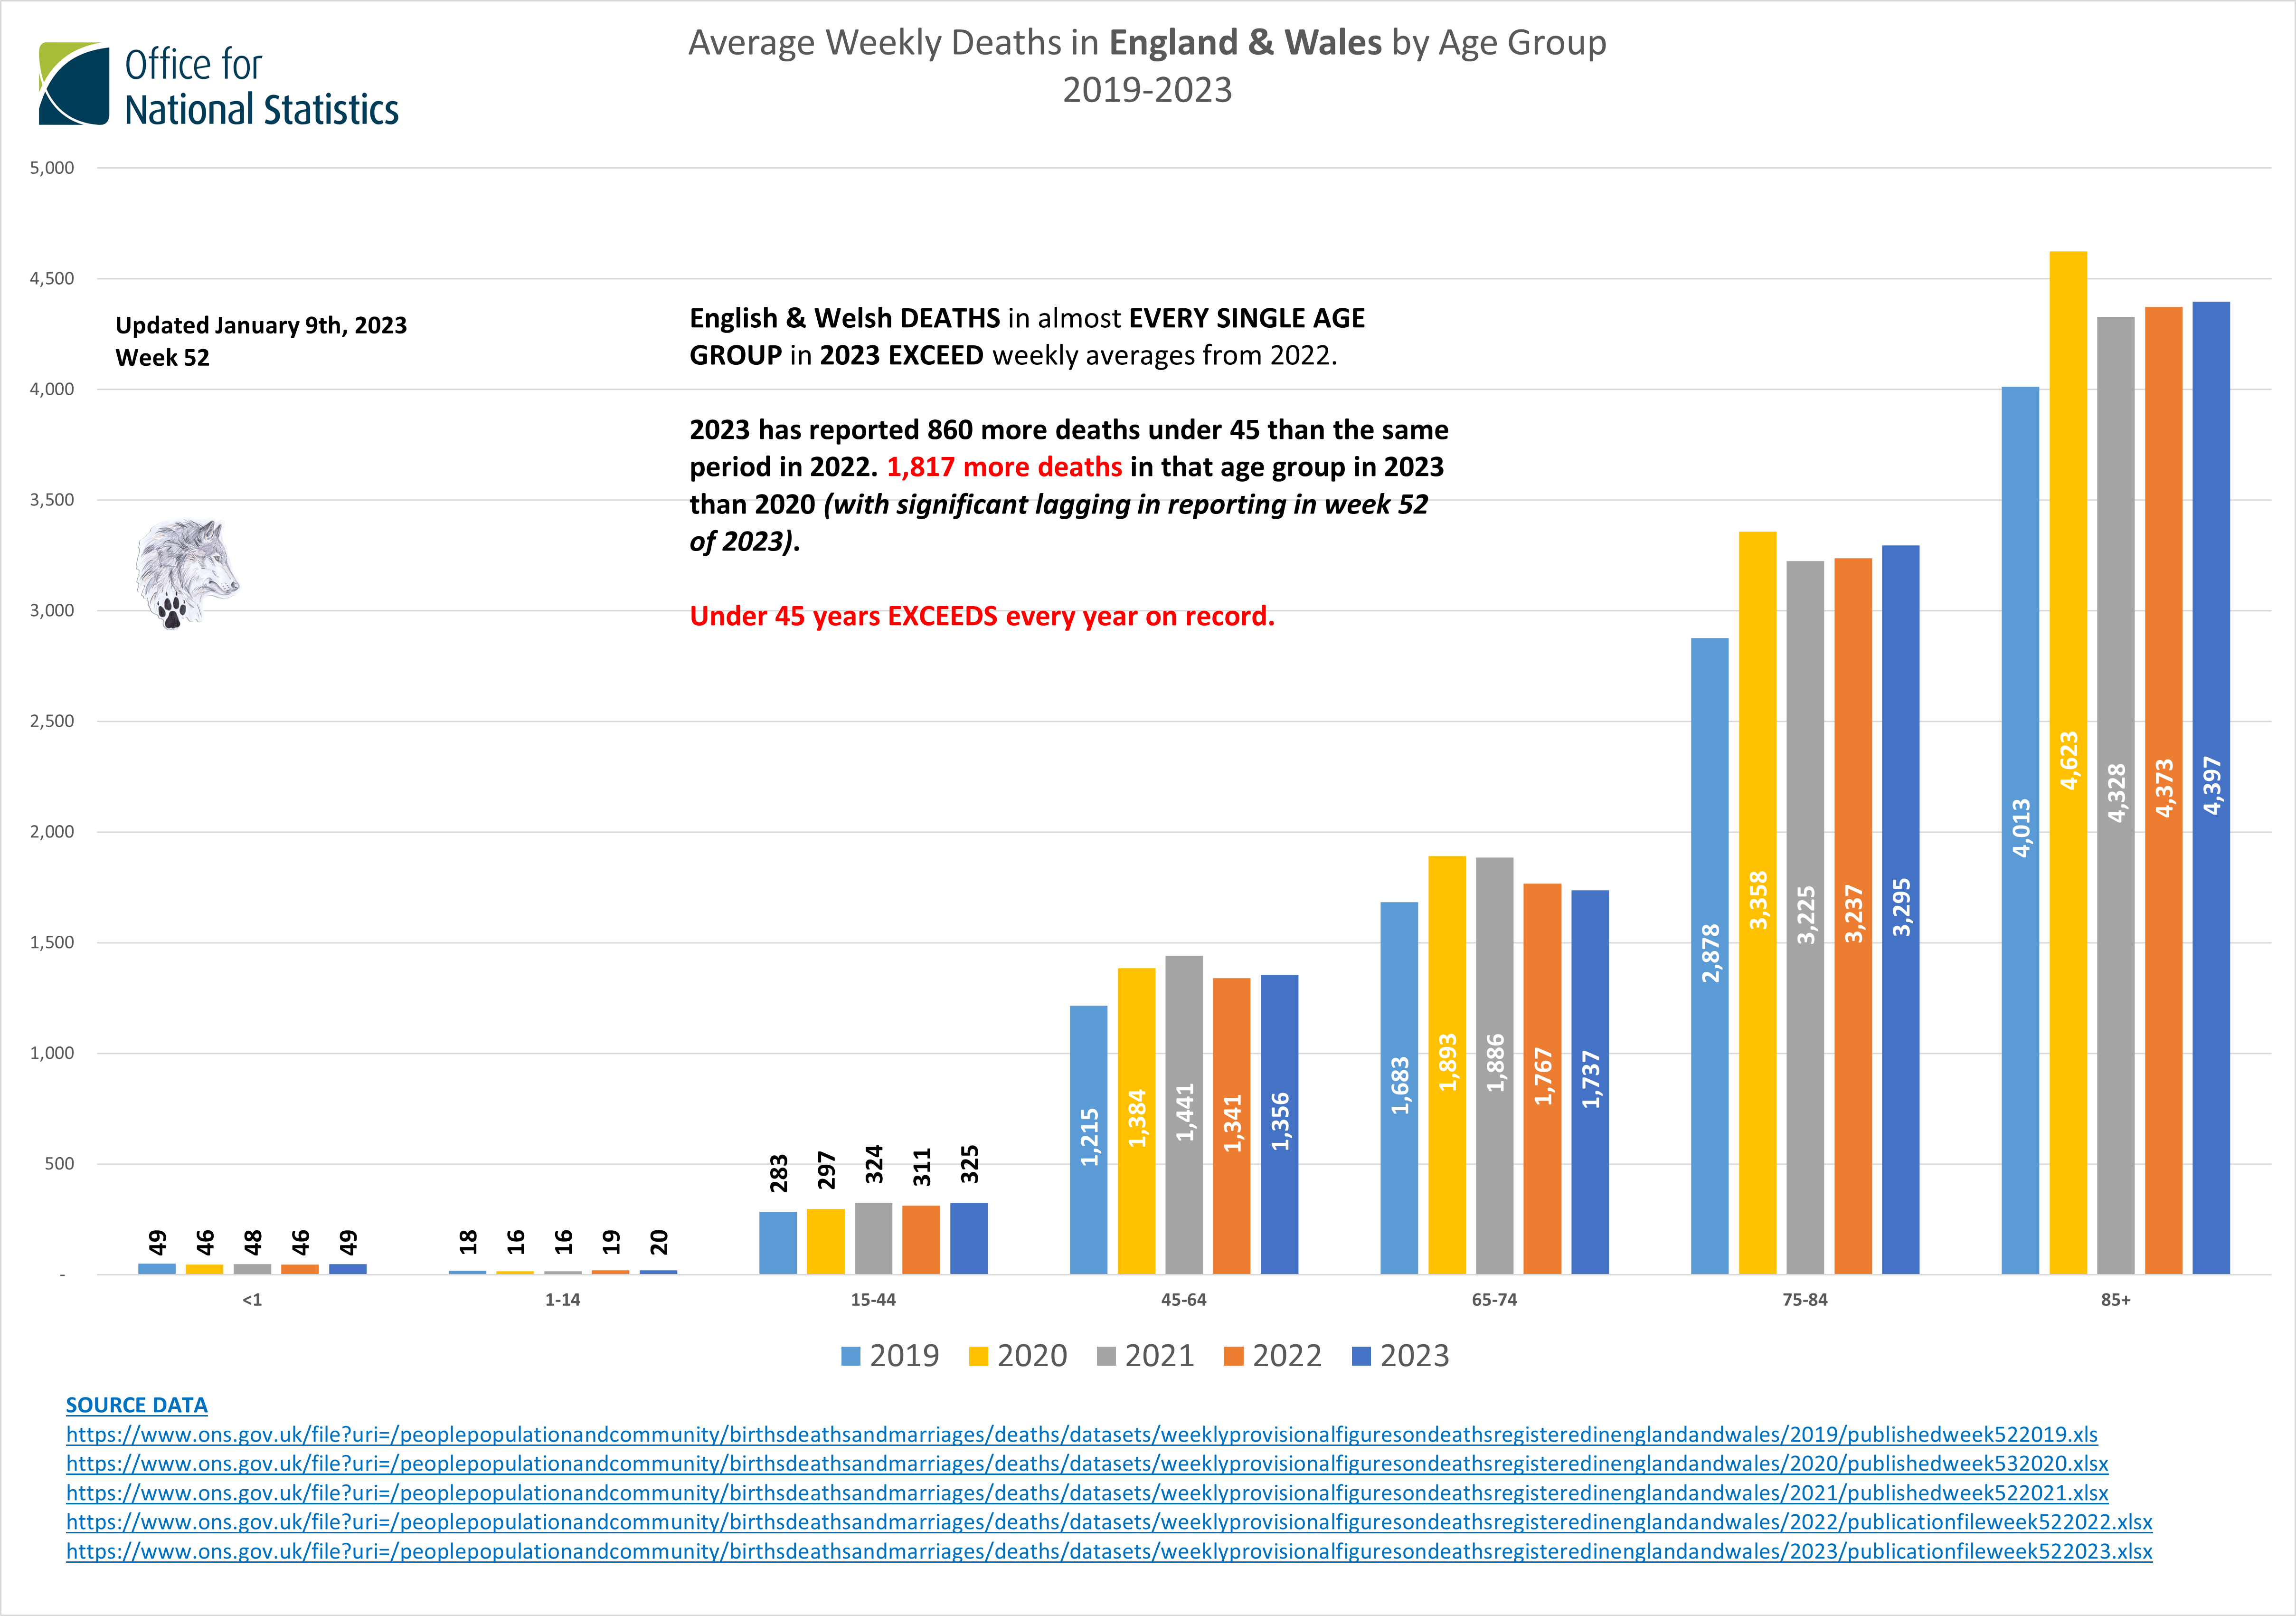
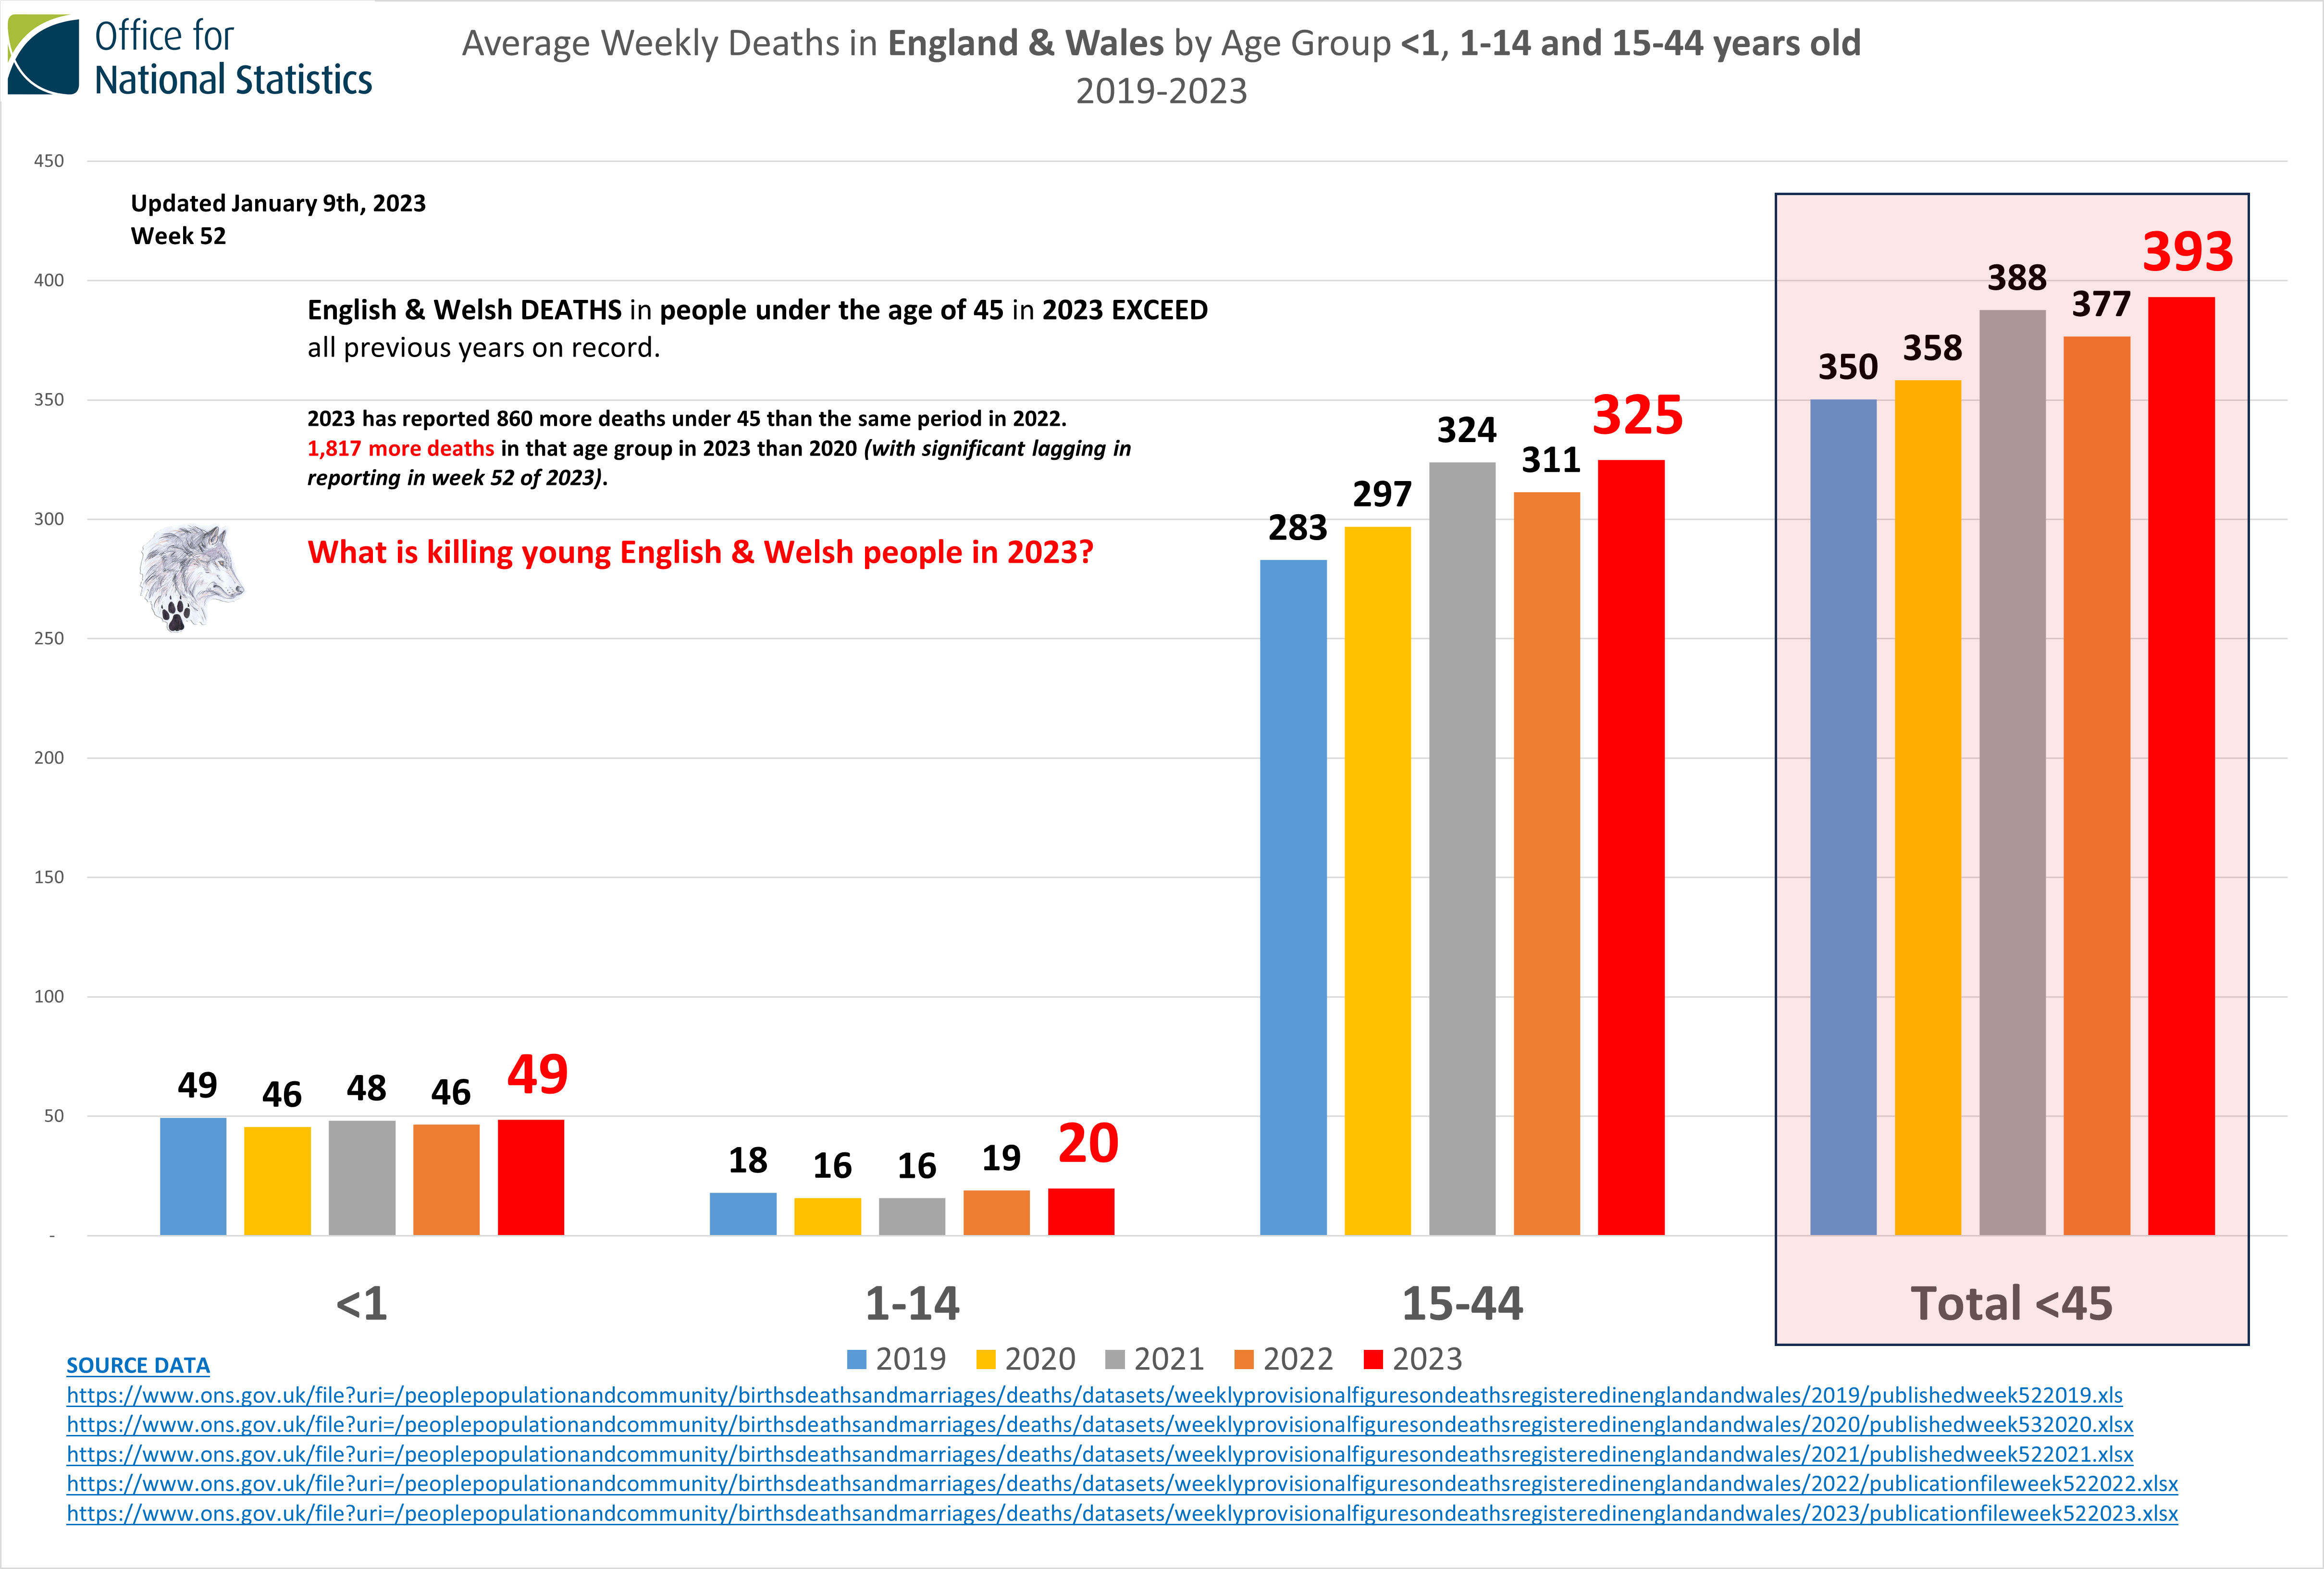
All Cause Deaths - The darker the red, the more deaths there are. Why is 2023 looking so bad AFTER a 'pandemic'?
In 2020, the elderly died in Care Homes (NG163, Isolation, Ventilators...).
In 2021, the vaccinated groups died (including the infants of vaccinated mothers).
In 2022, vaccinations were pushed through mandates and other coercion, and the deaths expanded to those newly targeted.
In 2023, death in every age group accelerates when they should be the lowest on record.
In 2024, continues without any reset for the premature deaths of the previous 4 years.
The results of the response to COVID are clear - DEATH BY DESIGN.
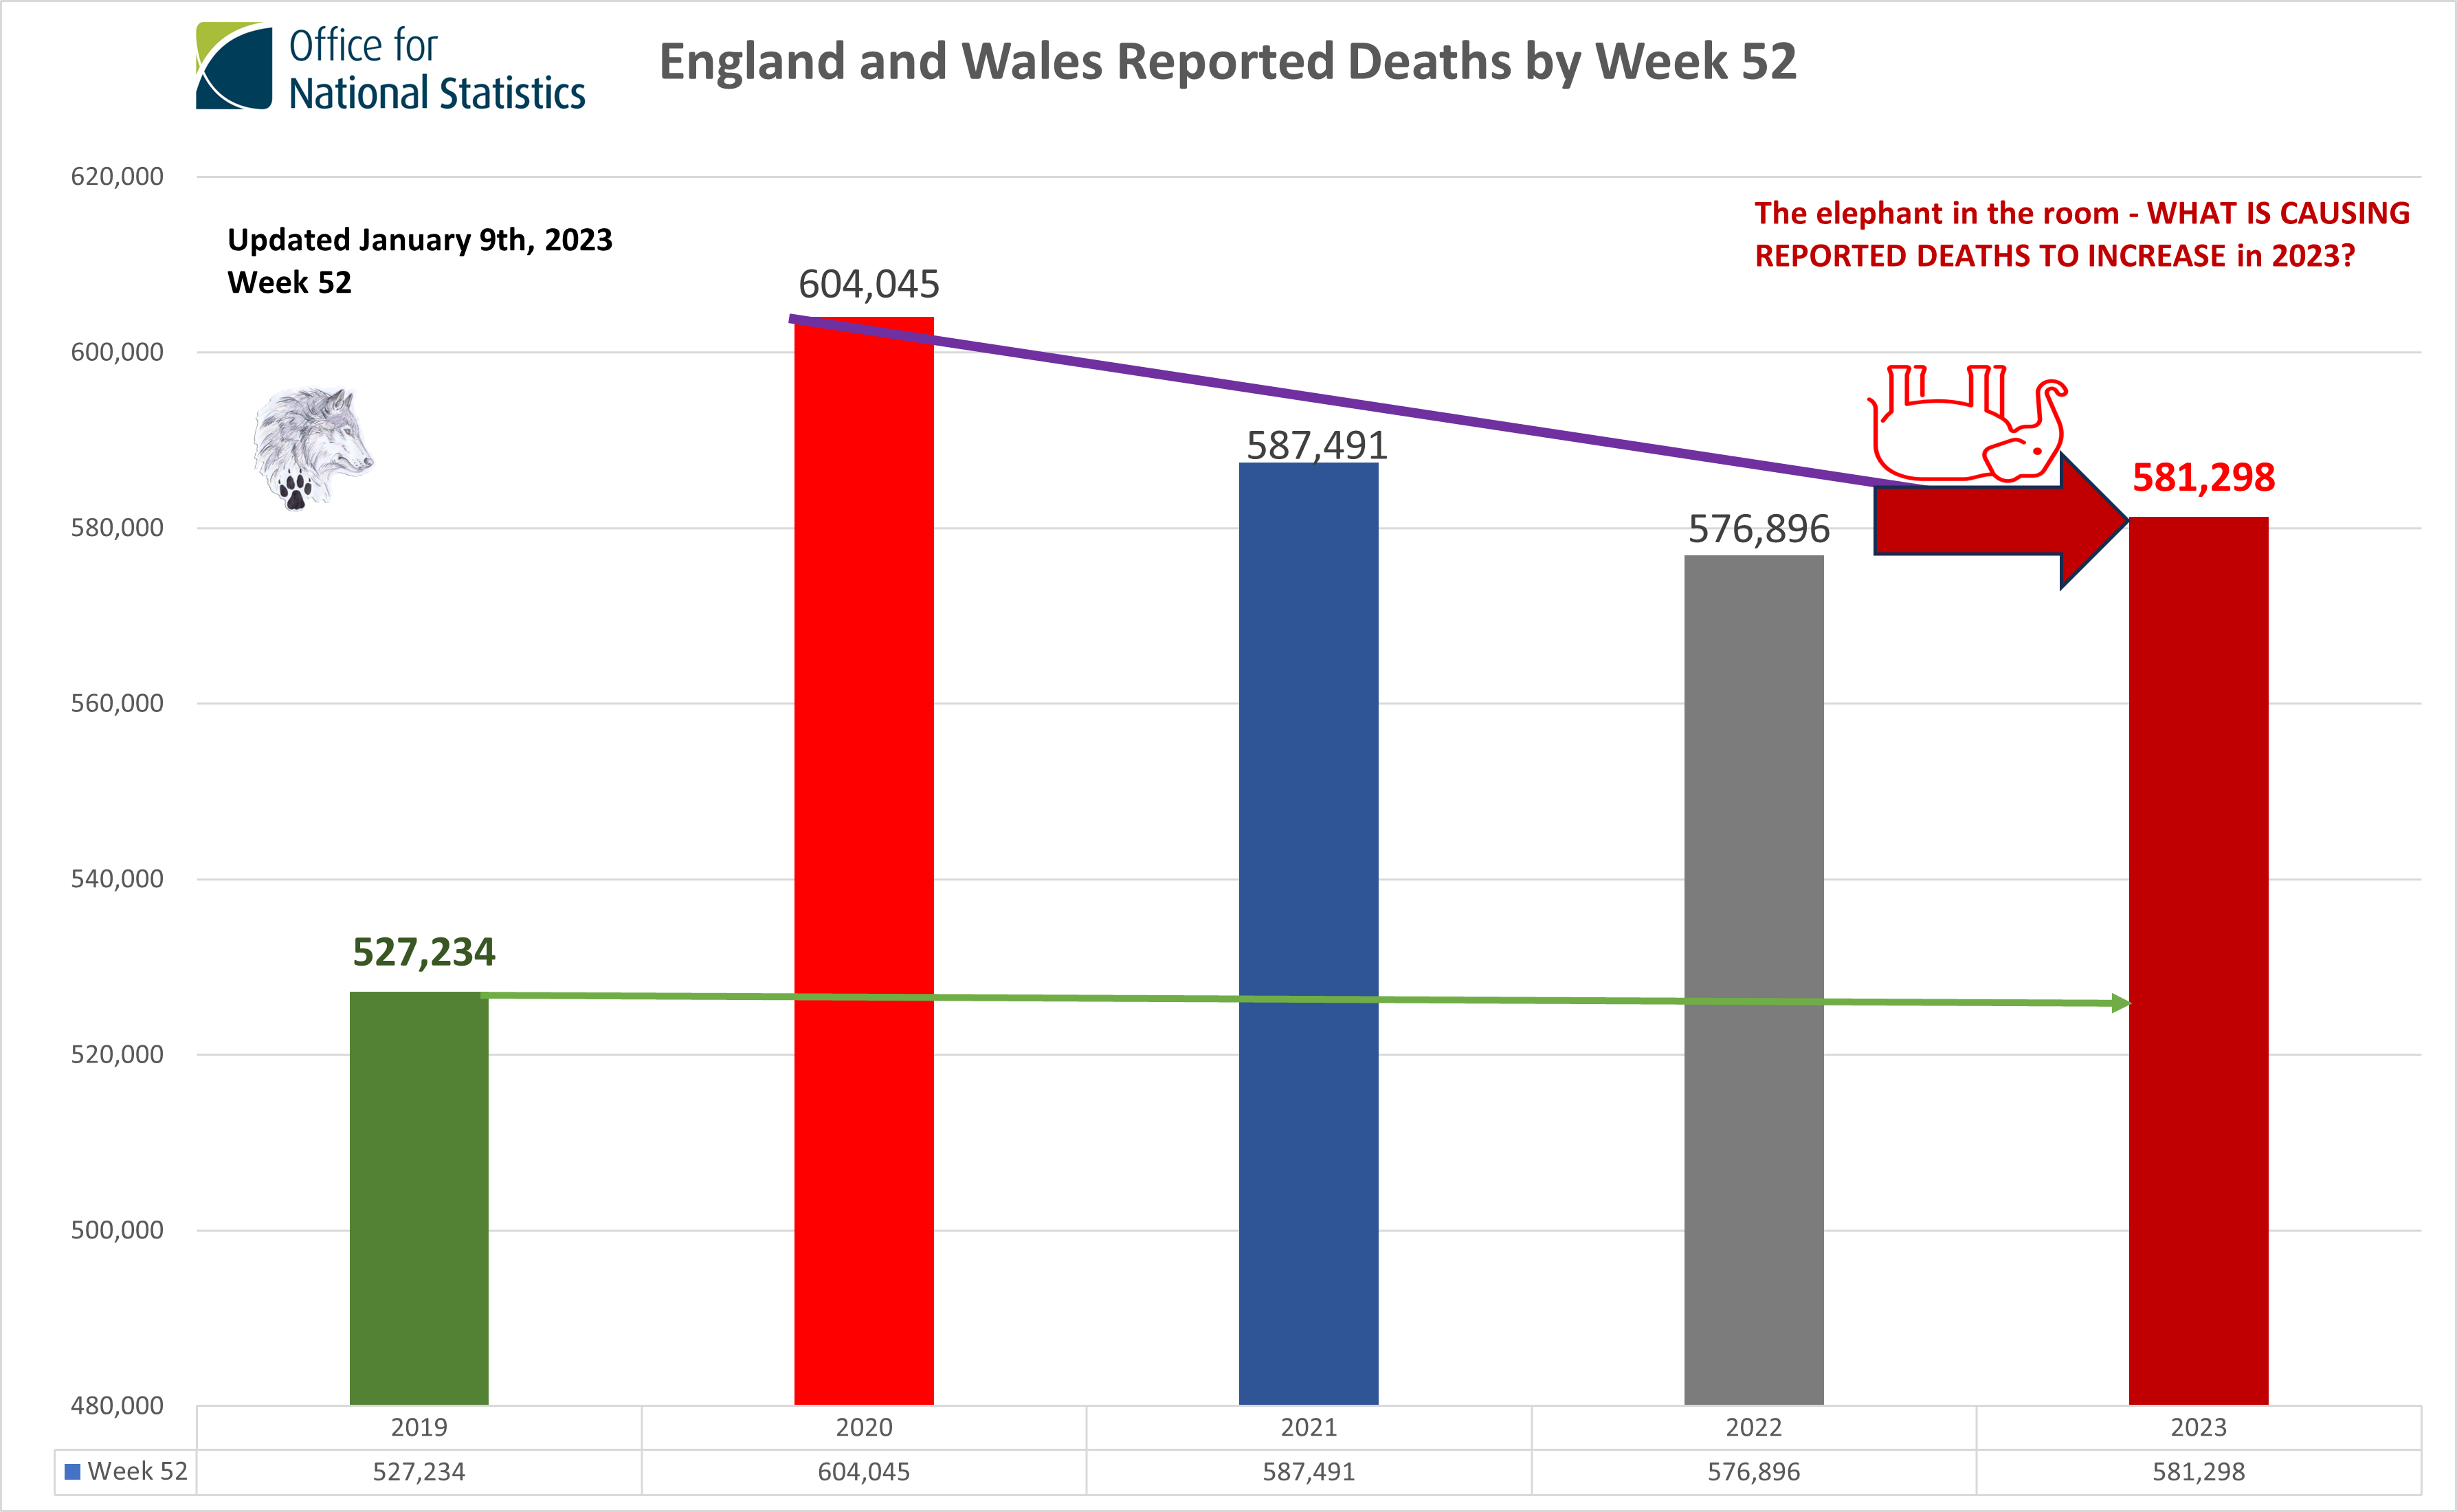
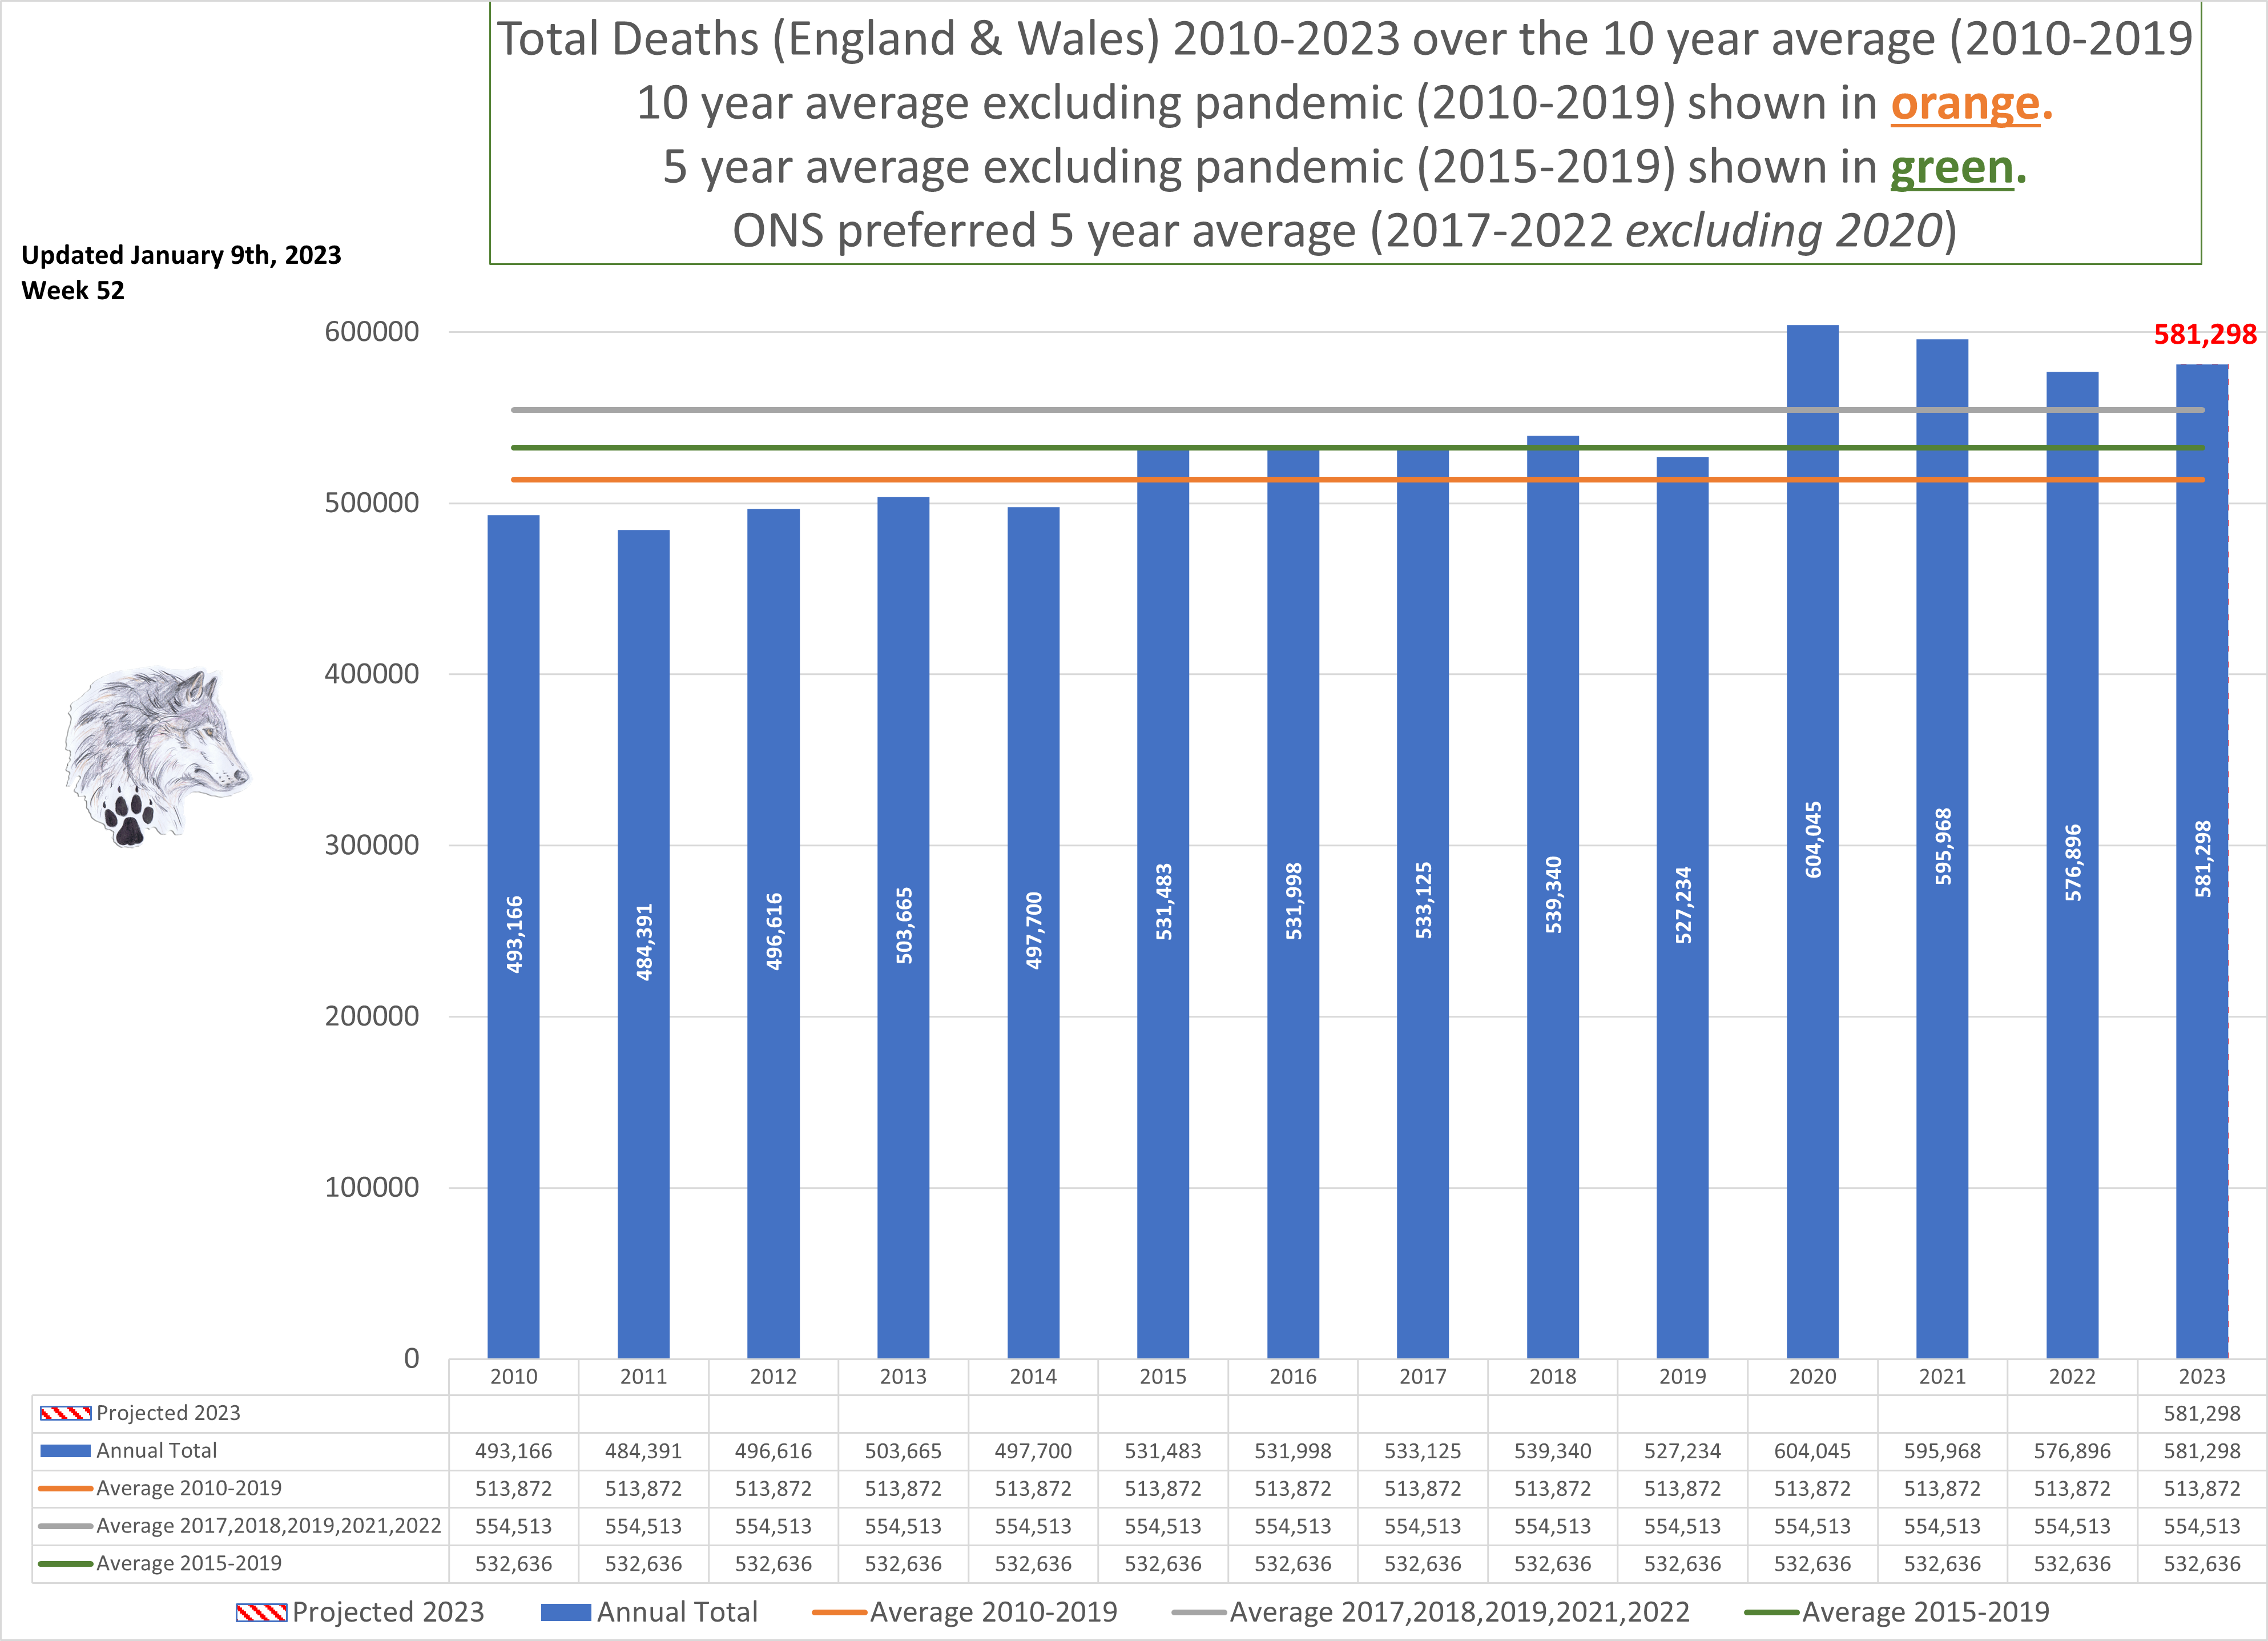
The annual reported deaths from 2010-2019 range between 484,391 and 539,340 with an average of 513,872 reported deaths a year.
From 2010 to 2014 (inclusive) the reported deaths were below the average for this 10-year period. Years 2015-2019 (inclusive) were slightly above the average, with 2019 being below the 2018 reported deaths (by 12,106) but still over the 10-year average. 2018 was a bad flu season overall.
Then we see a huge spike in 2020 which, as you have seen from the cumulative weekly chart, coincides with restrictions, not deaths from COVID. As there had been an effective cull in 2020 (killing off people early who would normally have died in the coming years), we see a drop in reported deaths for 2021 and 2022 (which is still significantly over the 10-year average).
2021 was the year of the primary vaccine push. We see from the cumulative weekly chart on excess deaths that the deaths coincide with the vaccine rollout and other restrictions. 2022 is largely 'free' (no lockdowns outside of Care Homes) with a flatline of vaccine rollout worldwide starting in February 2022. This is something many people are not aware of.
Governments worldwide stopped the aggressive push of vaccines in February 2022 almost in lockstep. Then in July 2022, they all stopped reporting the 'by vaccine status' of hospitalizations and deaths. That change wasn't as simple as just most people being vaccinated but had a nuance of what dose was seeing a rise in hospitalizations and deaths. Due to the continuous aggressive rollout and coercion of vaccines up to February 2022, it looked like the third dose and more was the primary risk for people. However, with the removal of that additional 'noise' of booster doses happening en masse, we started to see an alarming increase in all-cause deaths among those with just a first or second dose (many who were six months or more on since their vaccination). Governments appear to have received their answer at this point.
There was NO SAFE DOSE***.
In addition, the June 2022 data covered the age group 10-39 but the February 2023 and August 2023 data changed that to 18-39 years old. What are they hiding in the deaths of children?
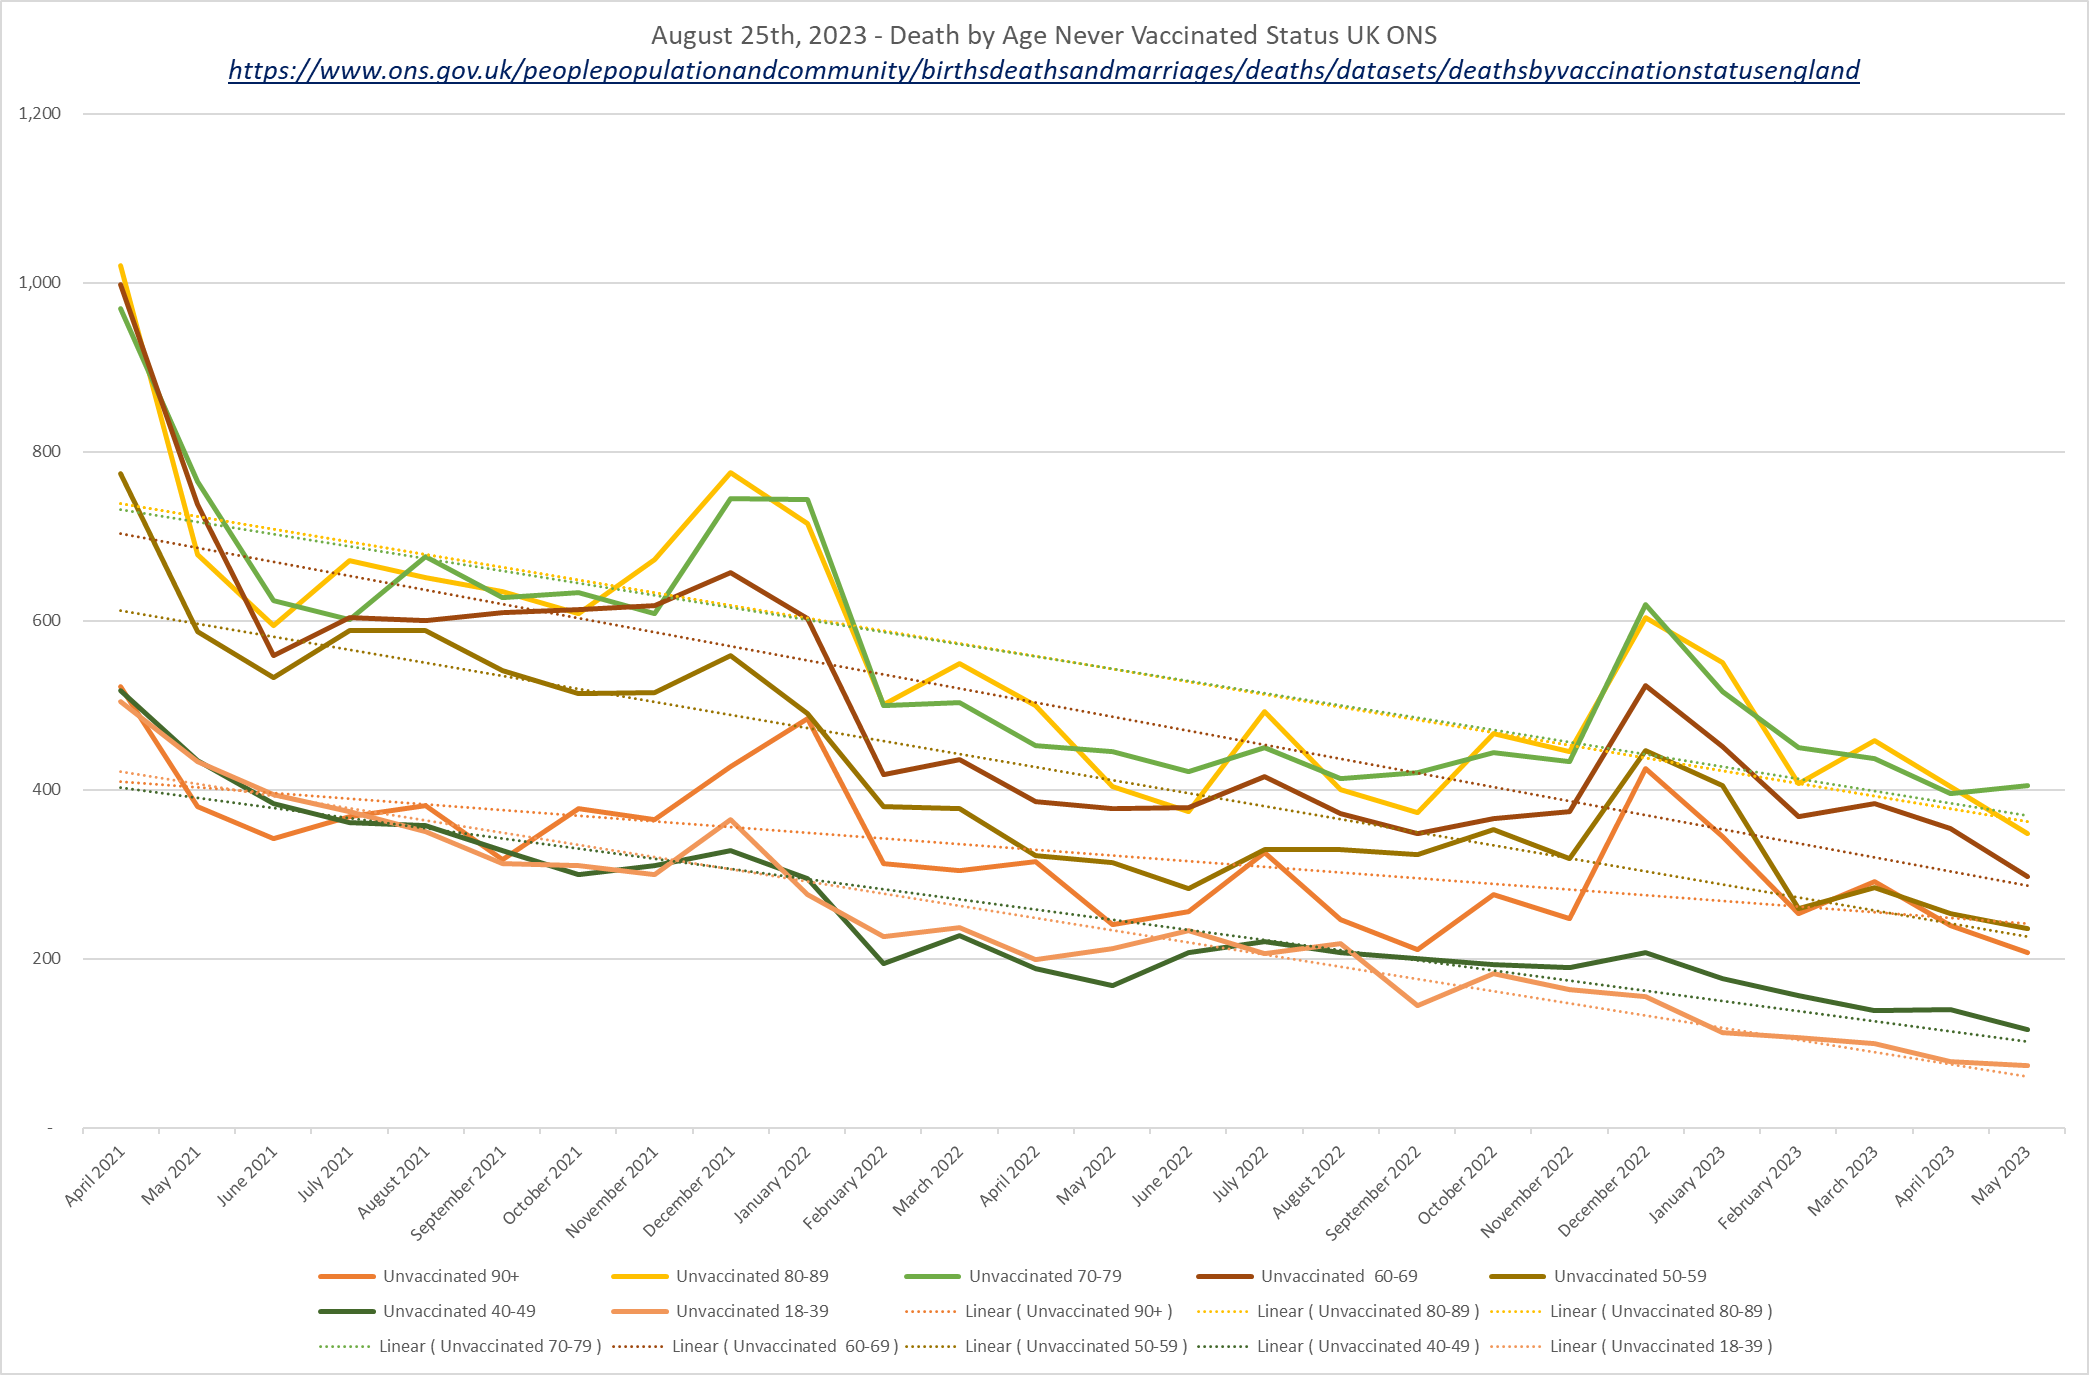
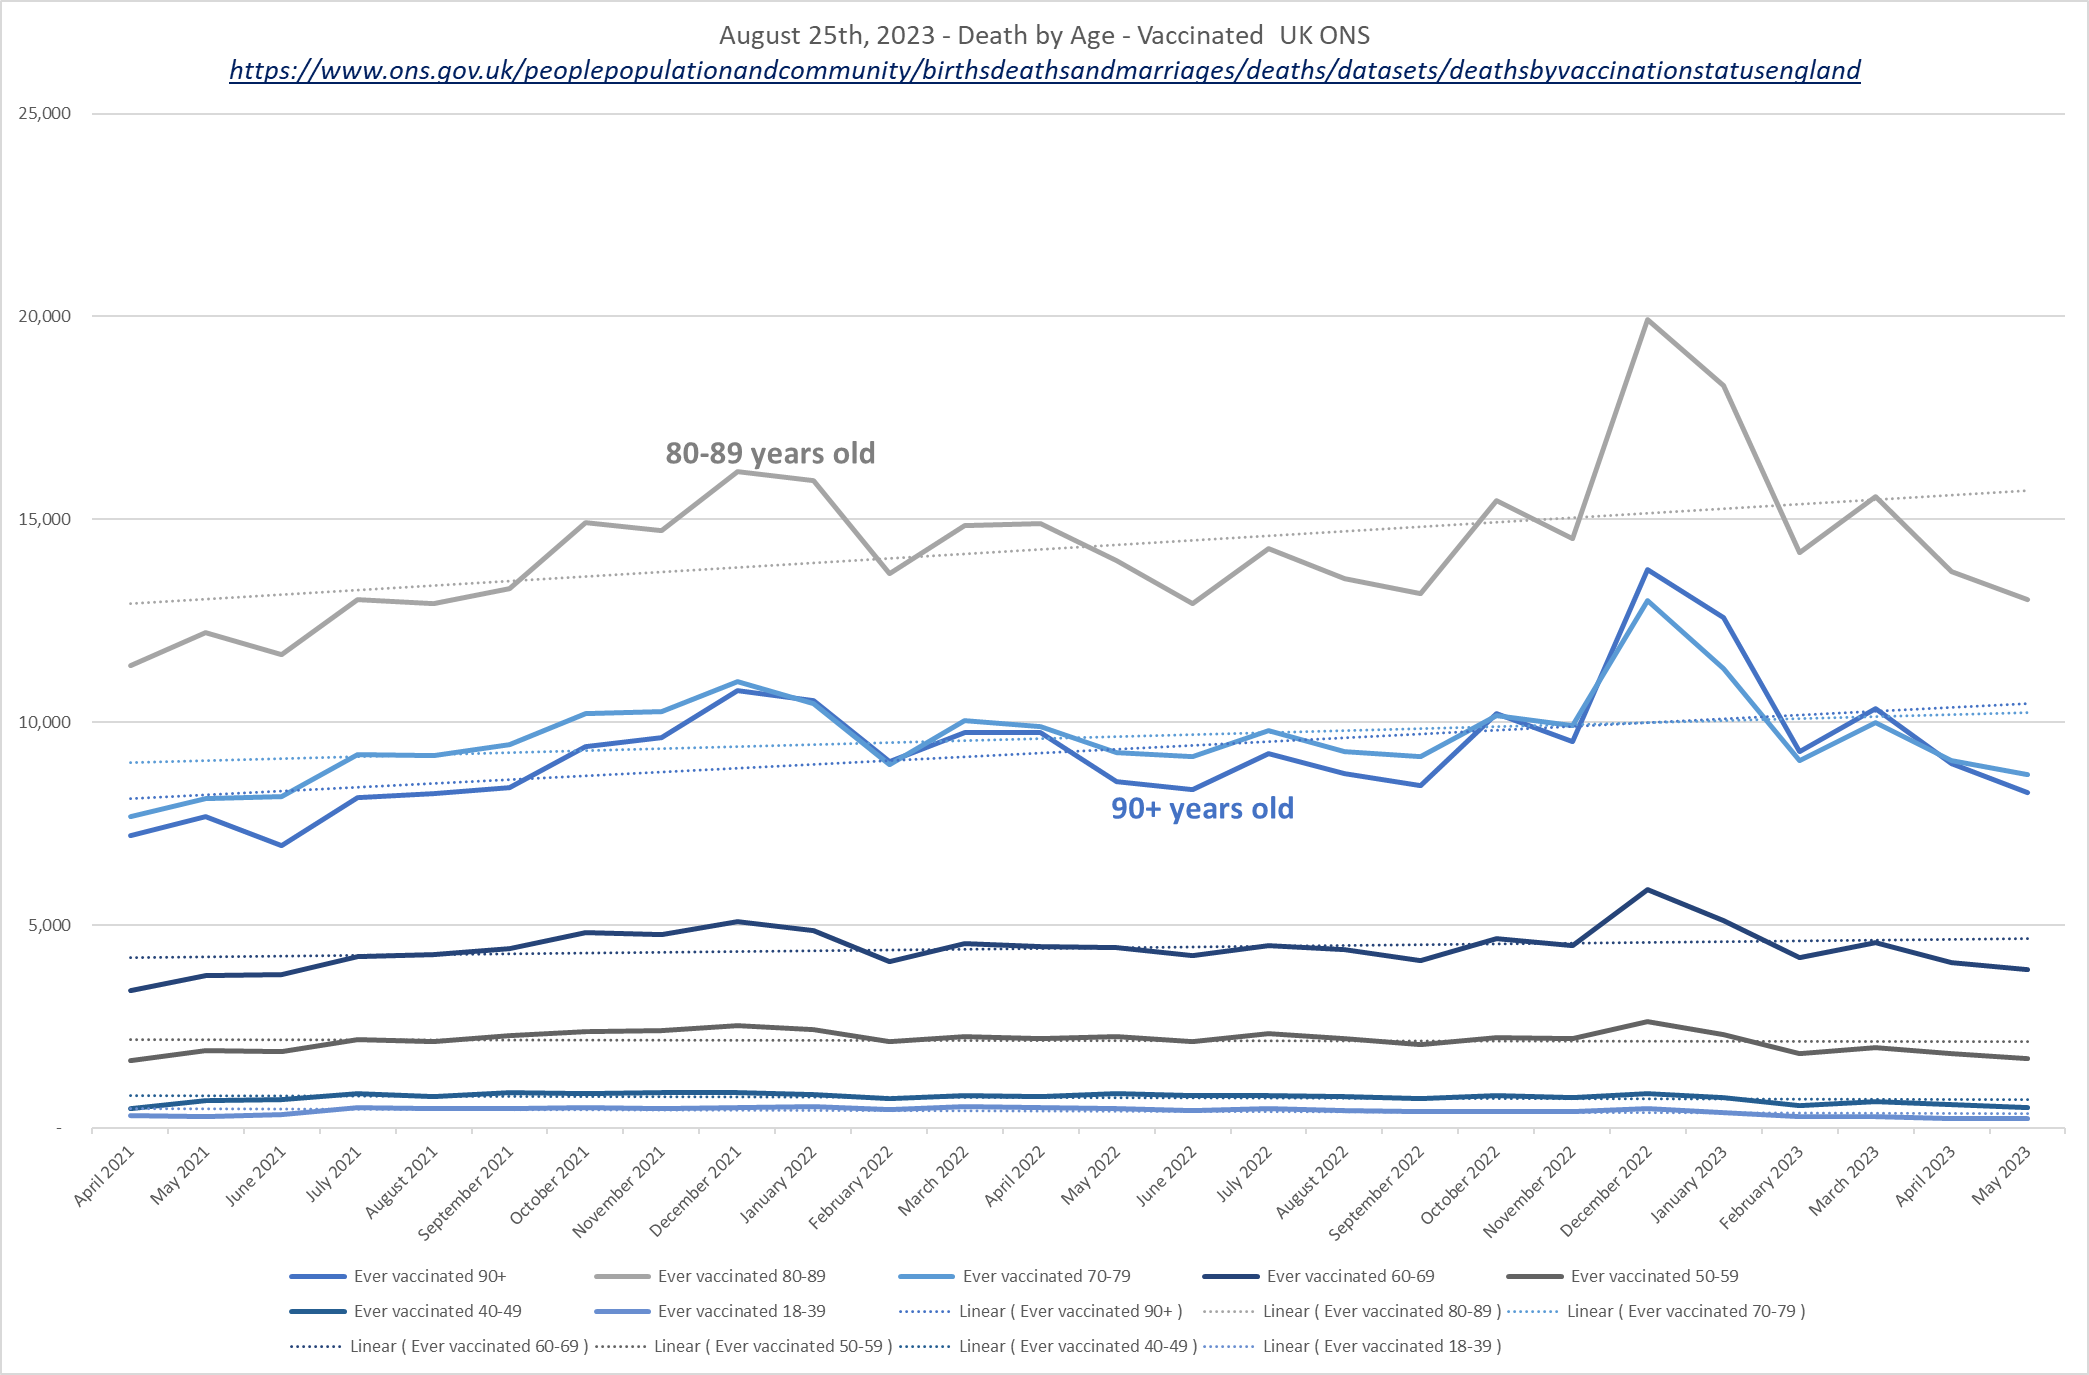
Vaccinated deaths in all age groups continue trending up in the last data file. Note that as bad as this looks, the few months of 2023 will get higher for the vaccinated when the data lag catches up (as seen in the previous data files - chart below).
The NEVER vaccinated in all ages continue trending down in the last data file.
The 80-89-year-old vaccinated group being much higher than 90+ vaccinated group was a surprise. Even the 70-79-year-old age vaccinated group is higher than the 90+... until the unexplained spike in December 2022.
back to top of page
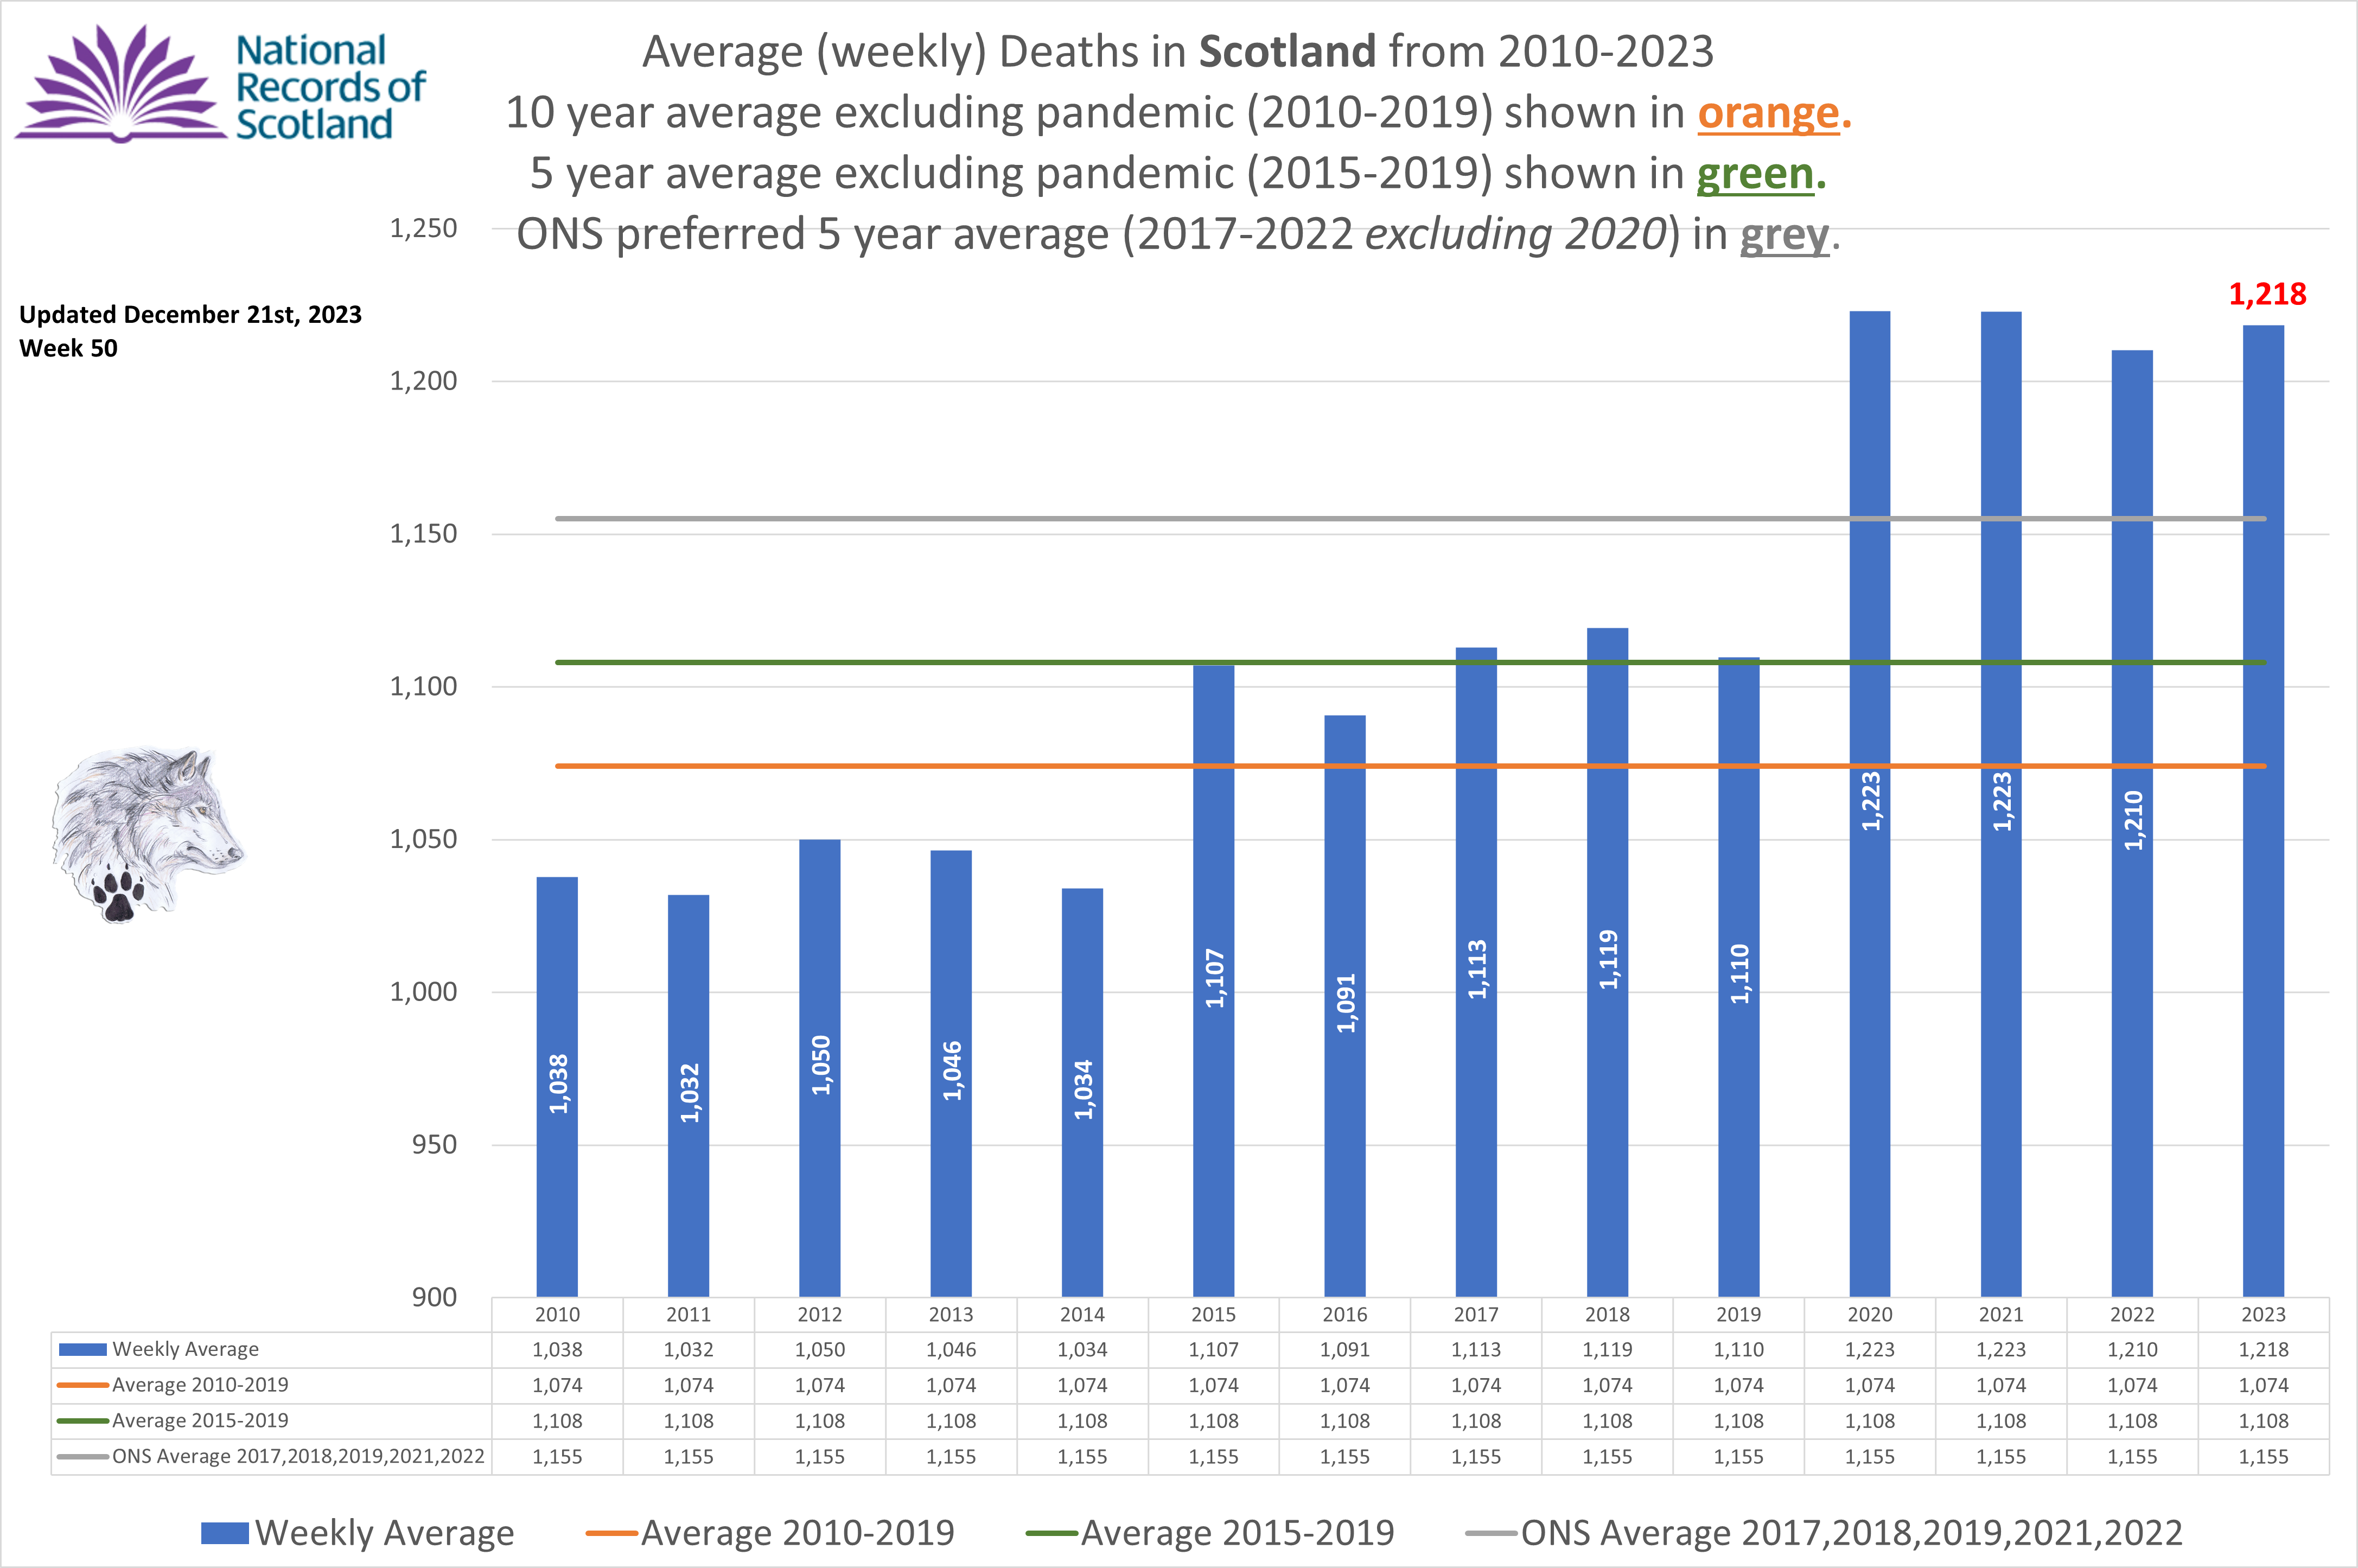
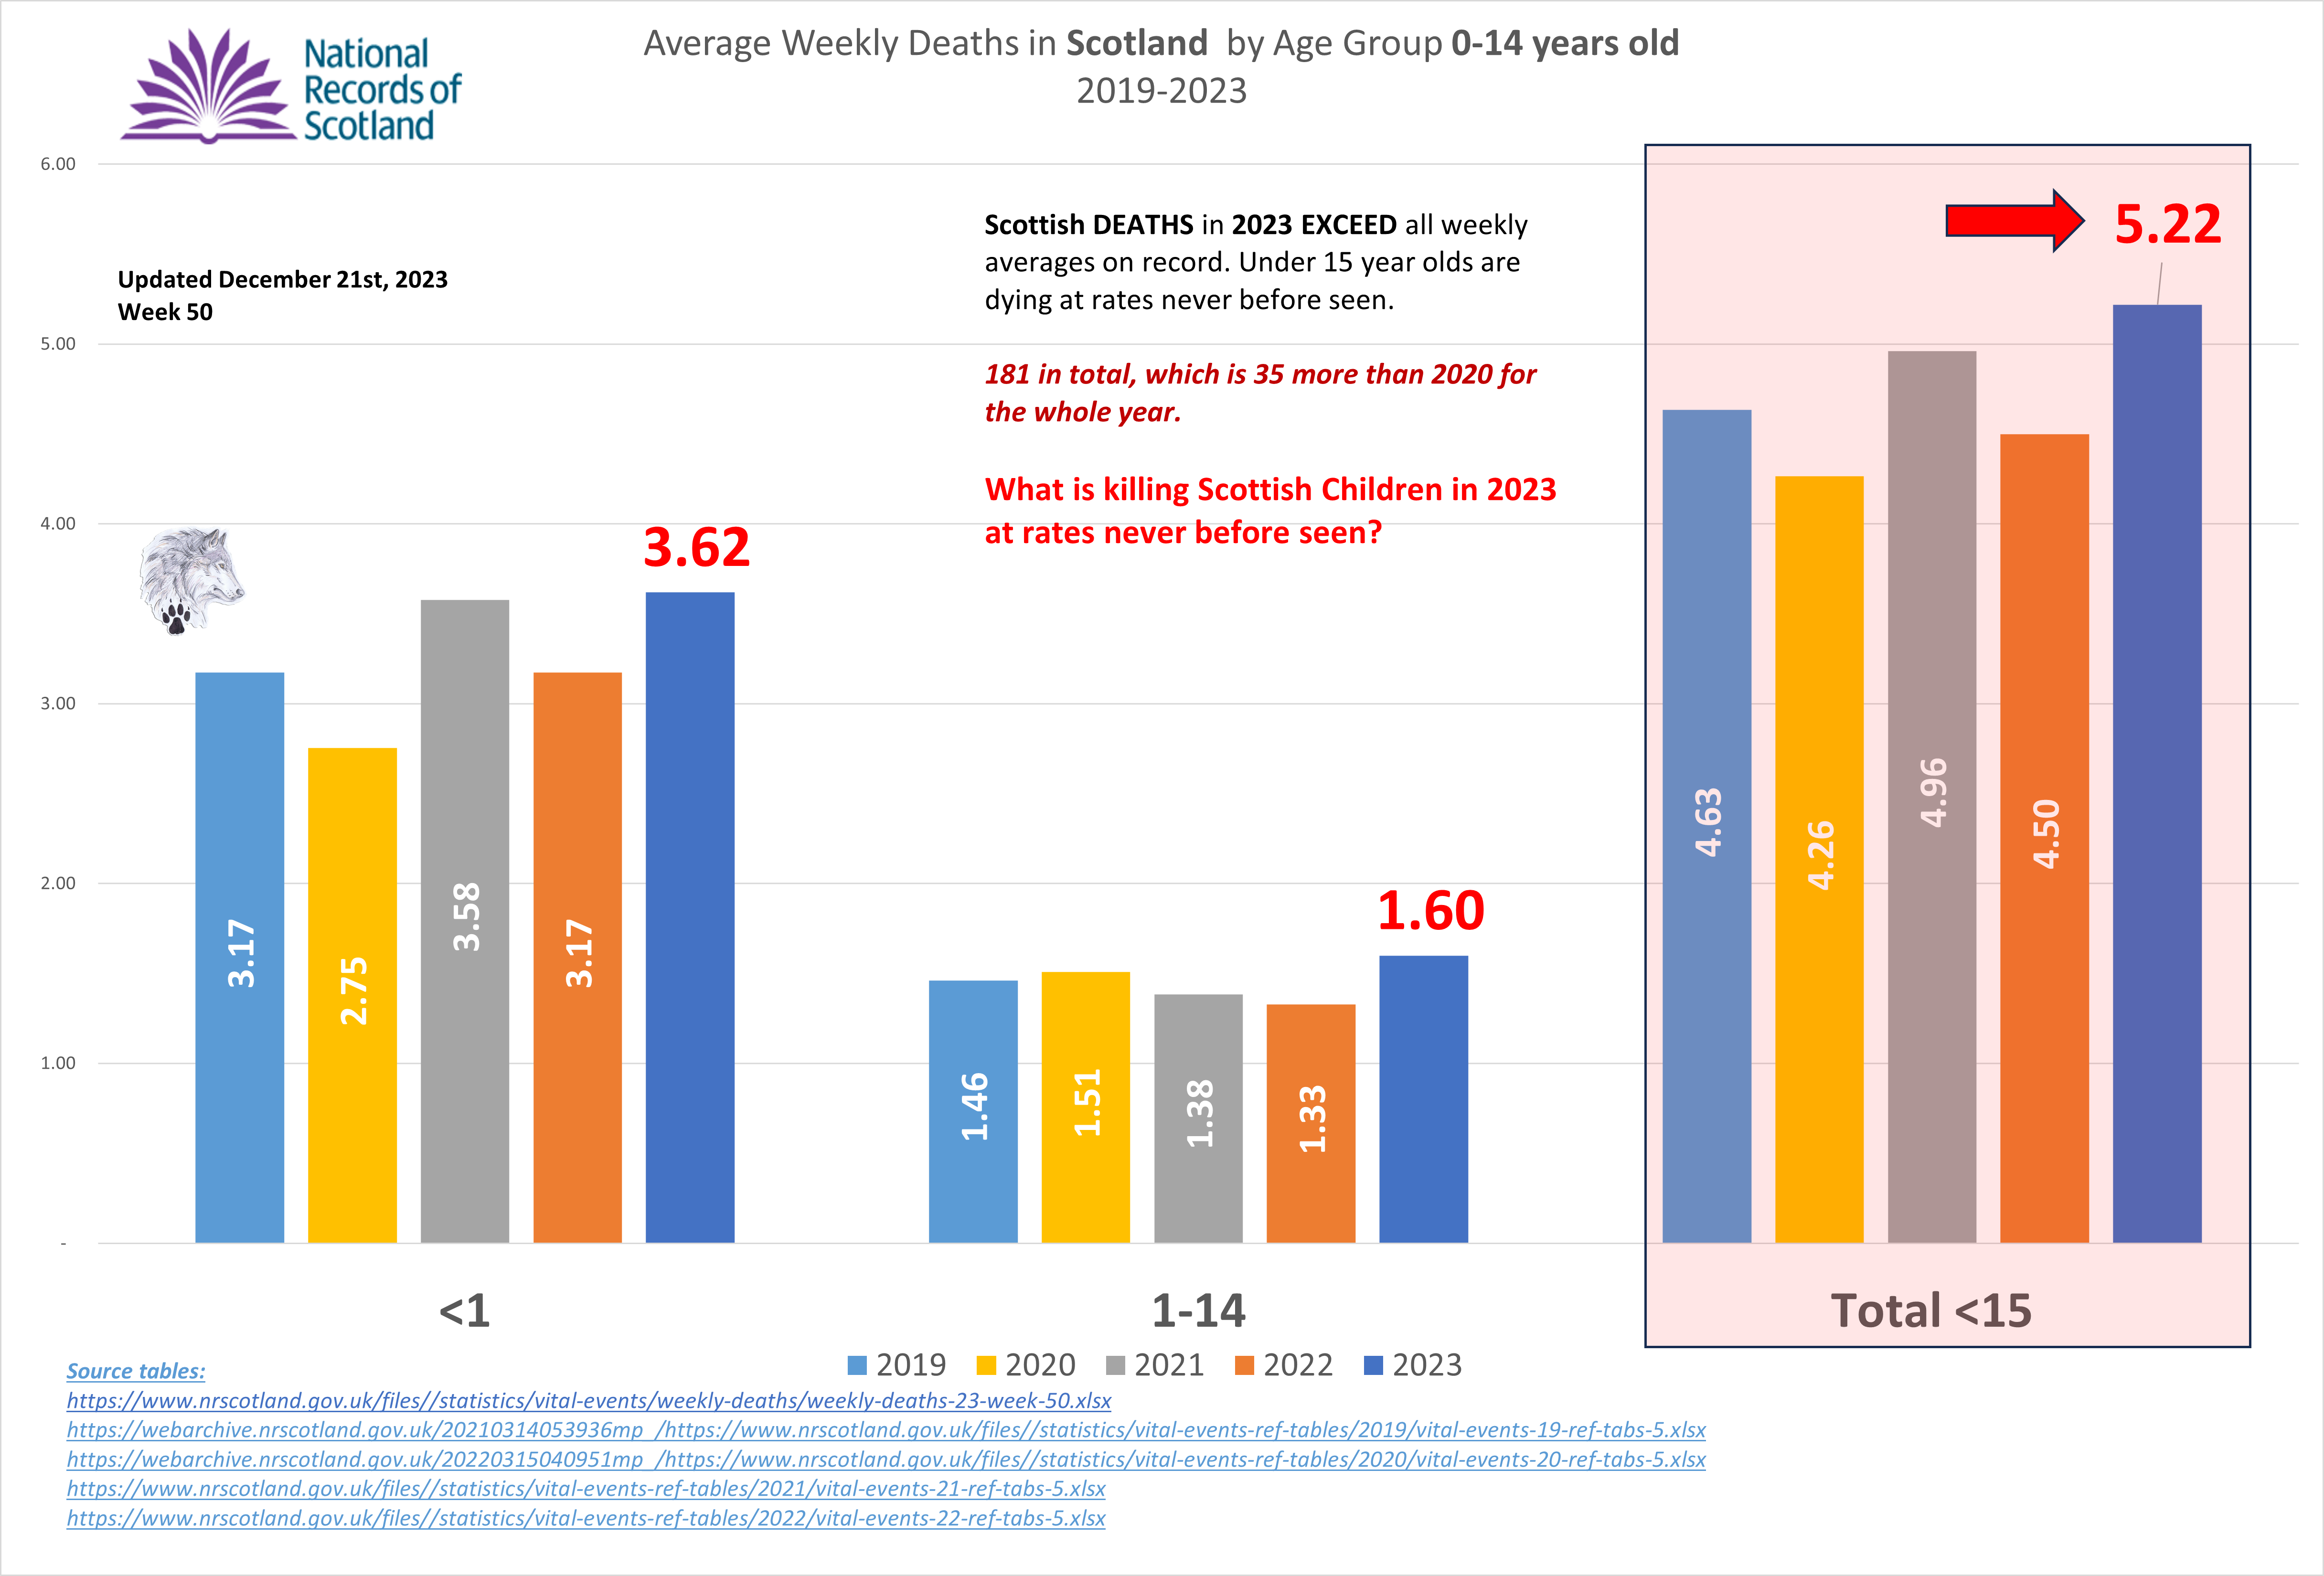
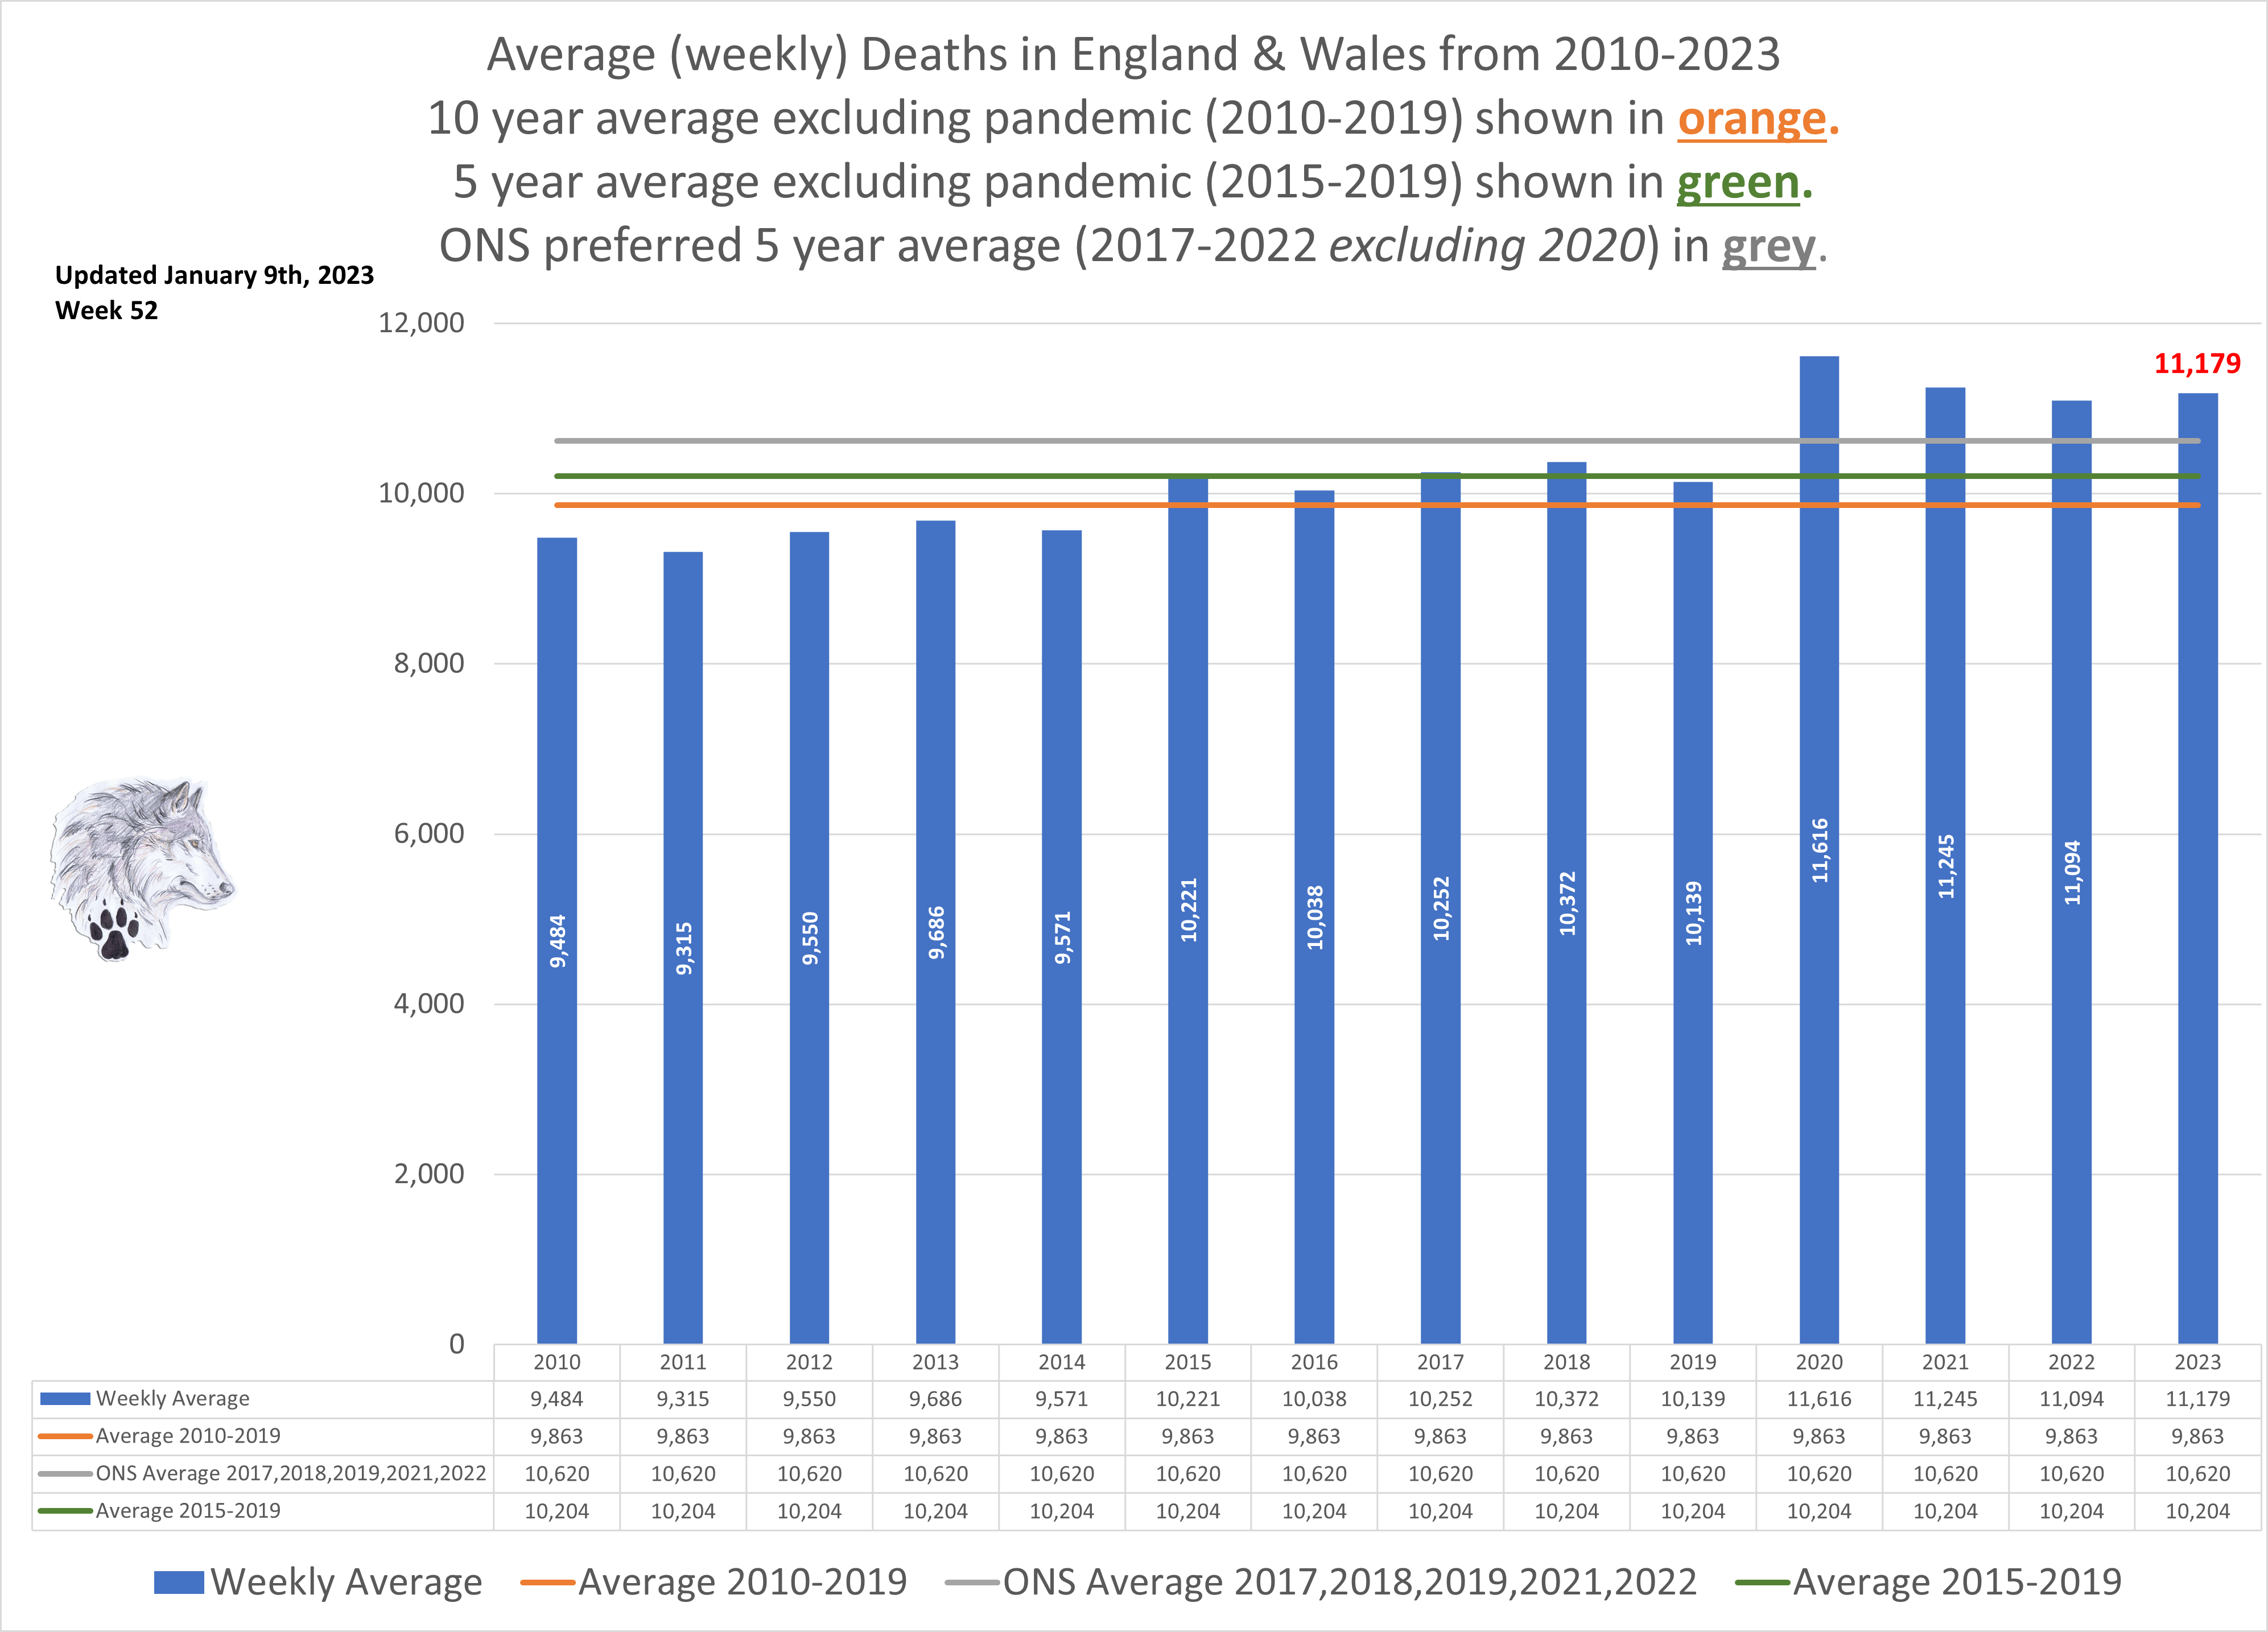
Then we get to the truly alarming increase in average weekly deaths in 2023 and now 2024. Almost no vaccinations going on outside those that are now addicted to them and on their fourth, fifth or more - and worse,
CHILDREN.
Now we have to go to the weekly average (as we are only part way through the year). We suddenly have another spike and one larger than ever beating out 2020 by a huge margin and breaking the downward trend of 2021 and 2022.
This is the truly terrifying reality of the long term impacts of even a SINGLE DOSE on society.
 back to top of page
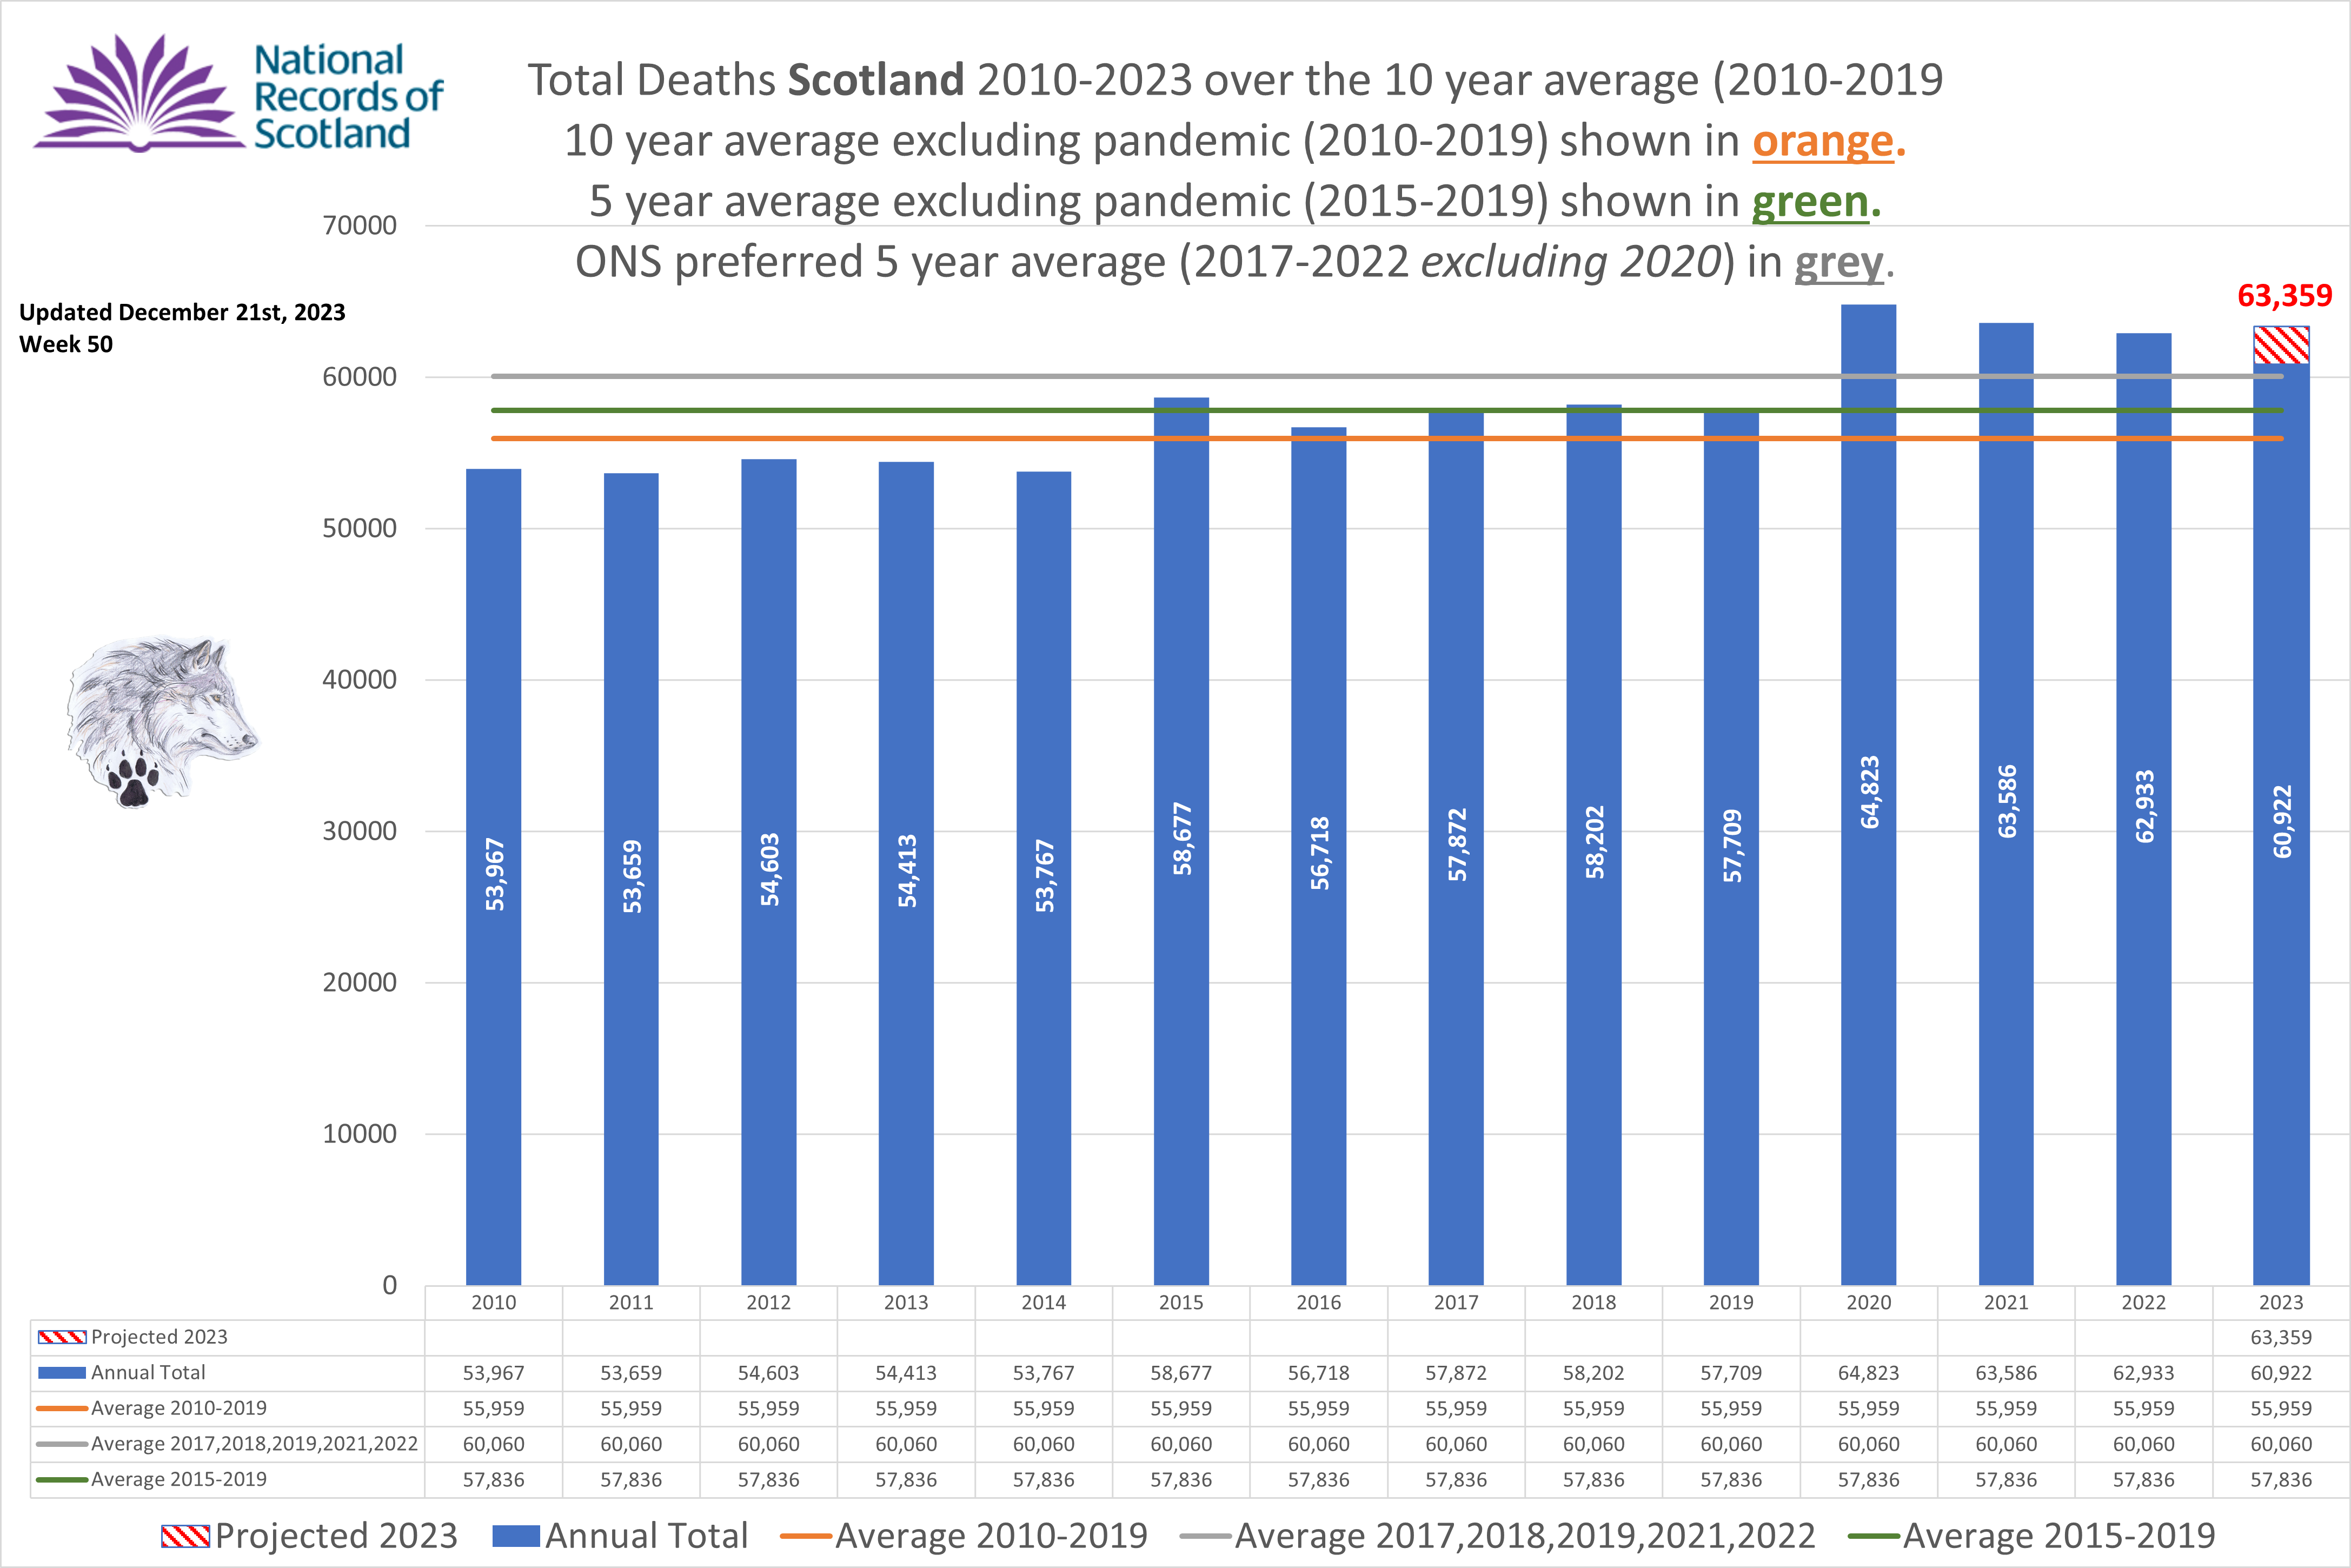
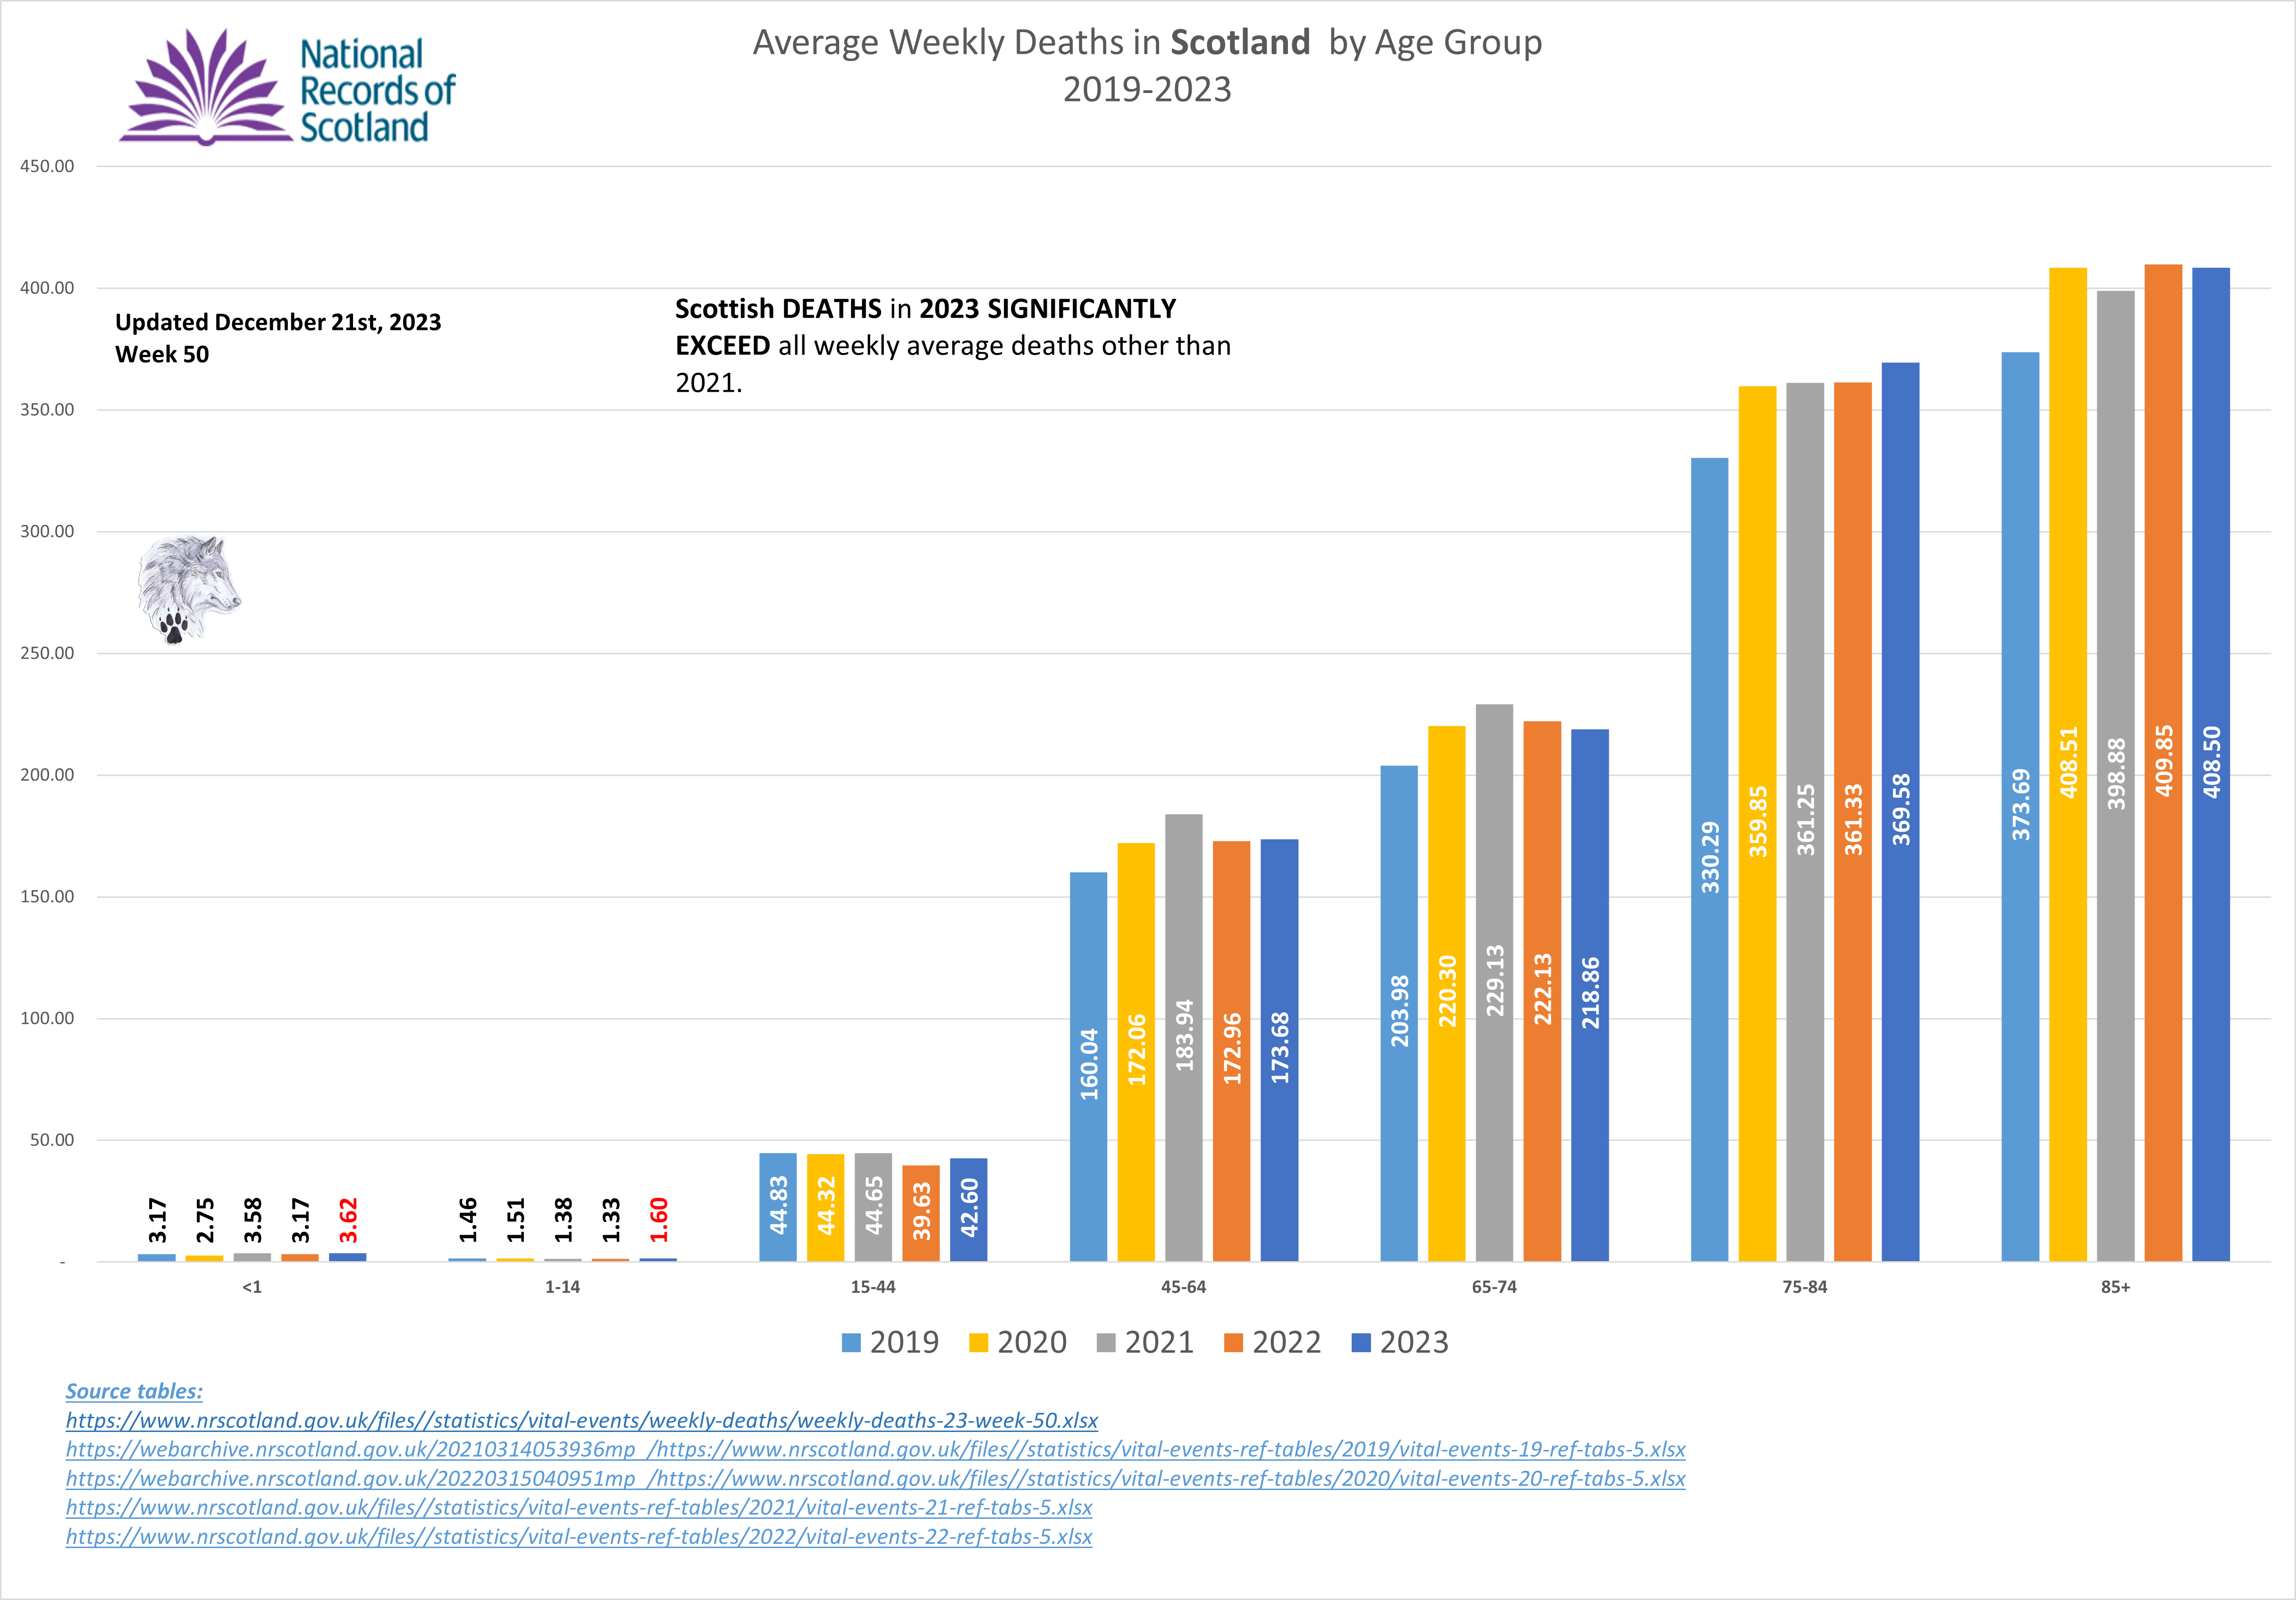
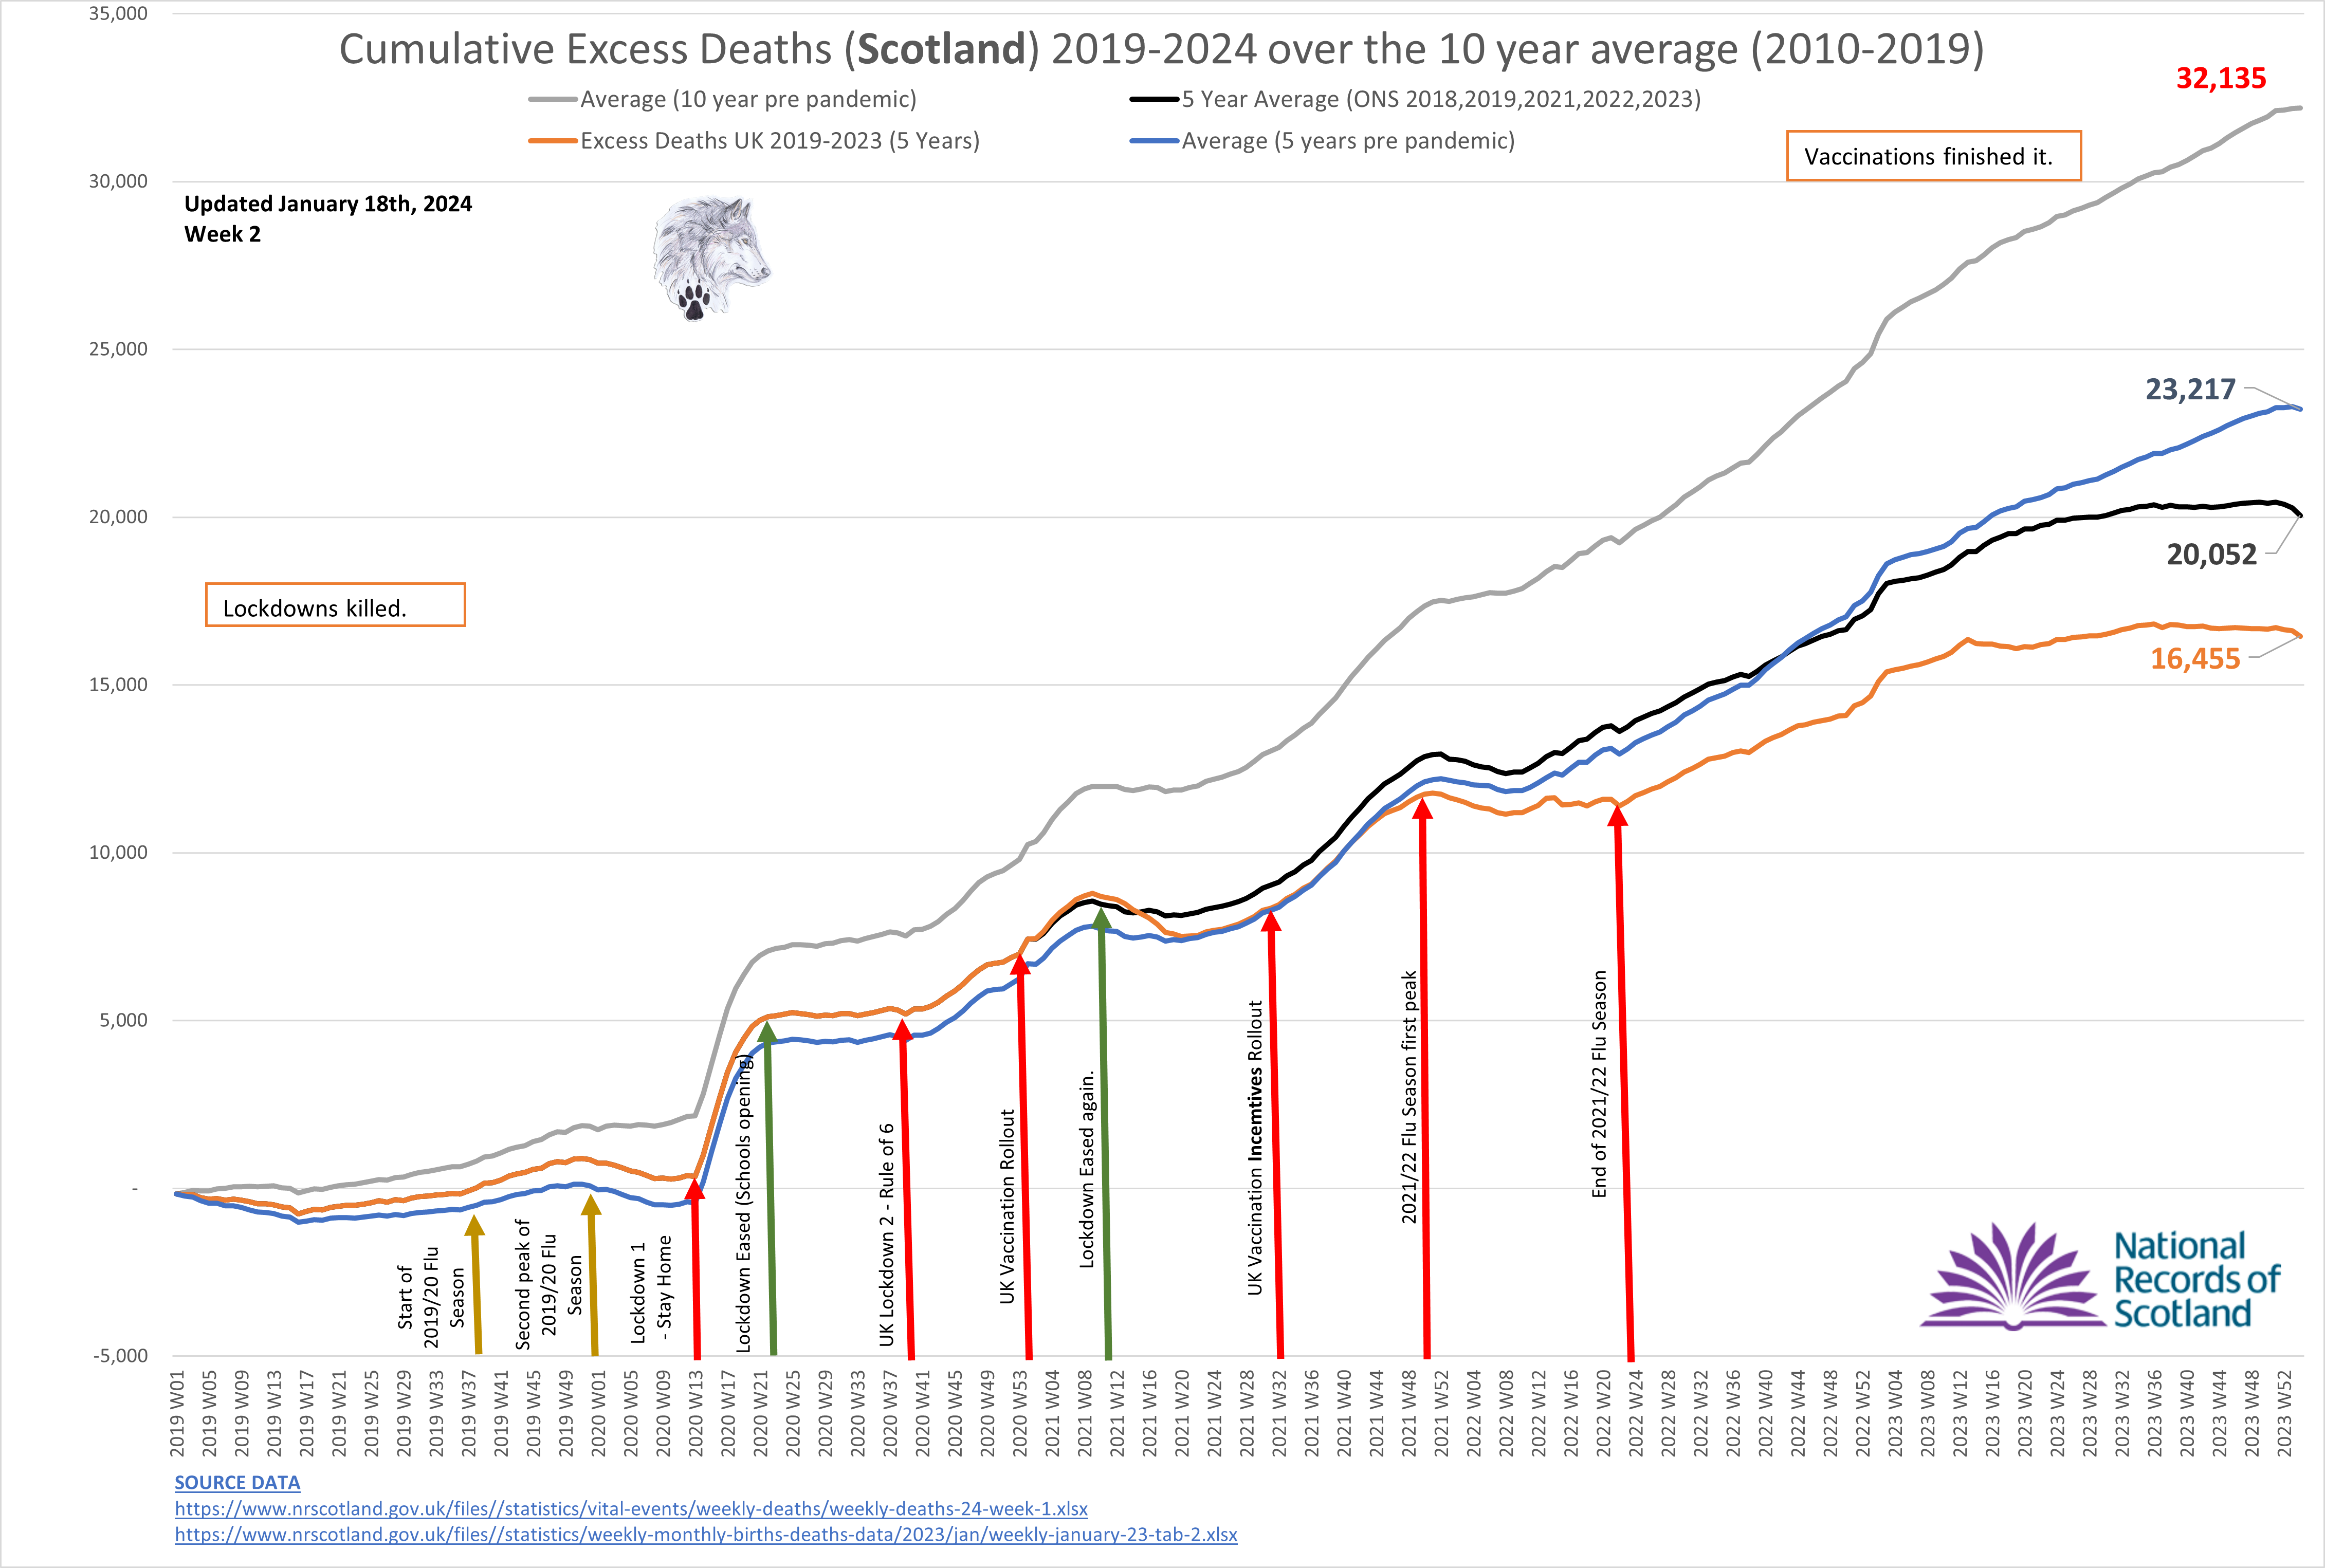
SCOTLAND - May 30th, 2024 Week 20.
2023 looking to be the worst ever for Scotland. 7,318 Excess Deaths OVER the 10-year pre-pandemic average by Week 50. Even using the UK ONS 5 years moving average (that skews the data using 2017,2018,2019, 2021,2022) Excess Deaths stand at 3,343.
Scotland's Excess Deaths (since 2019) now stand at 31,924 based on the 10-year pre-pandemic average. Added to England and Wales, there have been 366,396 Excess Deaths (England, Wales, Scotland, Ireland, Northern Ireland) since 2019.
As with England and Wales (and many other countries), Scotland started 2020 with a NEGATIVE 10-year cumulative Excess Death count.
In most countries, the excess death rates for 2018 and 2019 were almost identical (or dropping slightly). Using 2019 as a baseline for expected excess deaths, we see the following:
In Scotland, using the UK ONS Data, based on ten-year average deaths to calculate excess deaths (2010-2019) to filter out the pandemic years, we see cumulative excess deaths above the expected excess deaths.
The UK ONS uses a 5-year moving baseline that excludes 2020, but includes 2021 and 2022 which skews the data. However, based on the UK ONS five-year average deaths (2017, 2018, 2019, 2021, 2023) we get a negative expectation for deaths following the trend from 2018/2019.
Here we see the exact same number of cumulative excess deaths above the expected excess deaths.
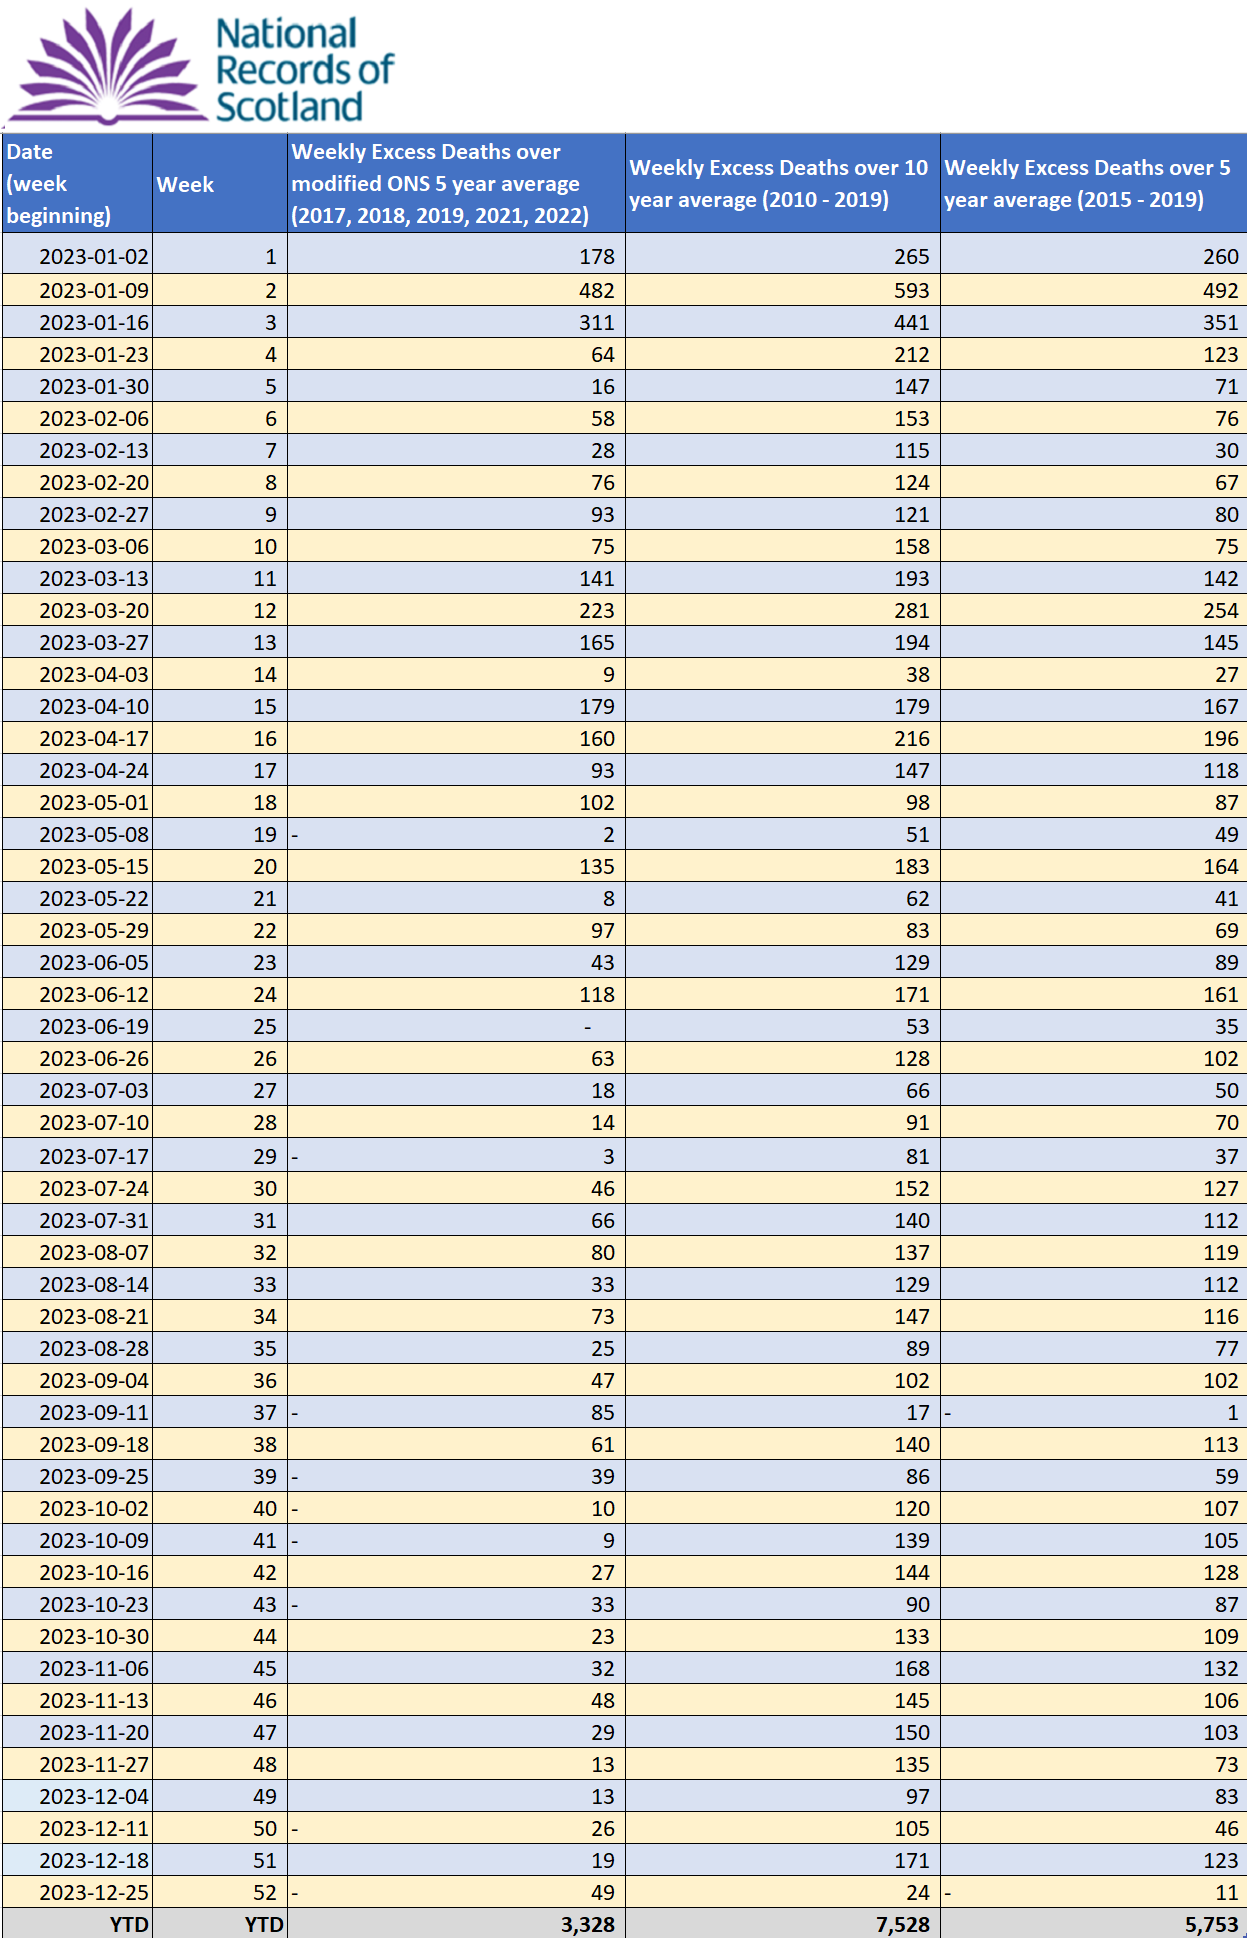
Using weekly excess death comparisons rather than annual, yields identical results in the total difference between expected and actual cumulative excess deaths.
Using a five year modified moving weekly average (excluding 2020), as per the UK ONS, provides a very similar pattern in excess deaths but obscures the true scale of the issue and improperly skews the 2020 data.
However, the pattern is clear that excess deaths continue to climb at an alarming rate into 2023.
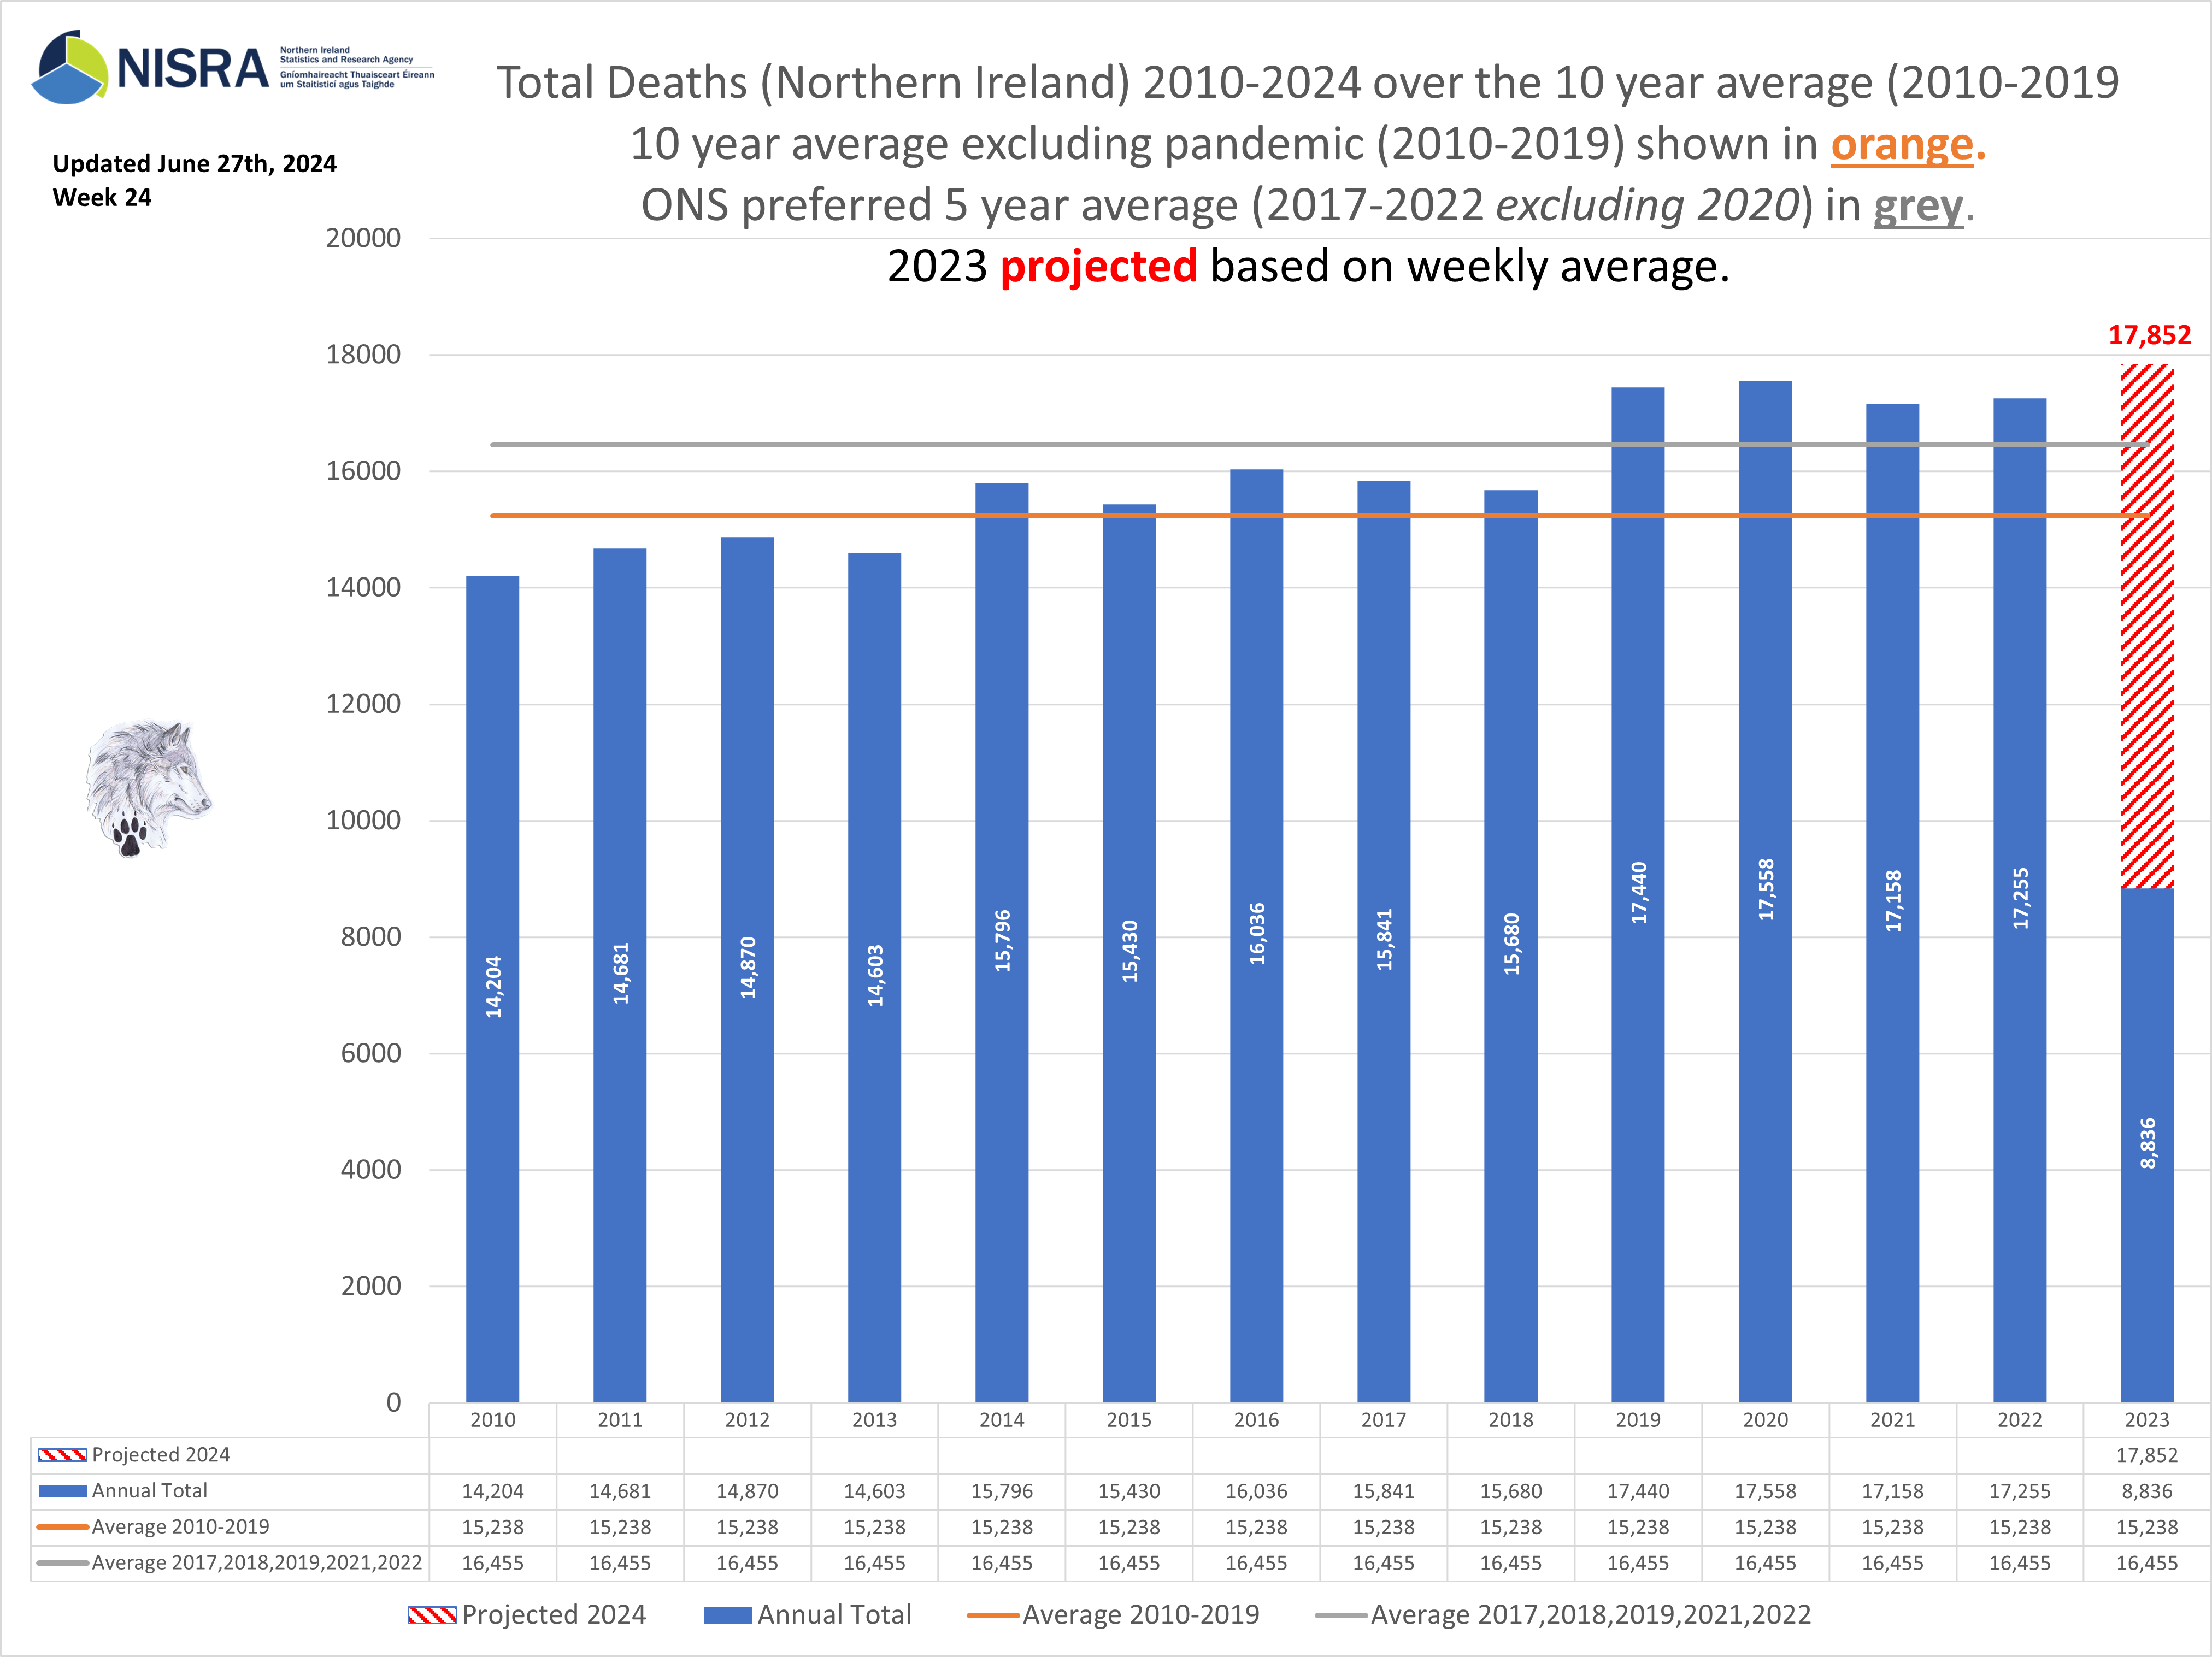
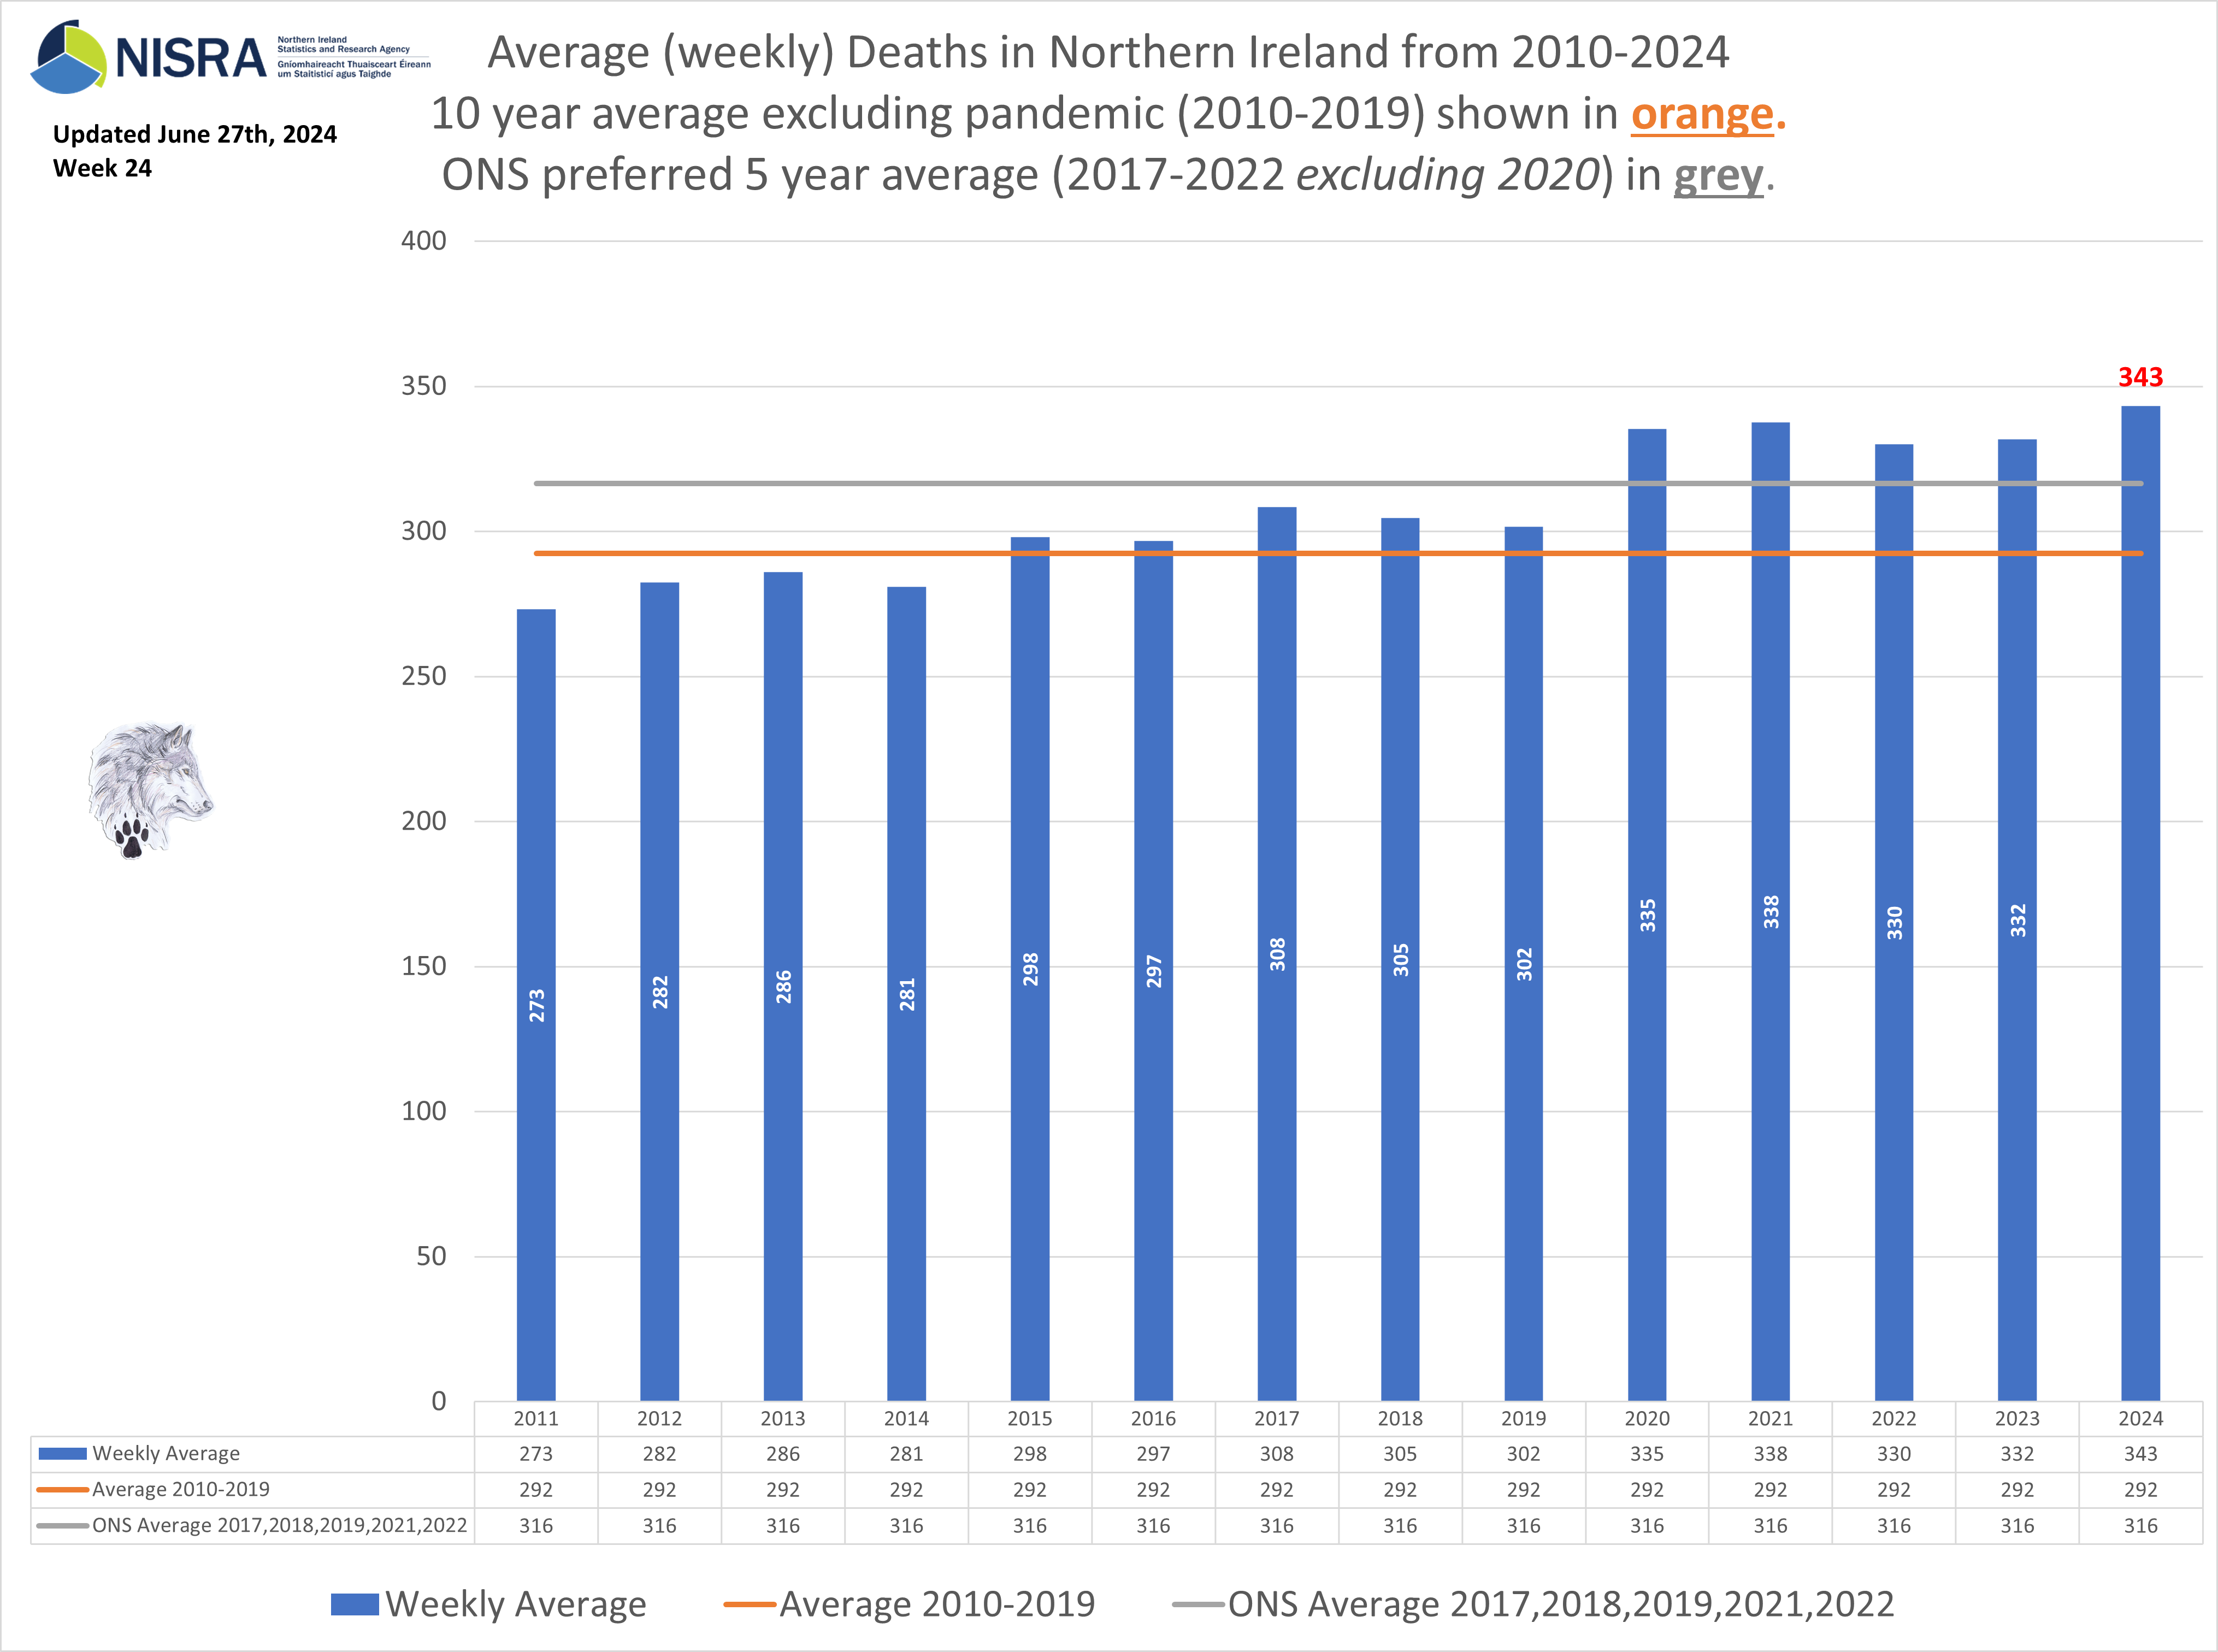
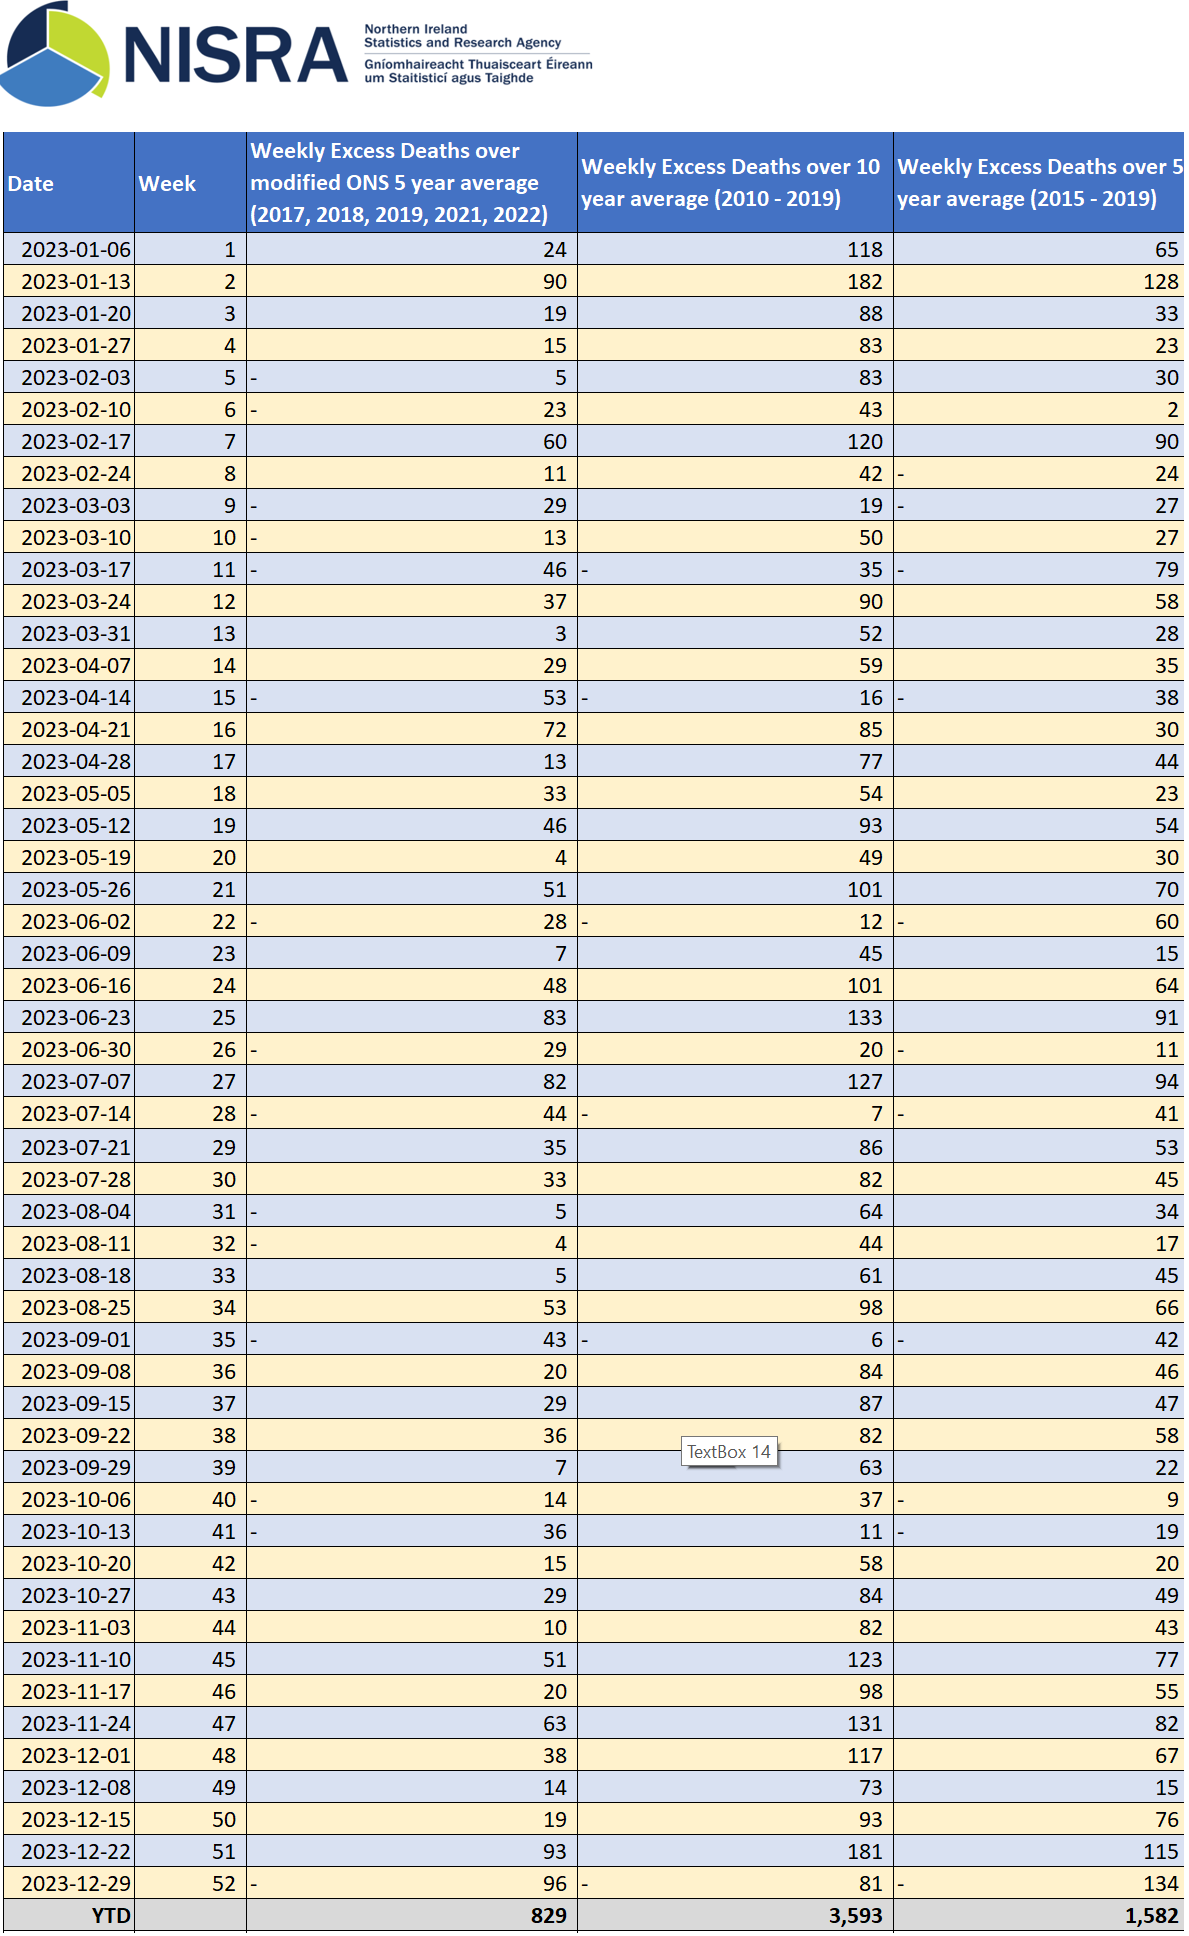
NORTHERN IRELAND - September 13th, 2024 Week 36.
2023 was the worst ever for Northern Ireland. 3,575 Excess Deaths OVER the 10-year pre-pandemic average.
2024 is on track already to be the worst ever for Northern Ireland. 2,955 Excess Deaths OVER the 10-year pre-pandemic average.
Northern Ireland's Excess Deaths (since 2019) now stand at over 17,000 based on the 10-year pre-pandemic average.
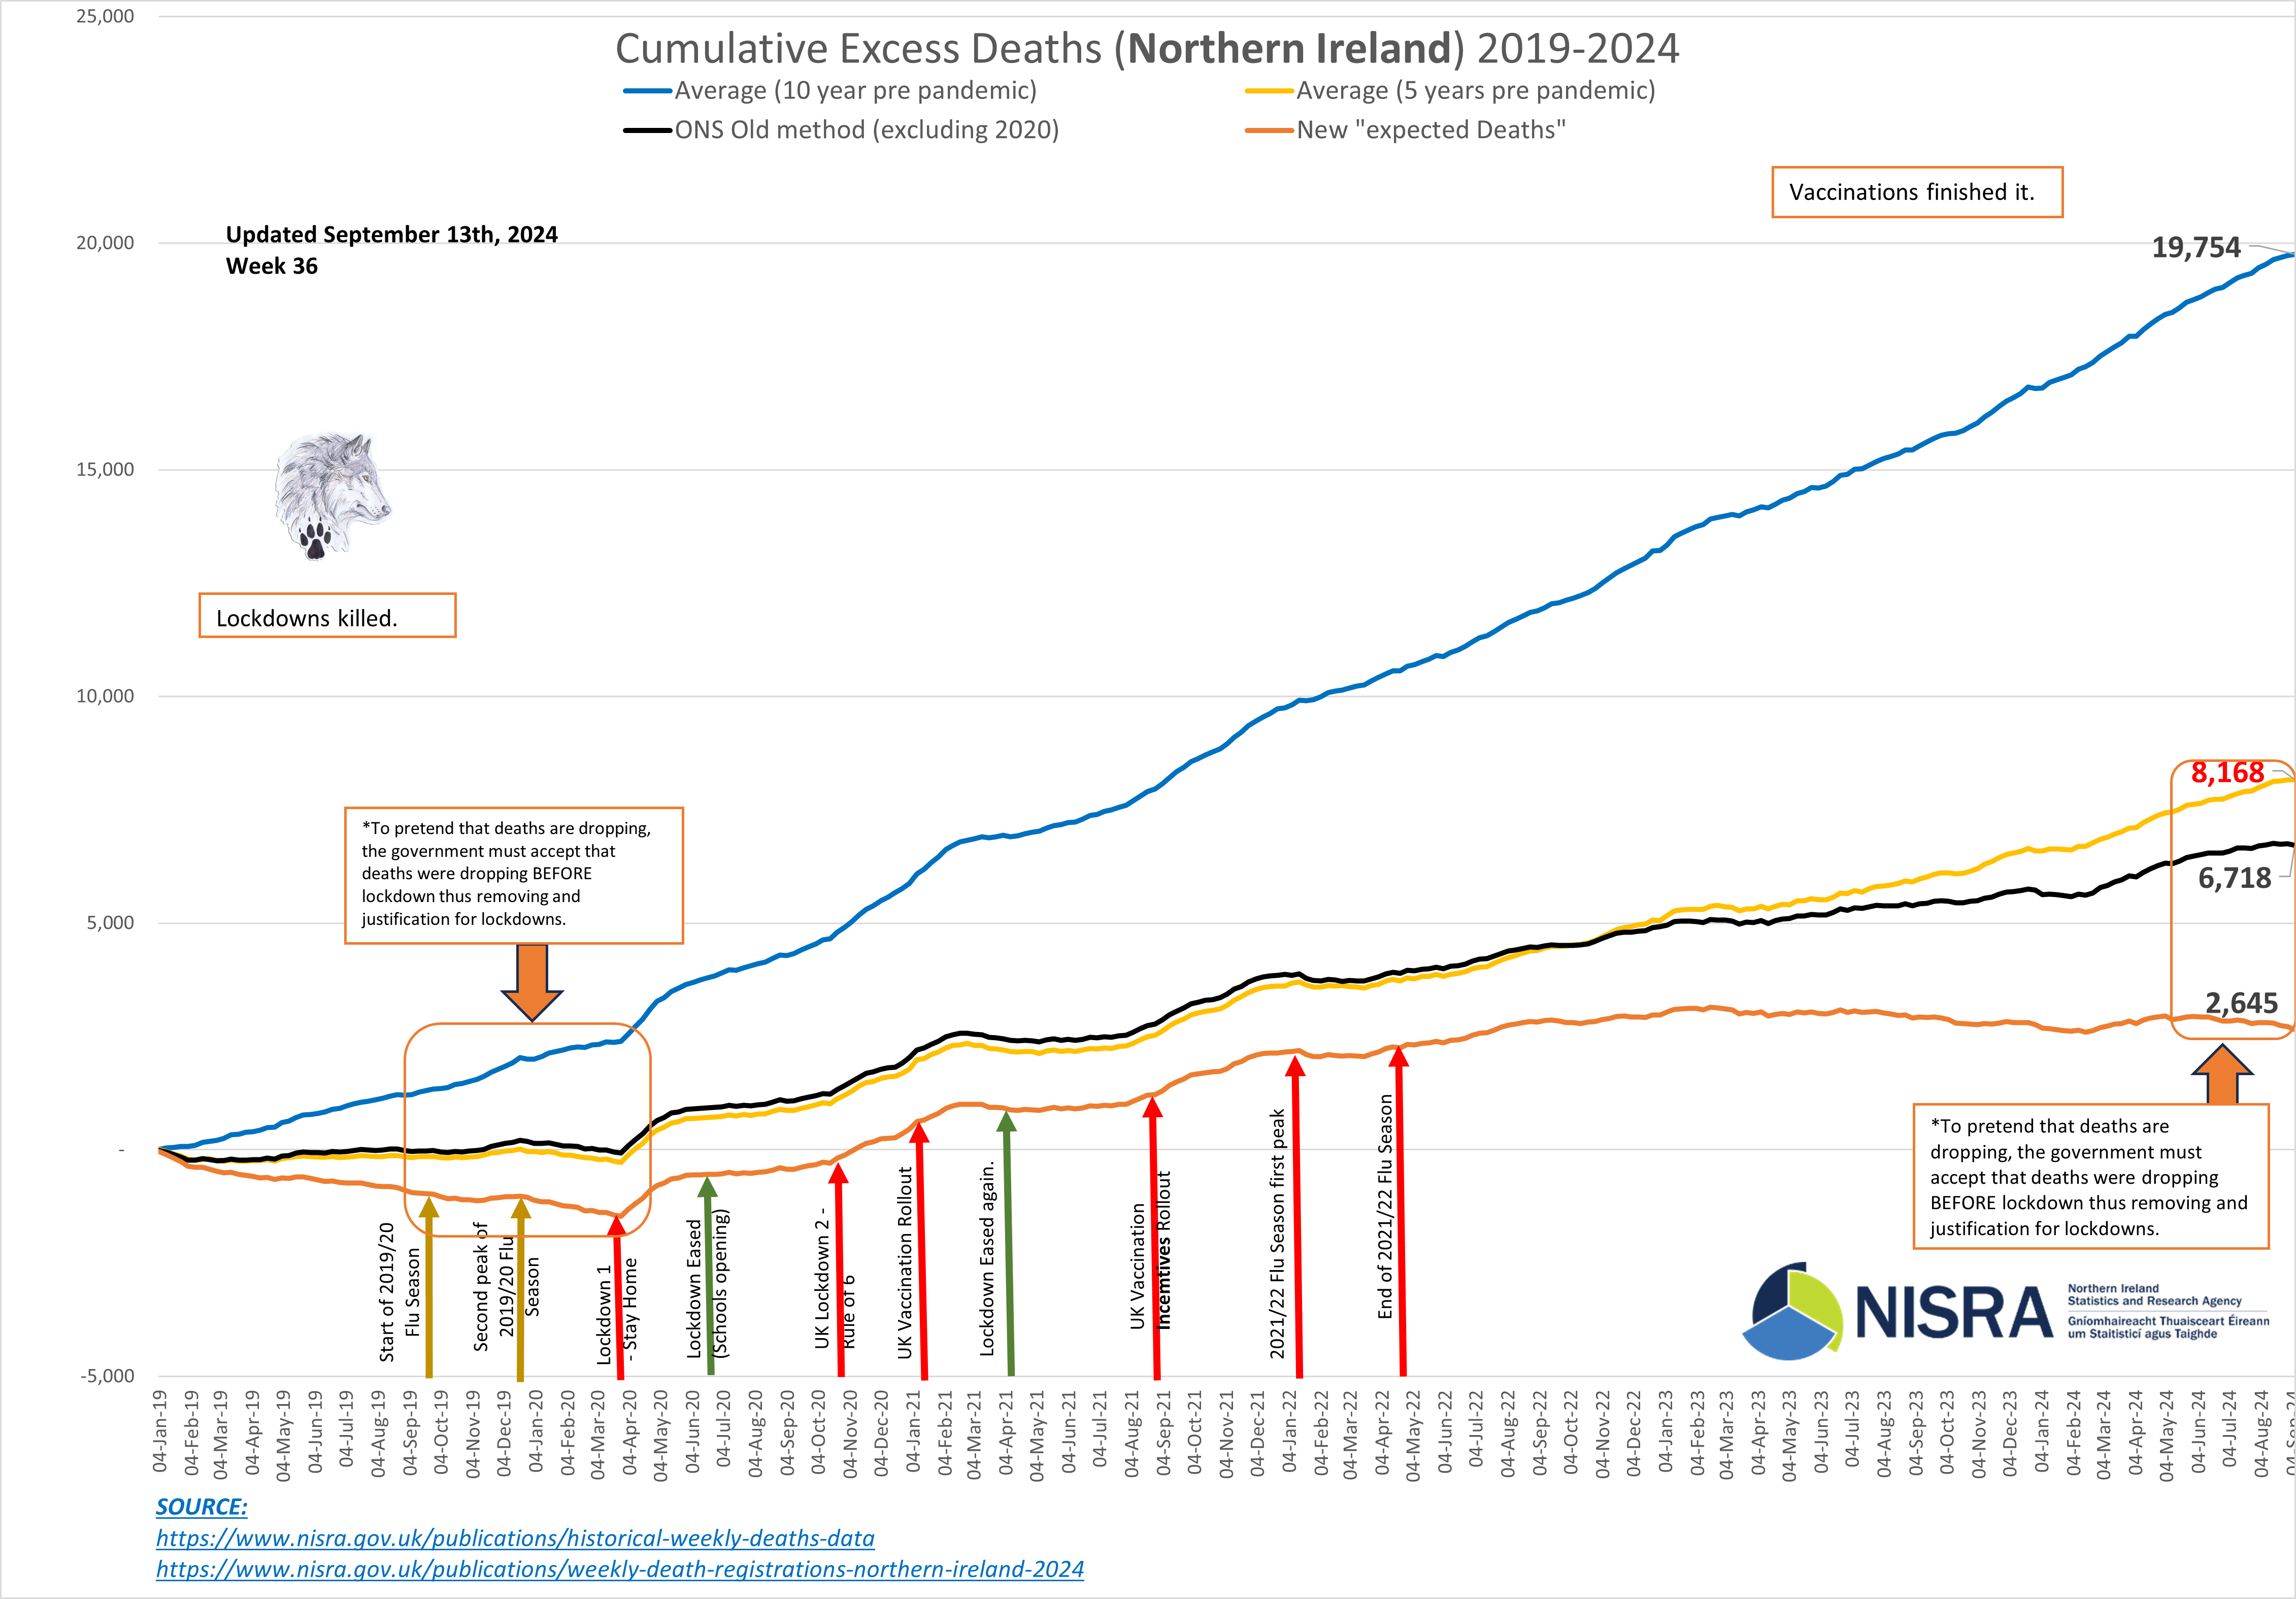 Northern Ireland Troubles vs. Excess Deaths 2020-2024.
In 53 YEARS (1969-2022) the "Troubles" took 3,500 lives.March 2020 to September 2024 (4.5 YEARS) Avoidable (Excess) deaths.
ONS 'Newspeak': 4,115.
ONS old calculation: 6,787.
5-yr avg: 7,888.
10-yr avg: 17,359.
WHERE IS THE OUTRAGE NOW?

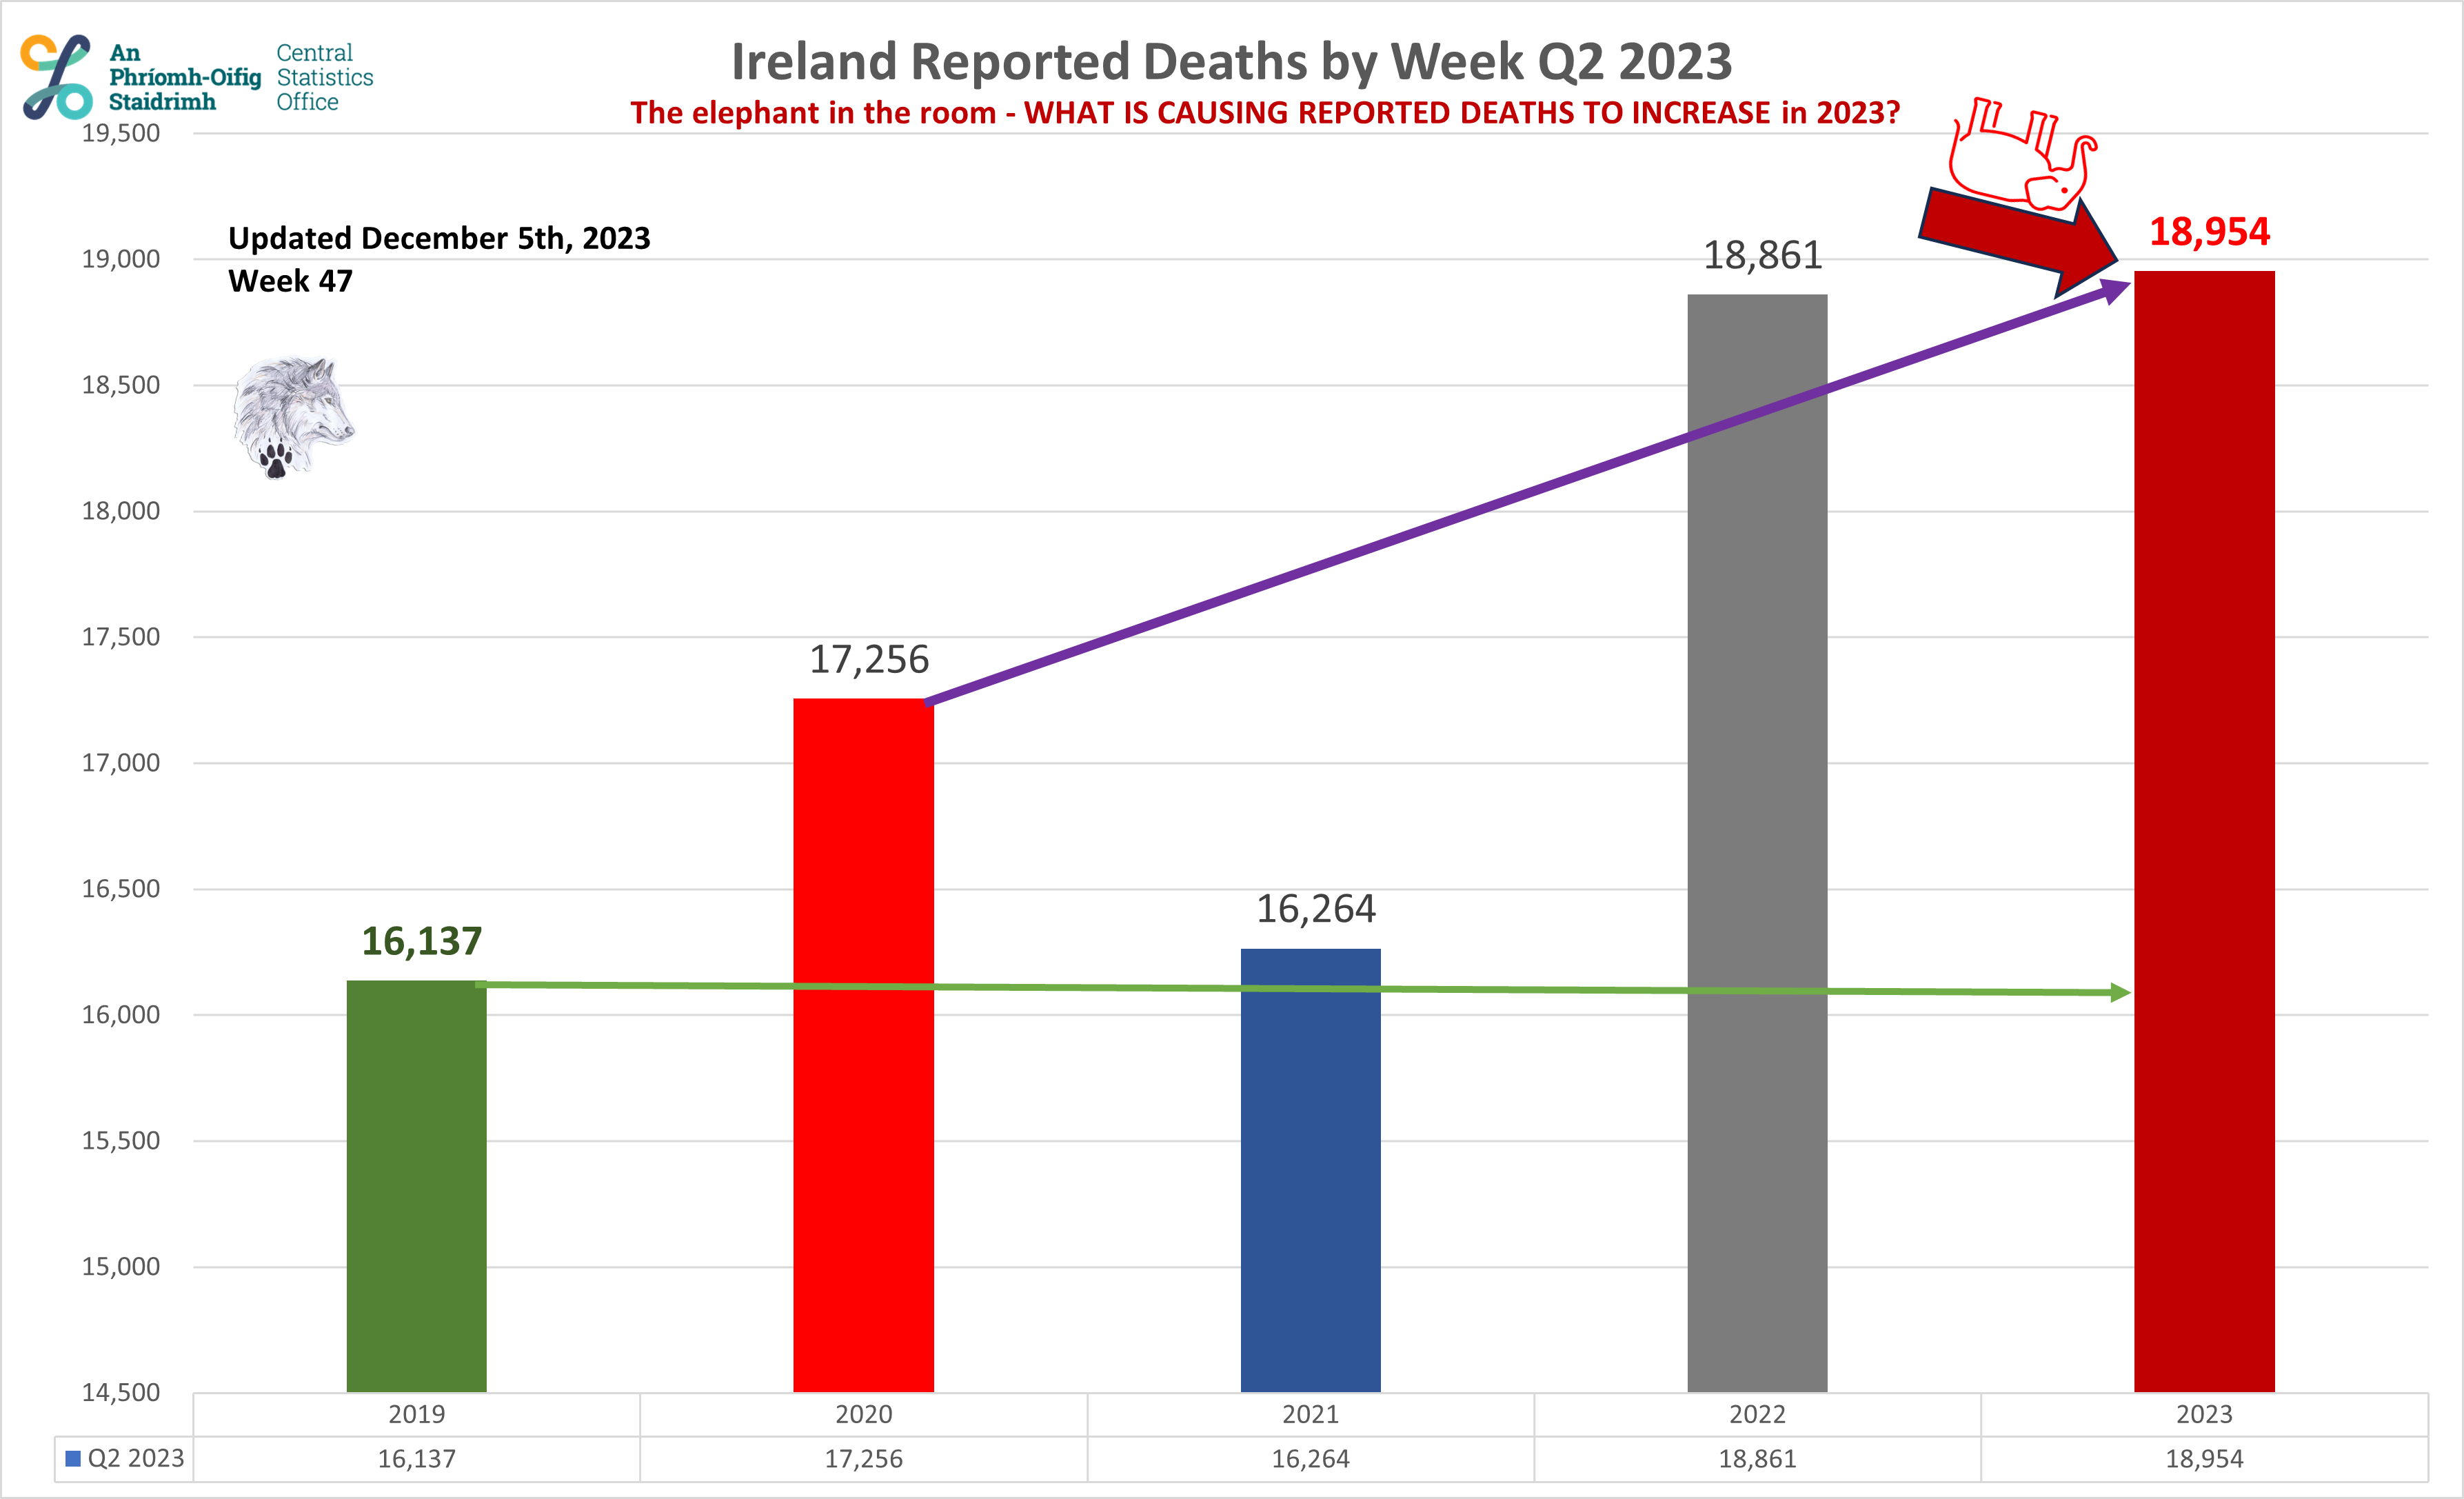
Ireland - June 20th, 2023.
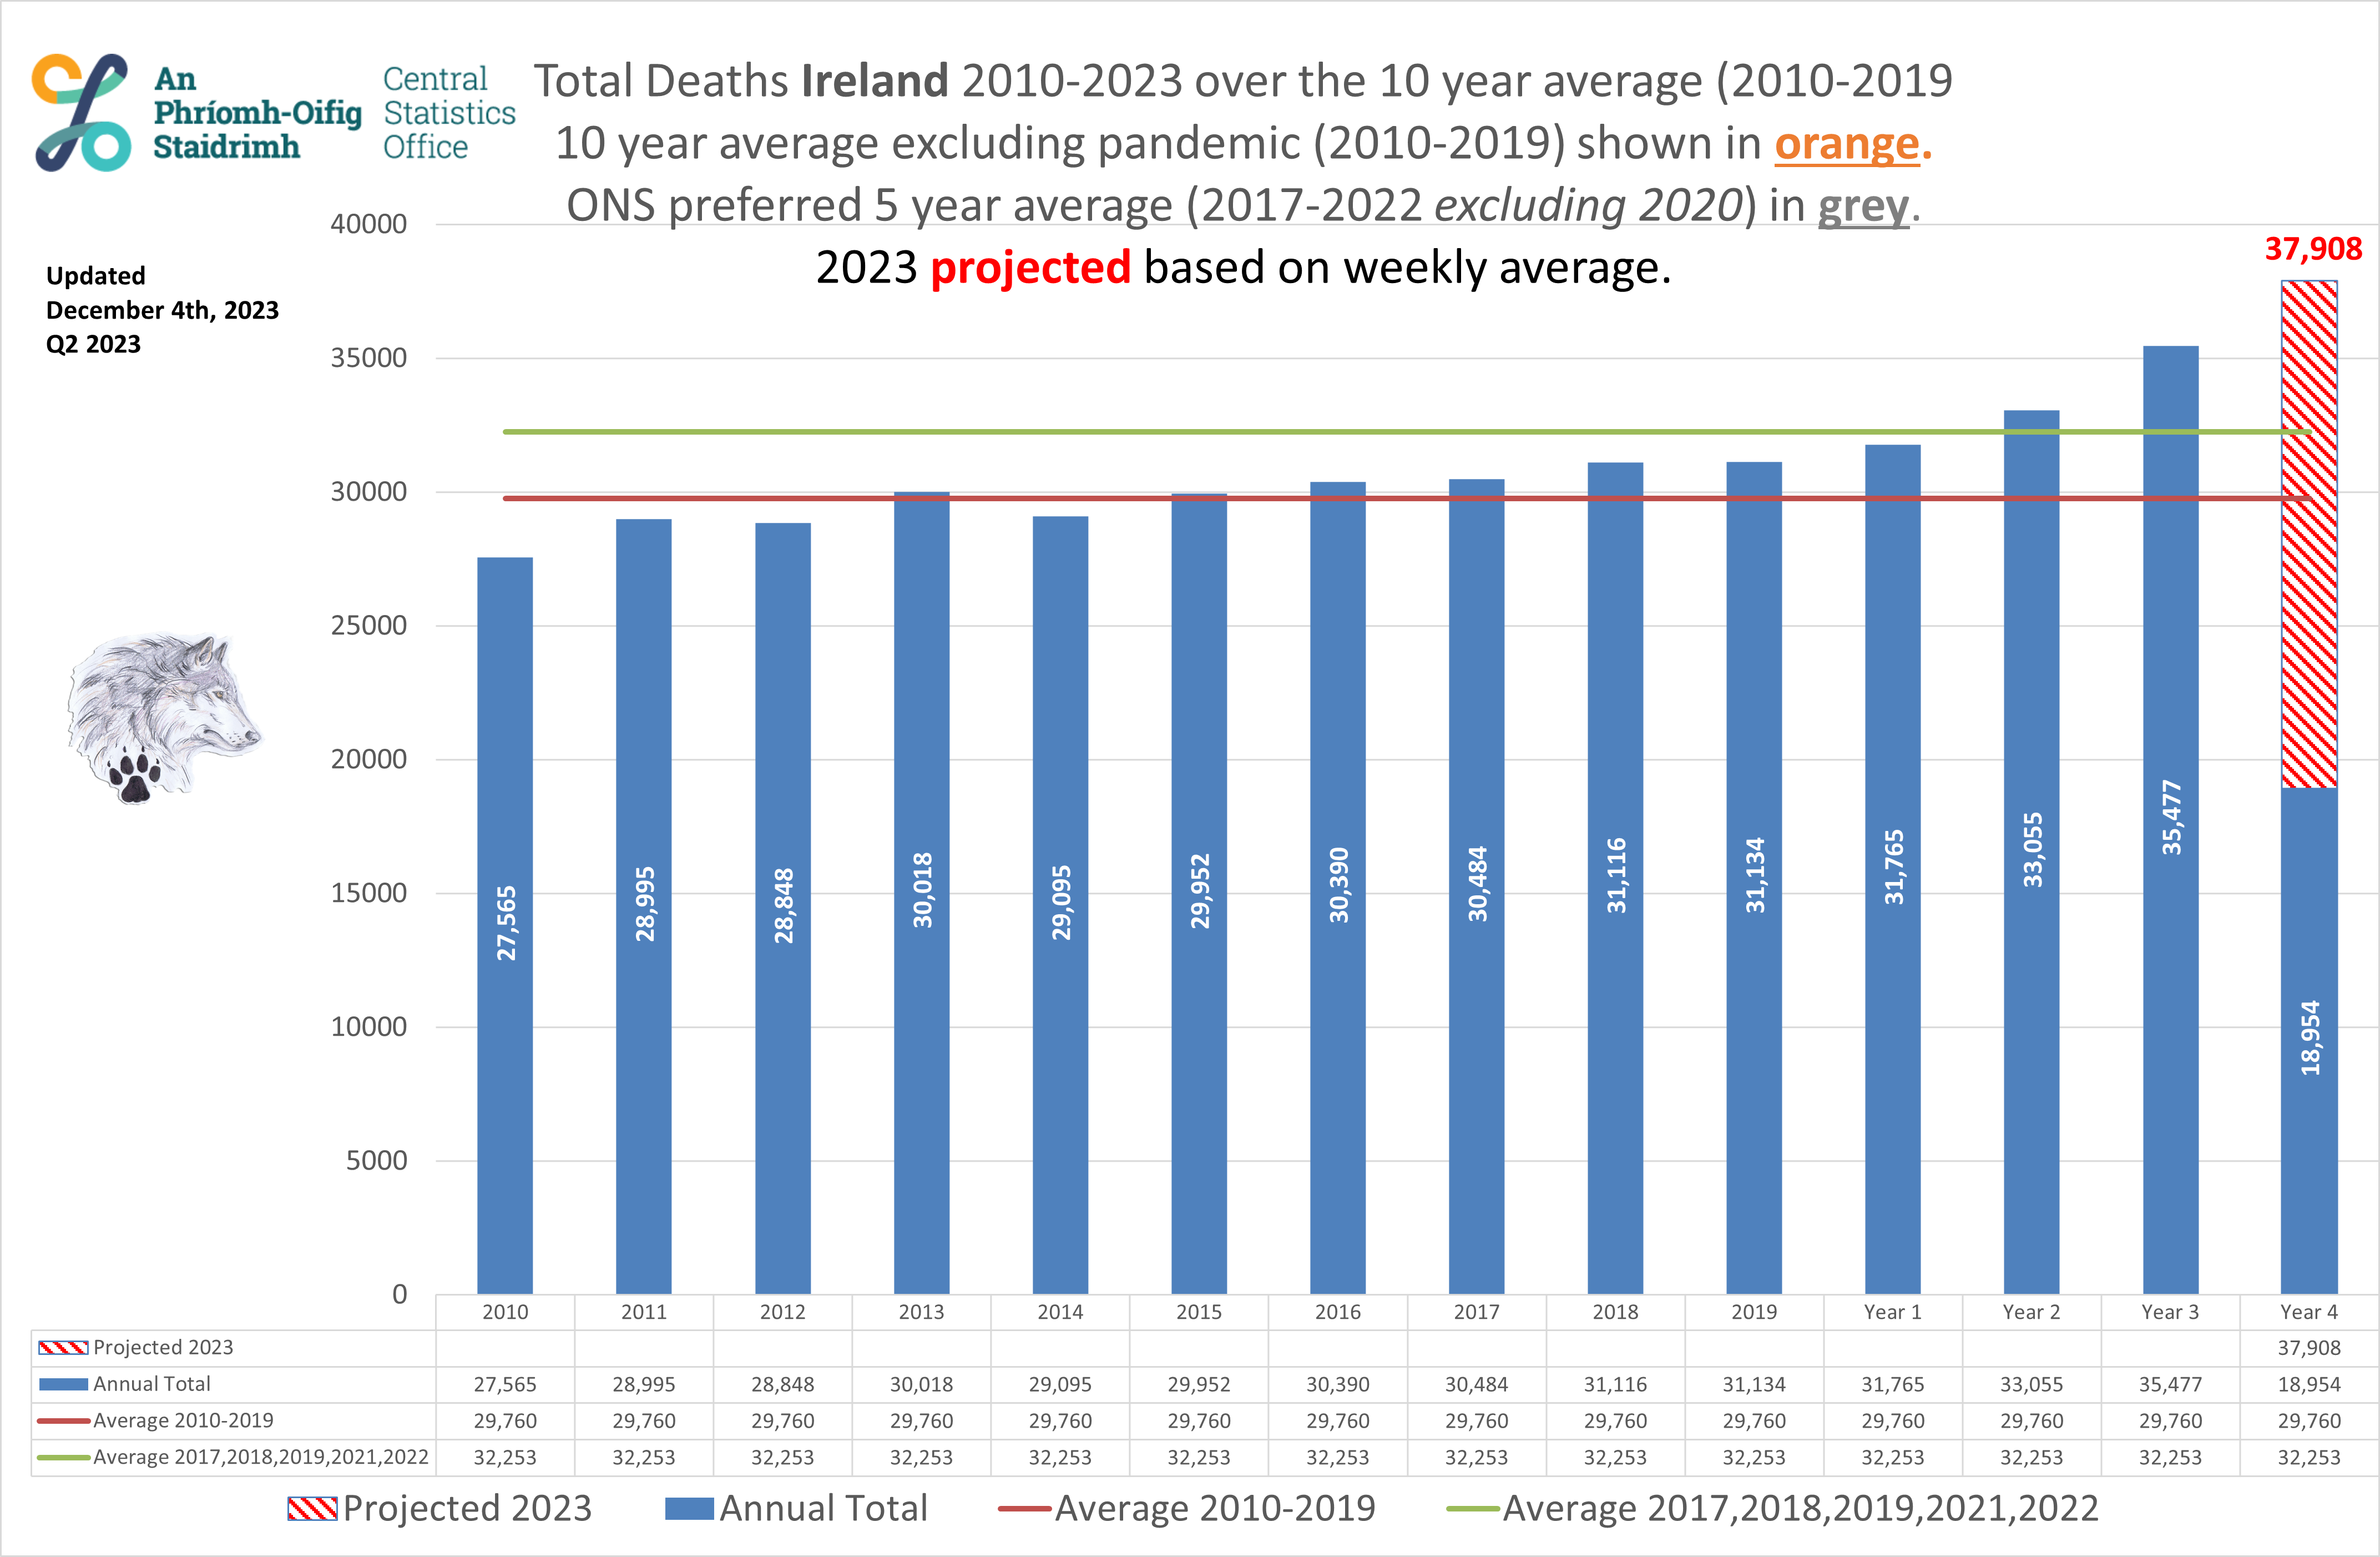
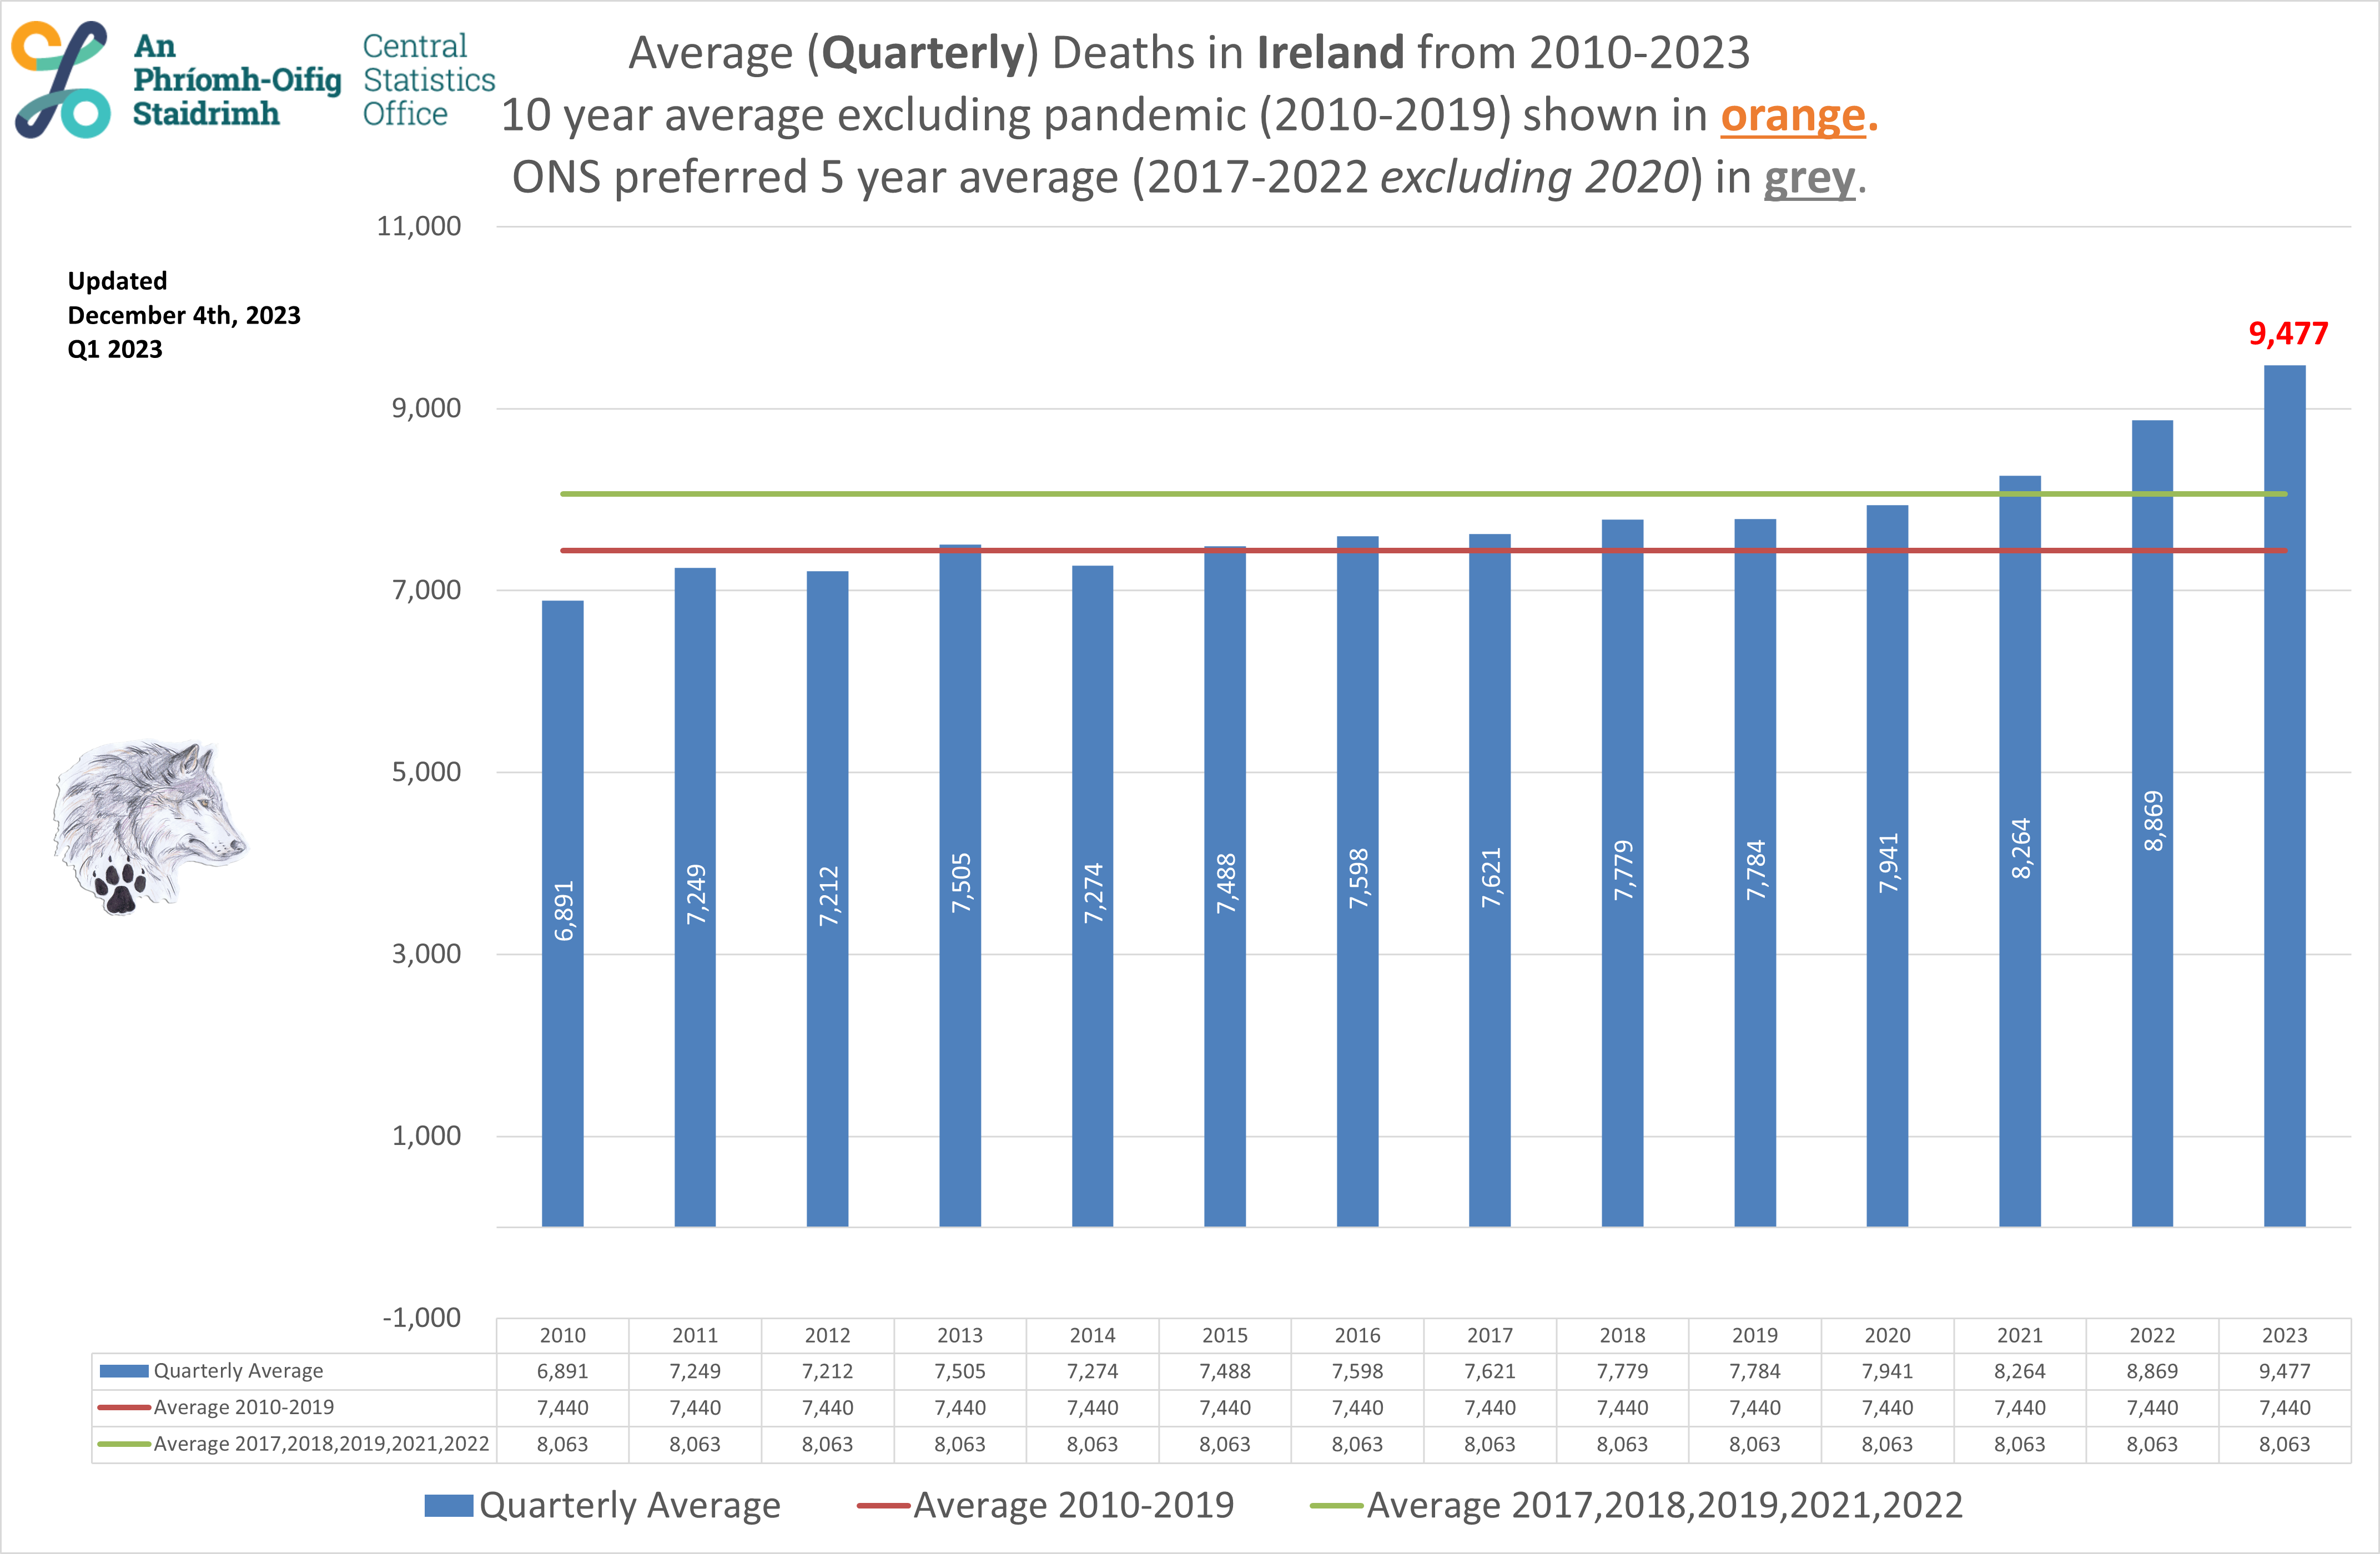
2022 and 2023 are the worst ever for Ireland with 5,717 and 5,699 Excess Deaths OVER the 10-year pre-pandemic average, more than double per year compared to 2020.
Ireland's Excess Deaths (since 2020) now stand at 16,717 based on the 10-year pre-pandemic average.
 back to top of page
THIS SECTION IS CURRENTLY BEING UPDATED
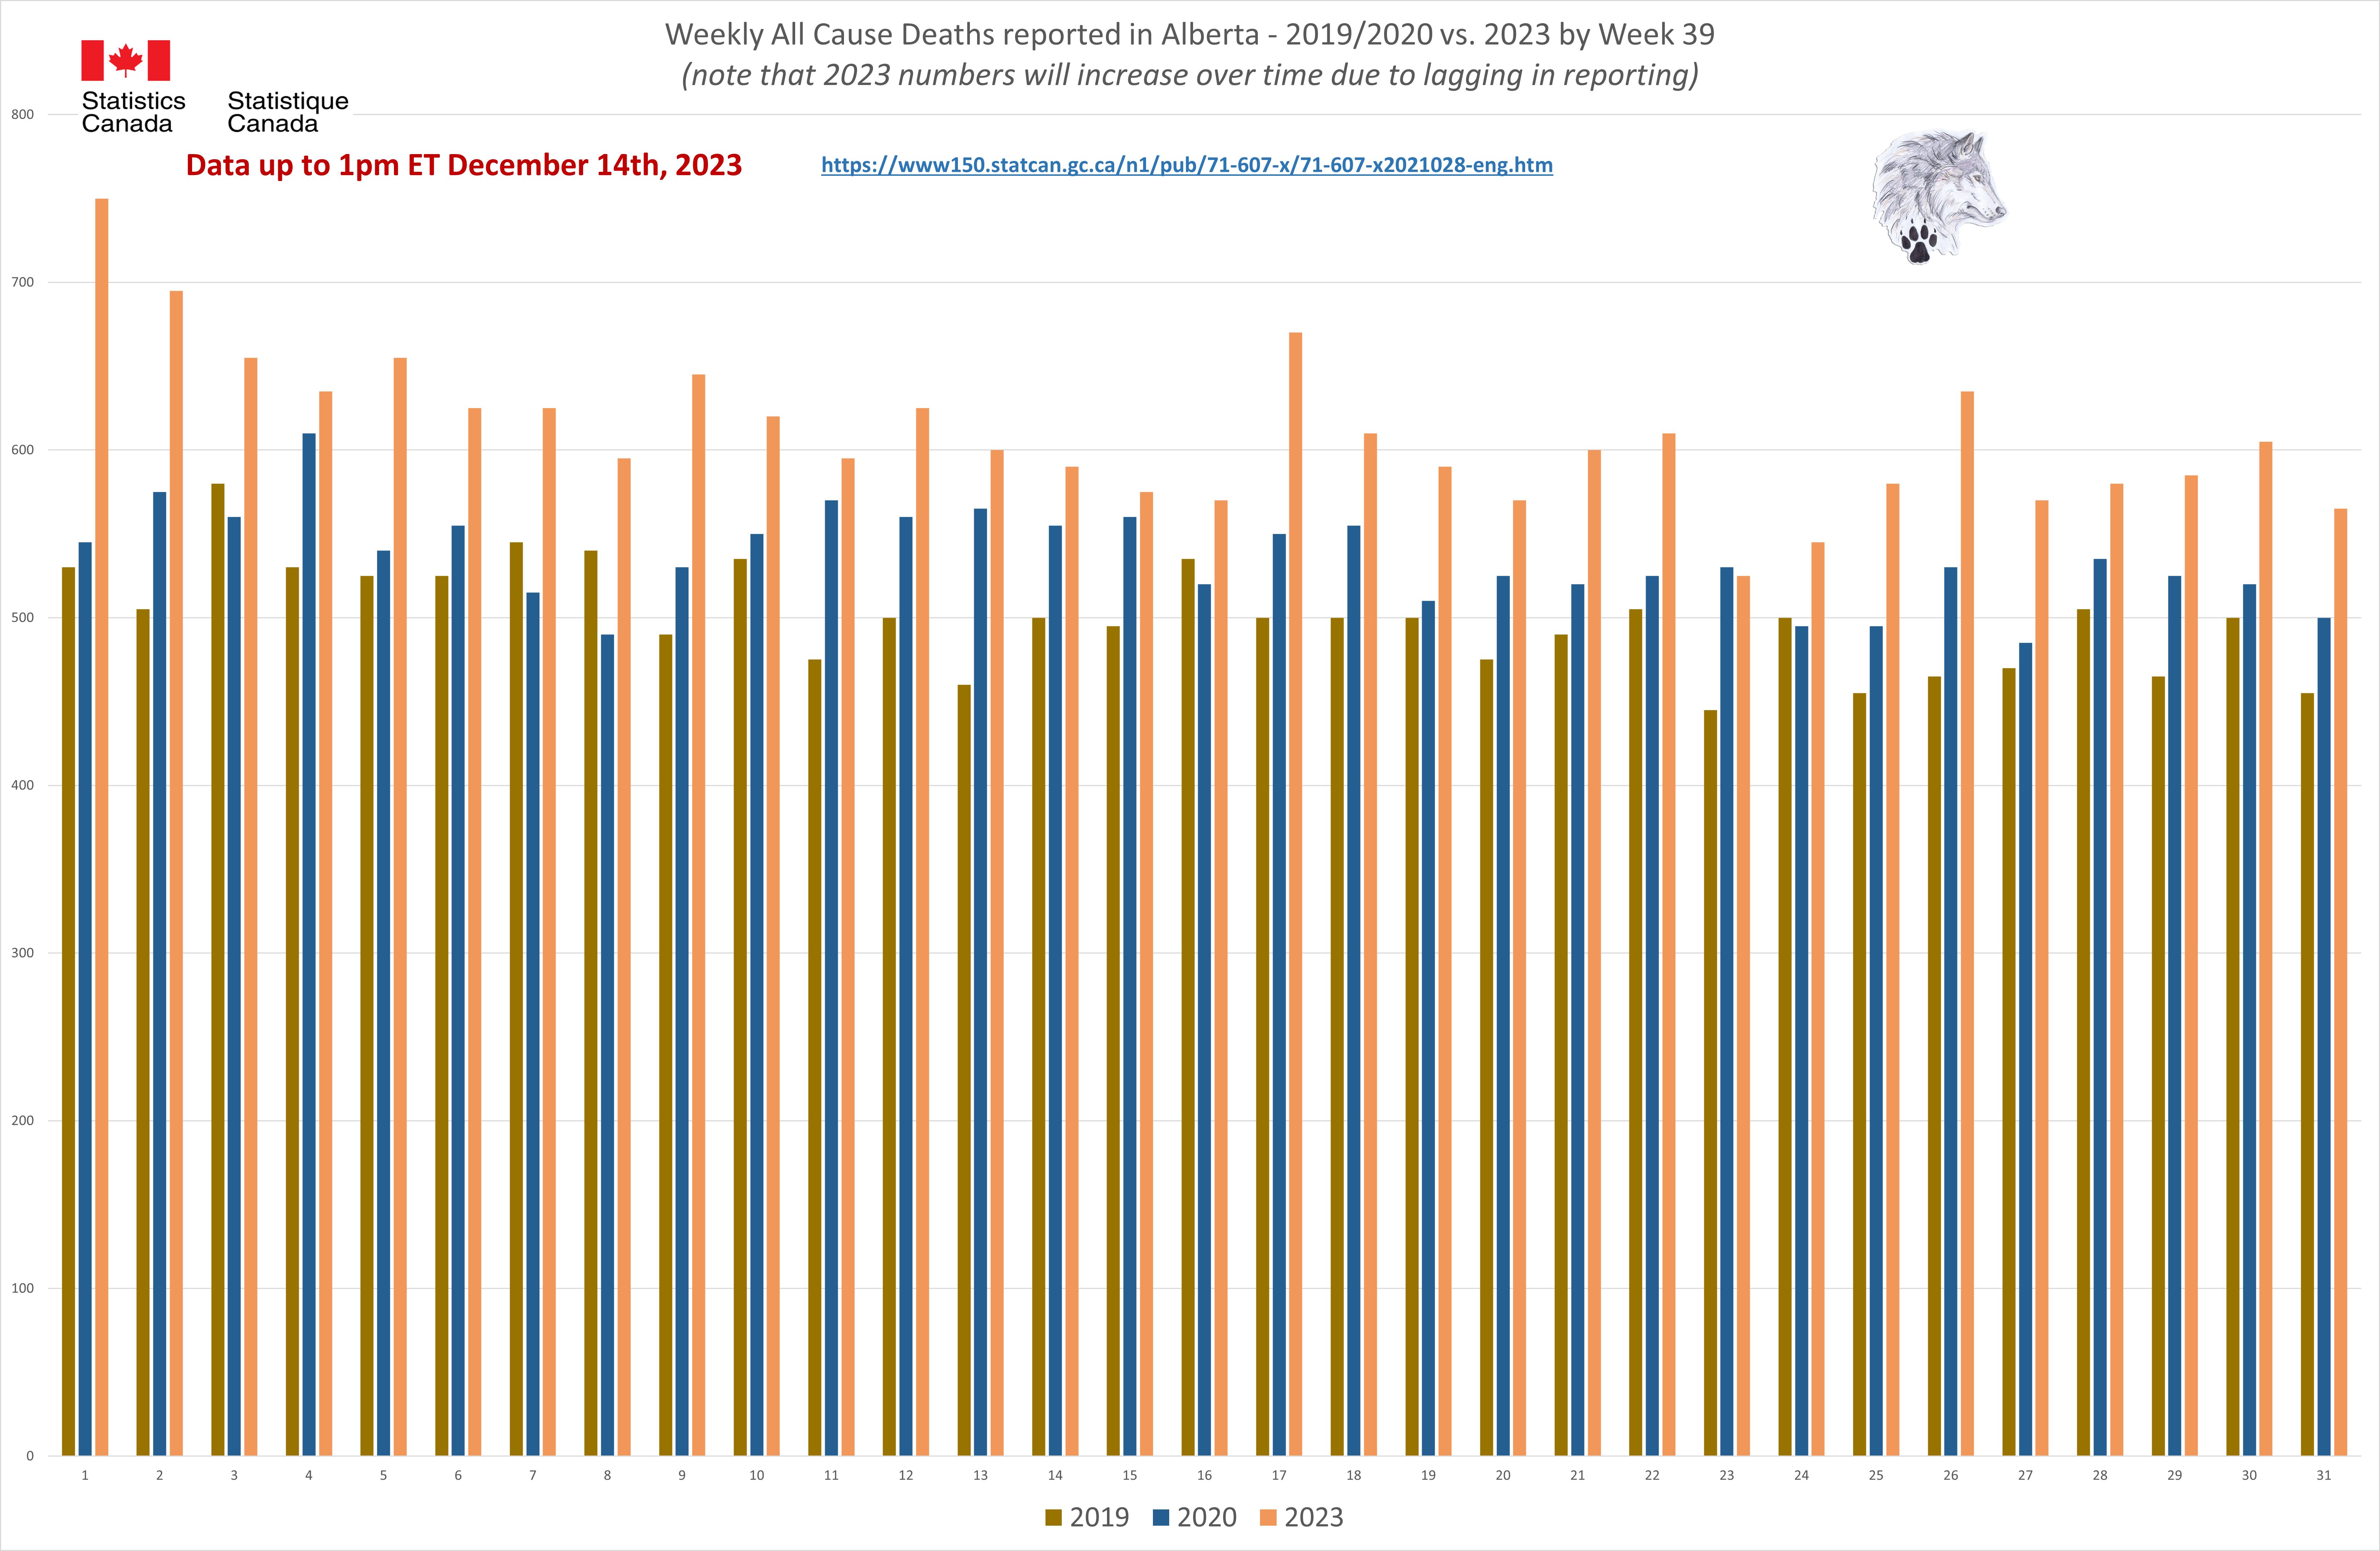
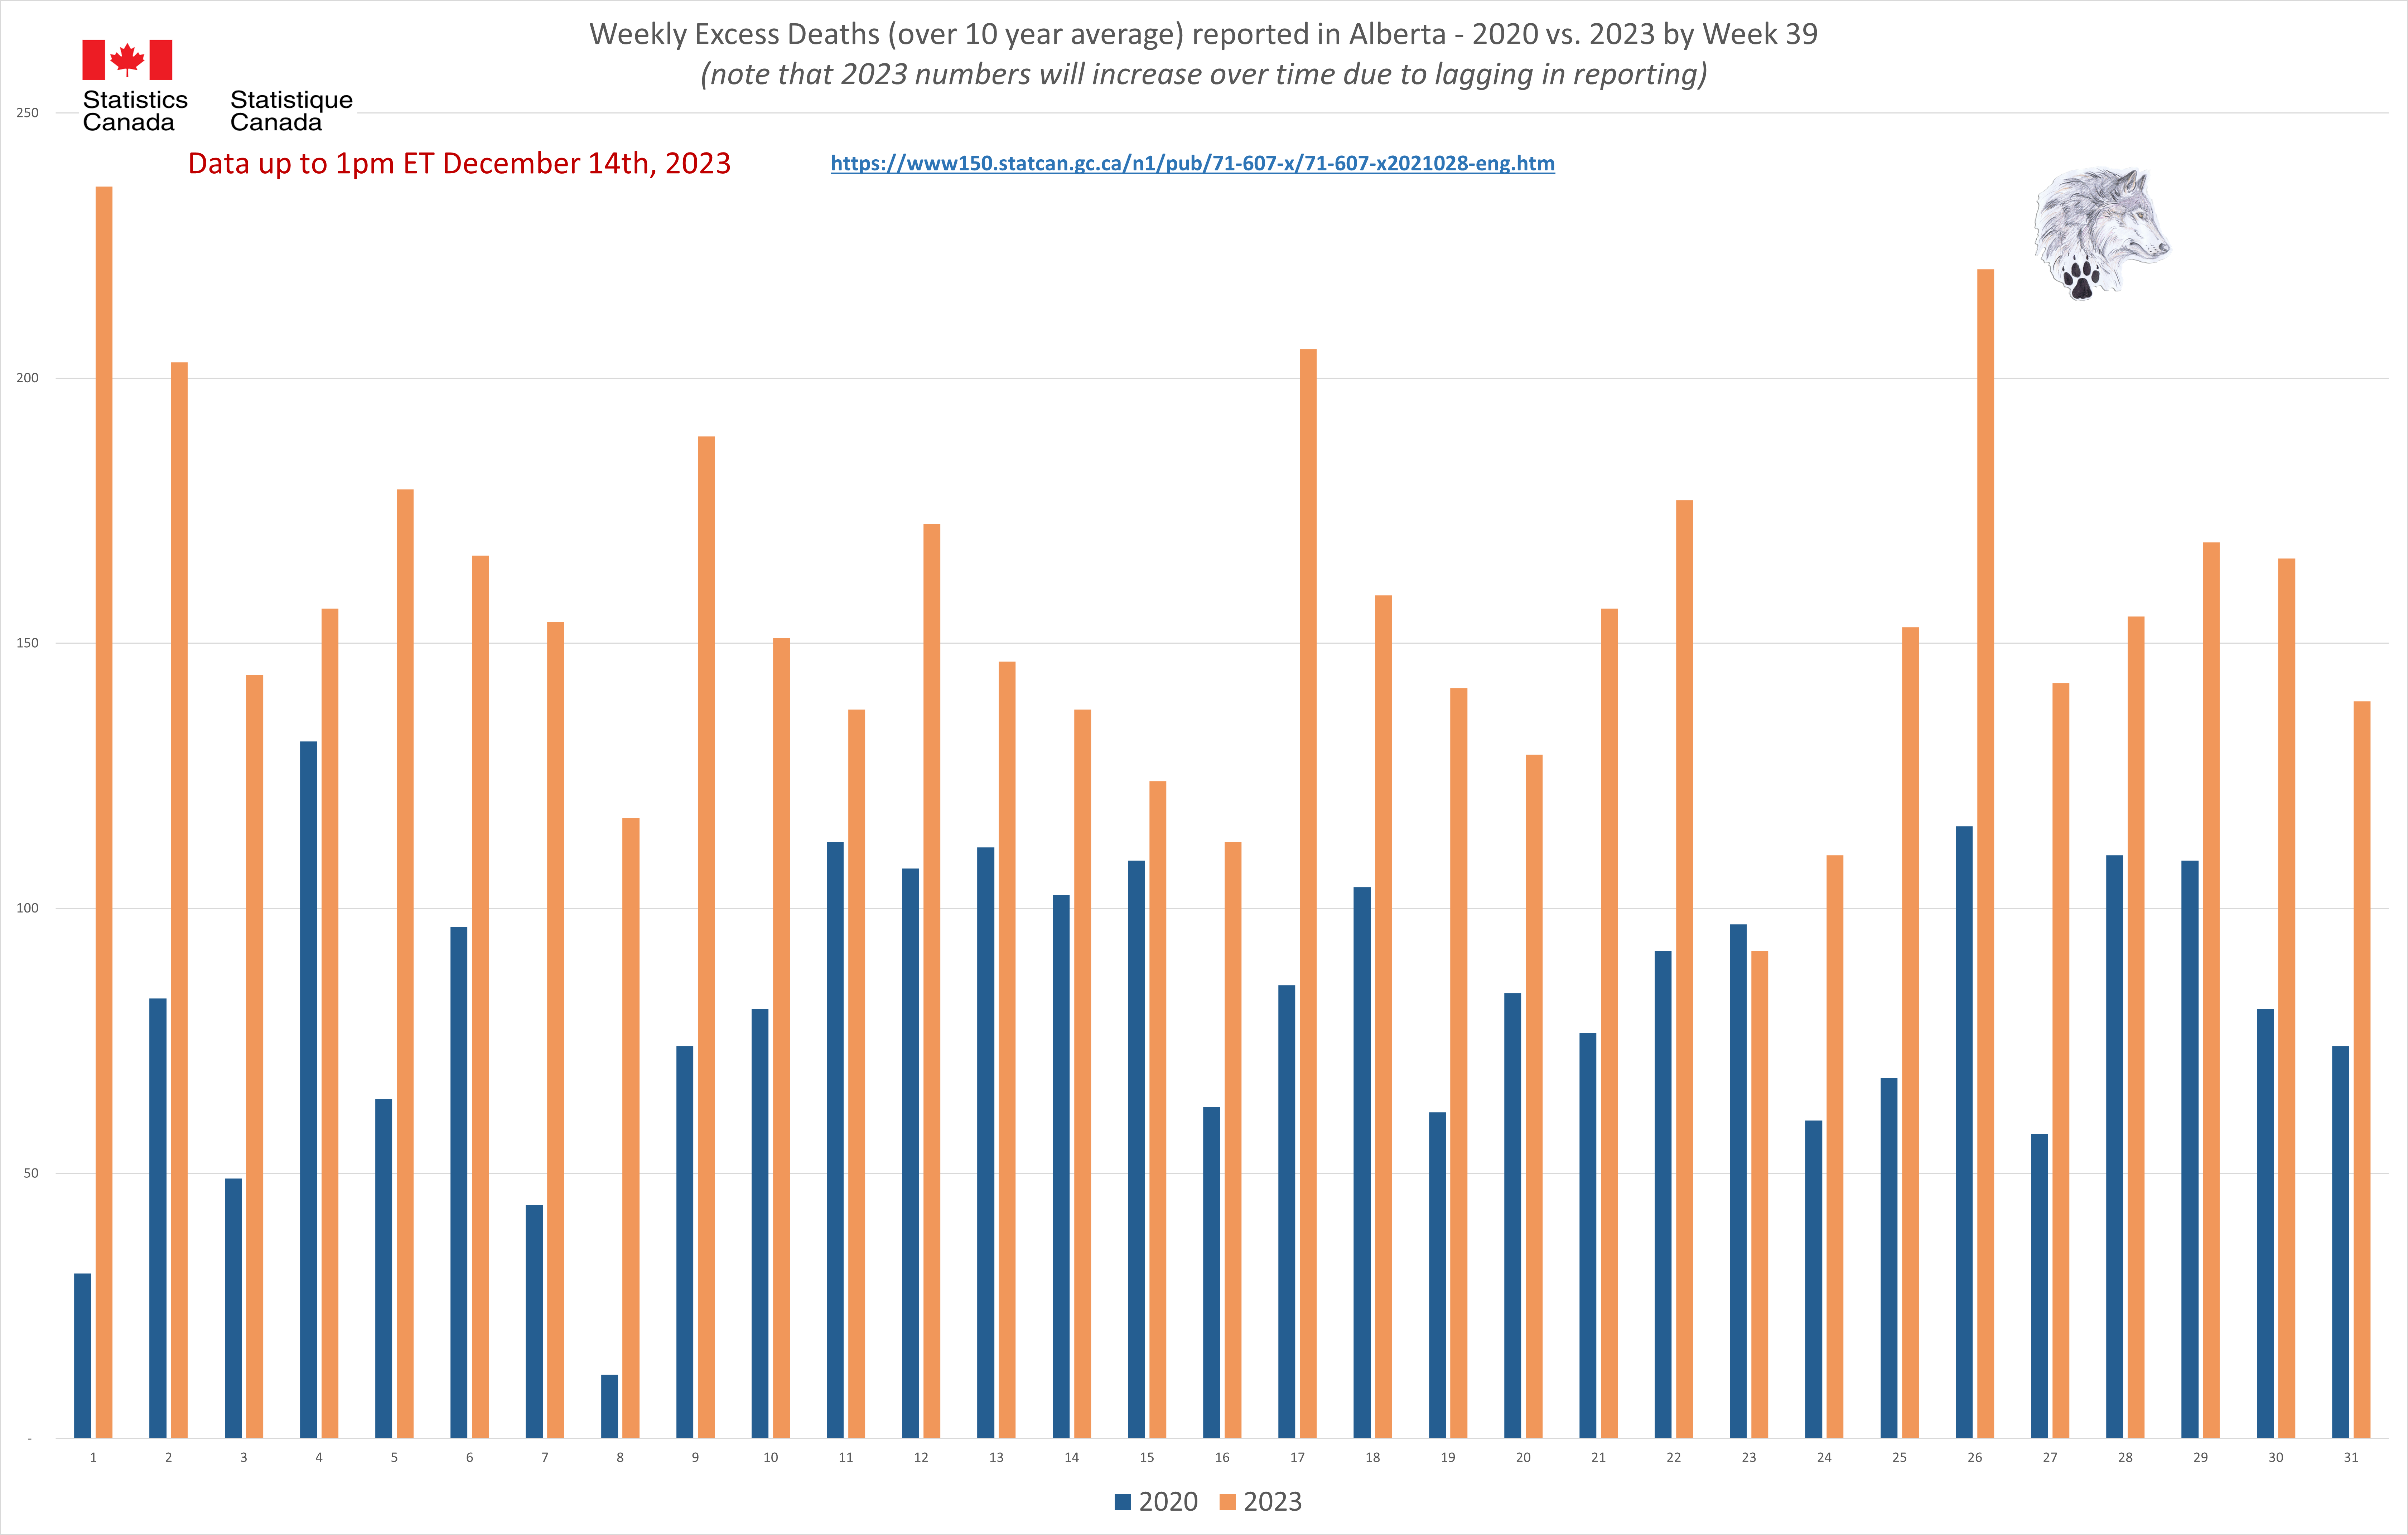
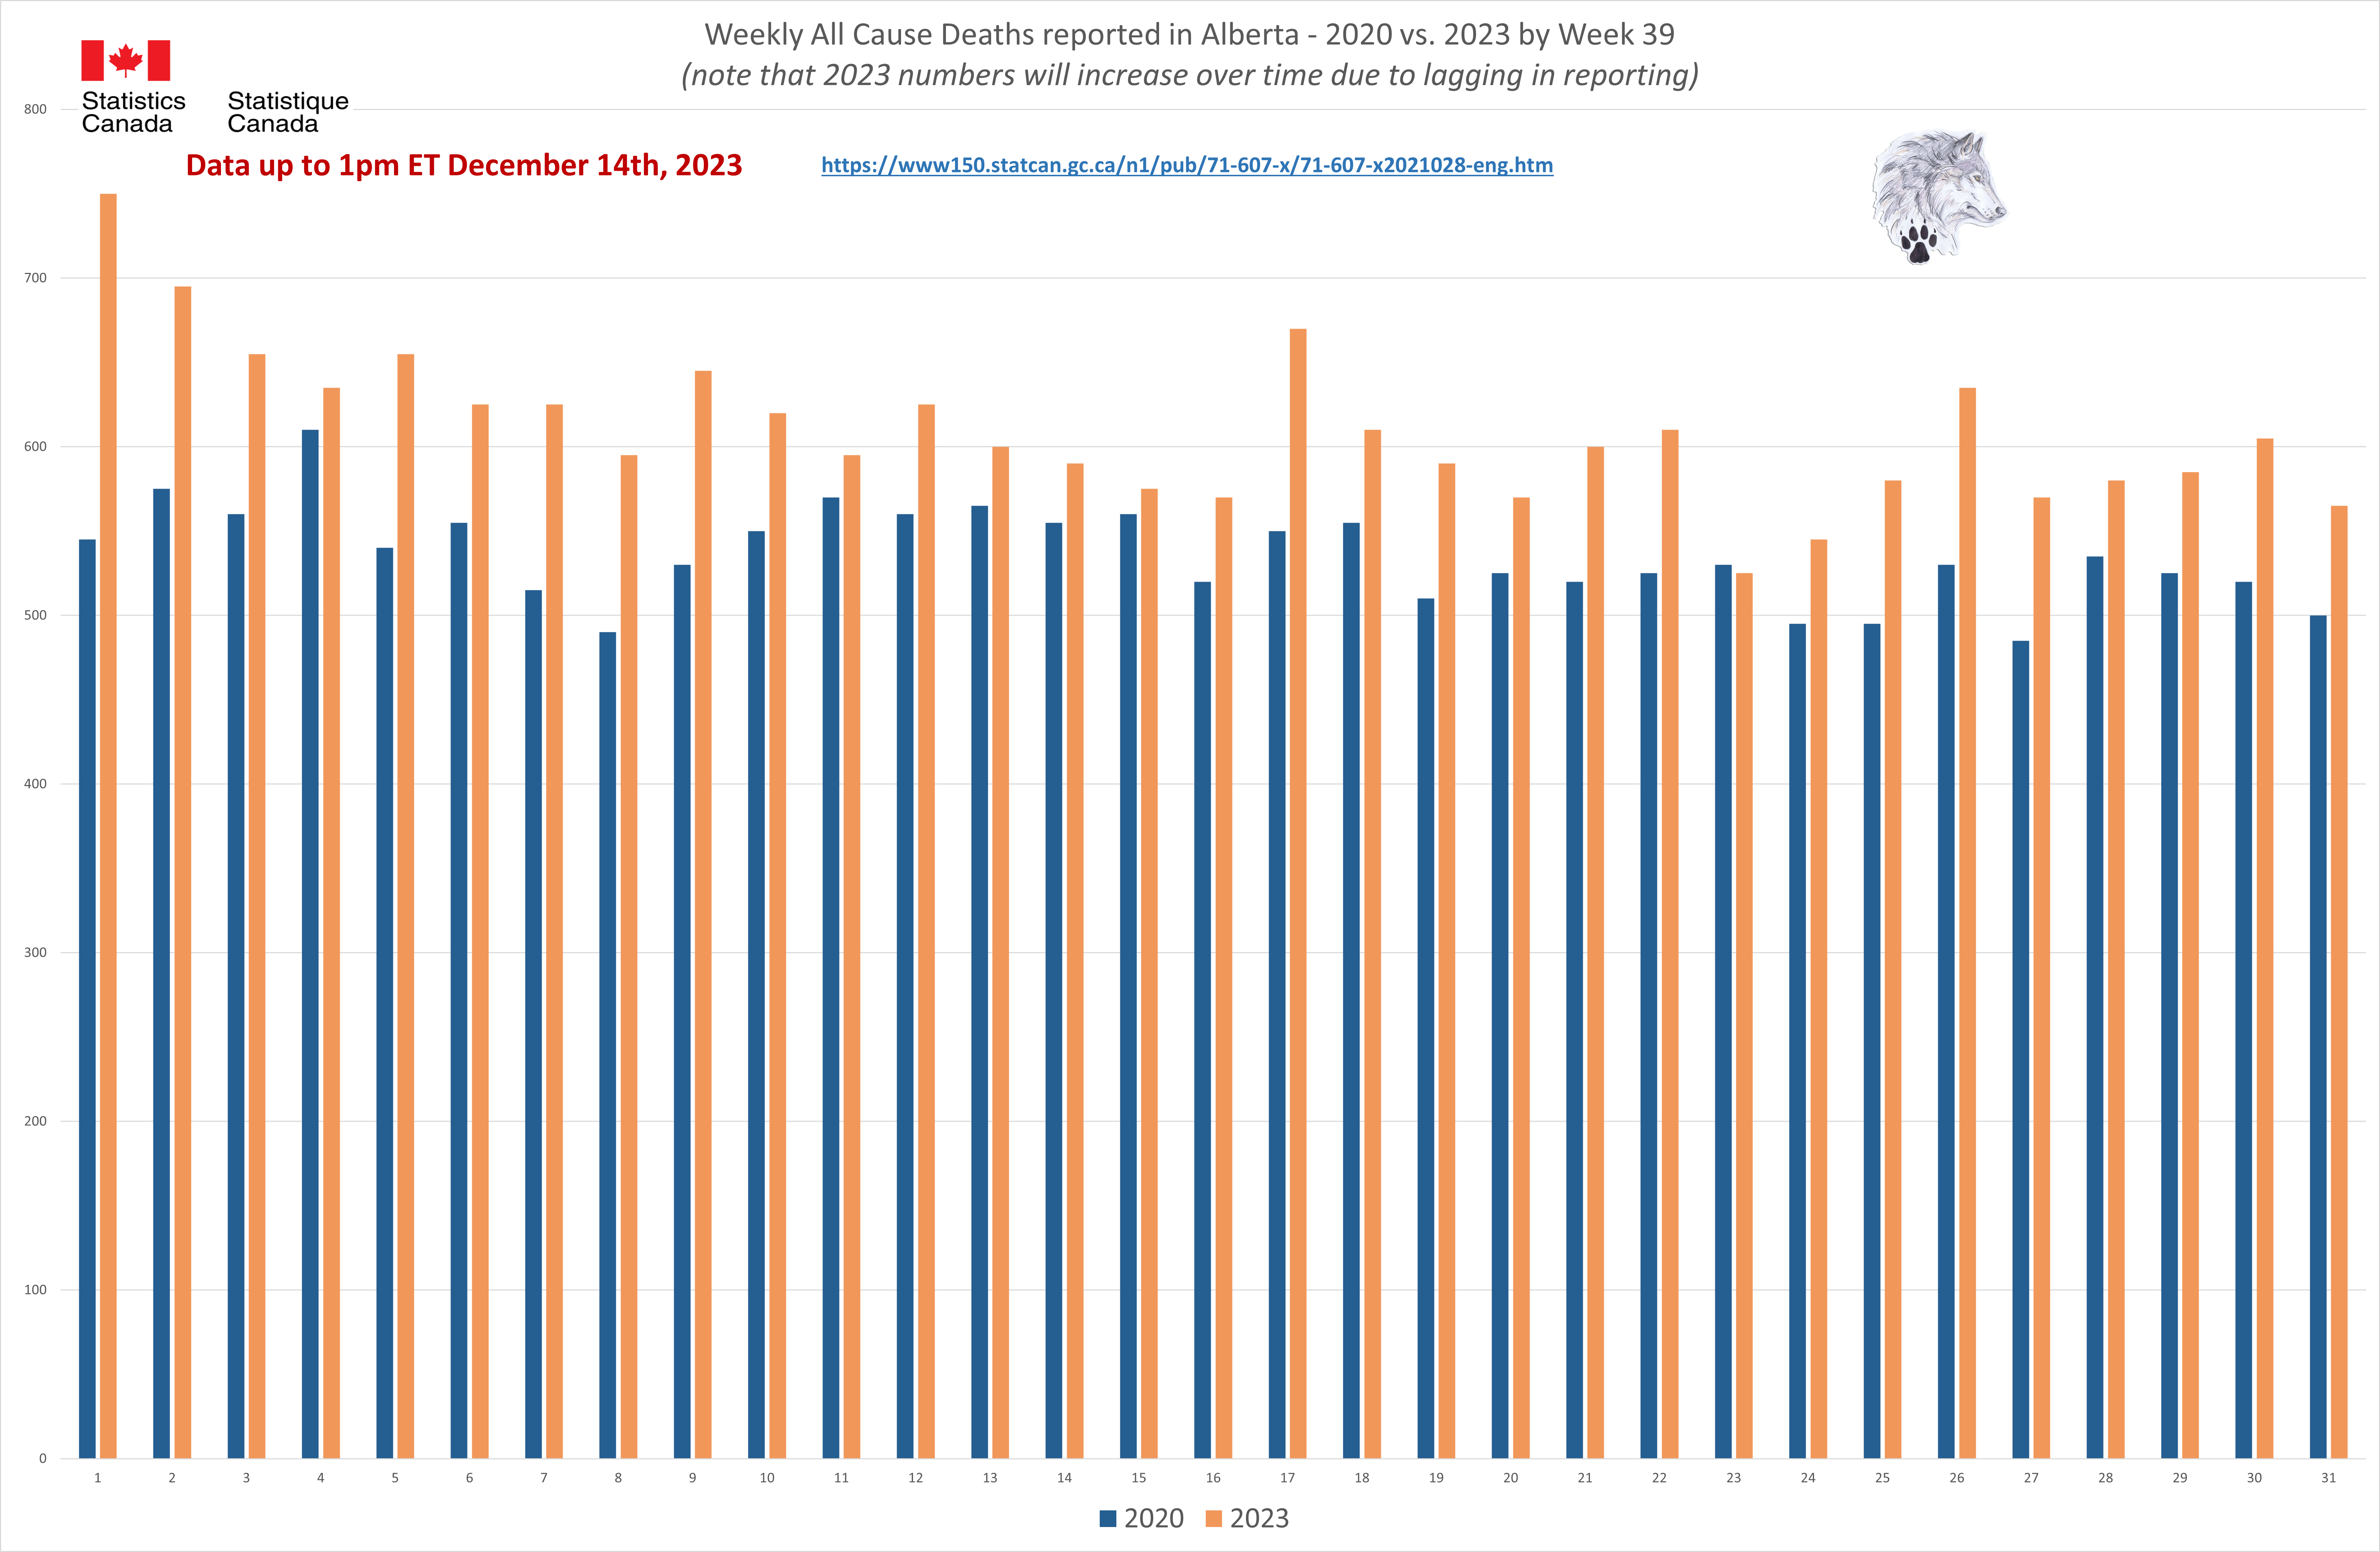
Alberta - All Cause Deaths 2020 vs. 2023
Alberta - Population 4.3 million
1,470 more deaths were reported in the first
39 weeks of 2020 than in 2019. However, we have
4,295 more deaths reported in the comparable period in 2023.
NEARLY THREE times as many people died and not a word from anyone in authority.
All Cause deaths in 2023 are
HIGHER in
EVERY month than the reported 2020 numbers. This is even more disturbing as the 2023 numbers are still being reported and will be adjusted up as the months go on.
Why do we not see the big
RED FEAR mongering circles and numbers reported every day now as we did in 2020?
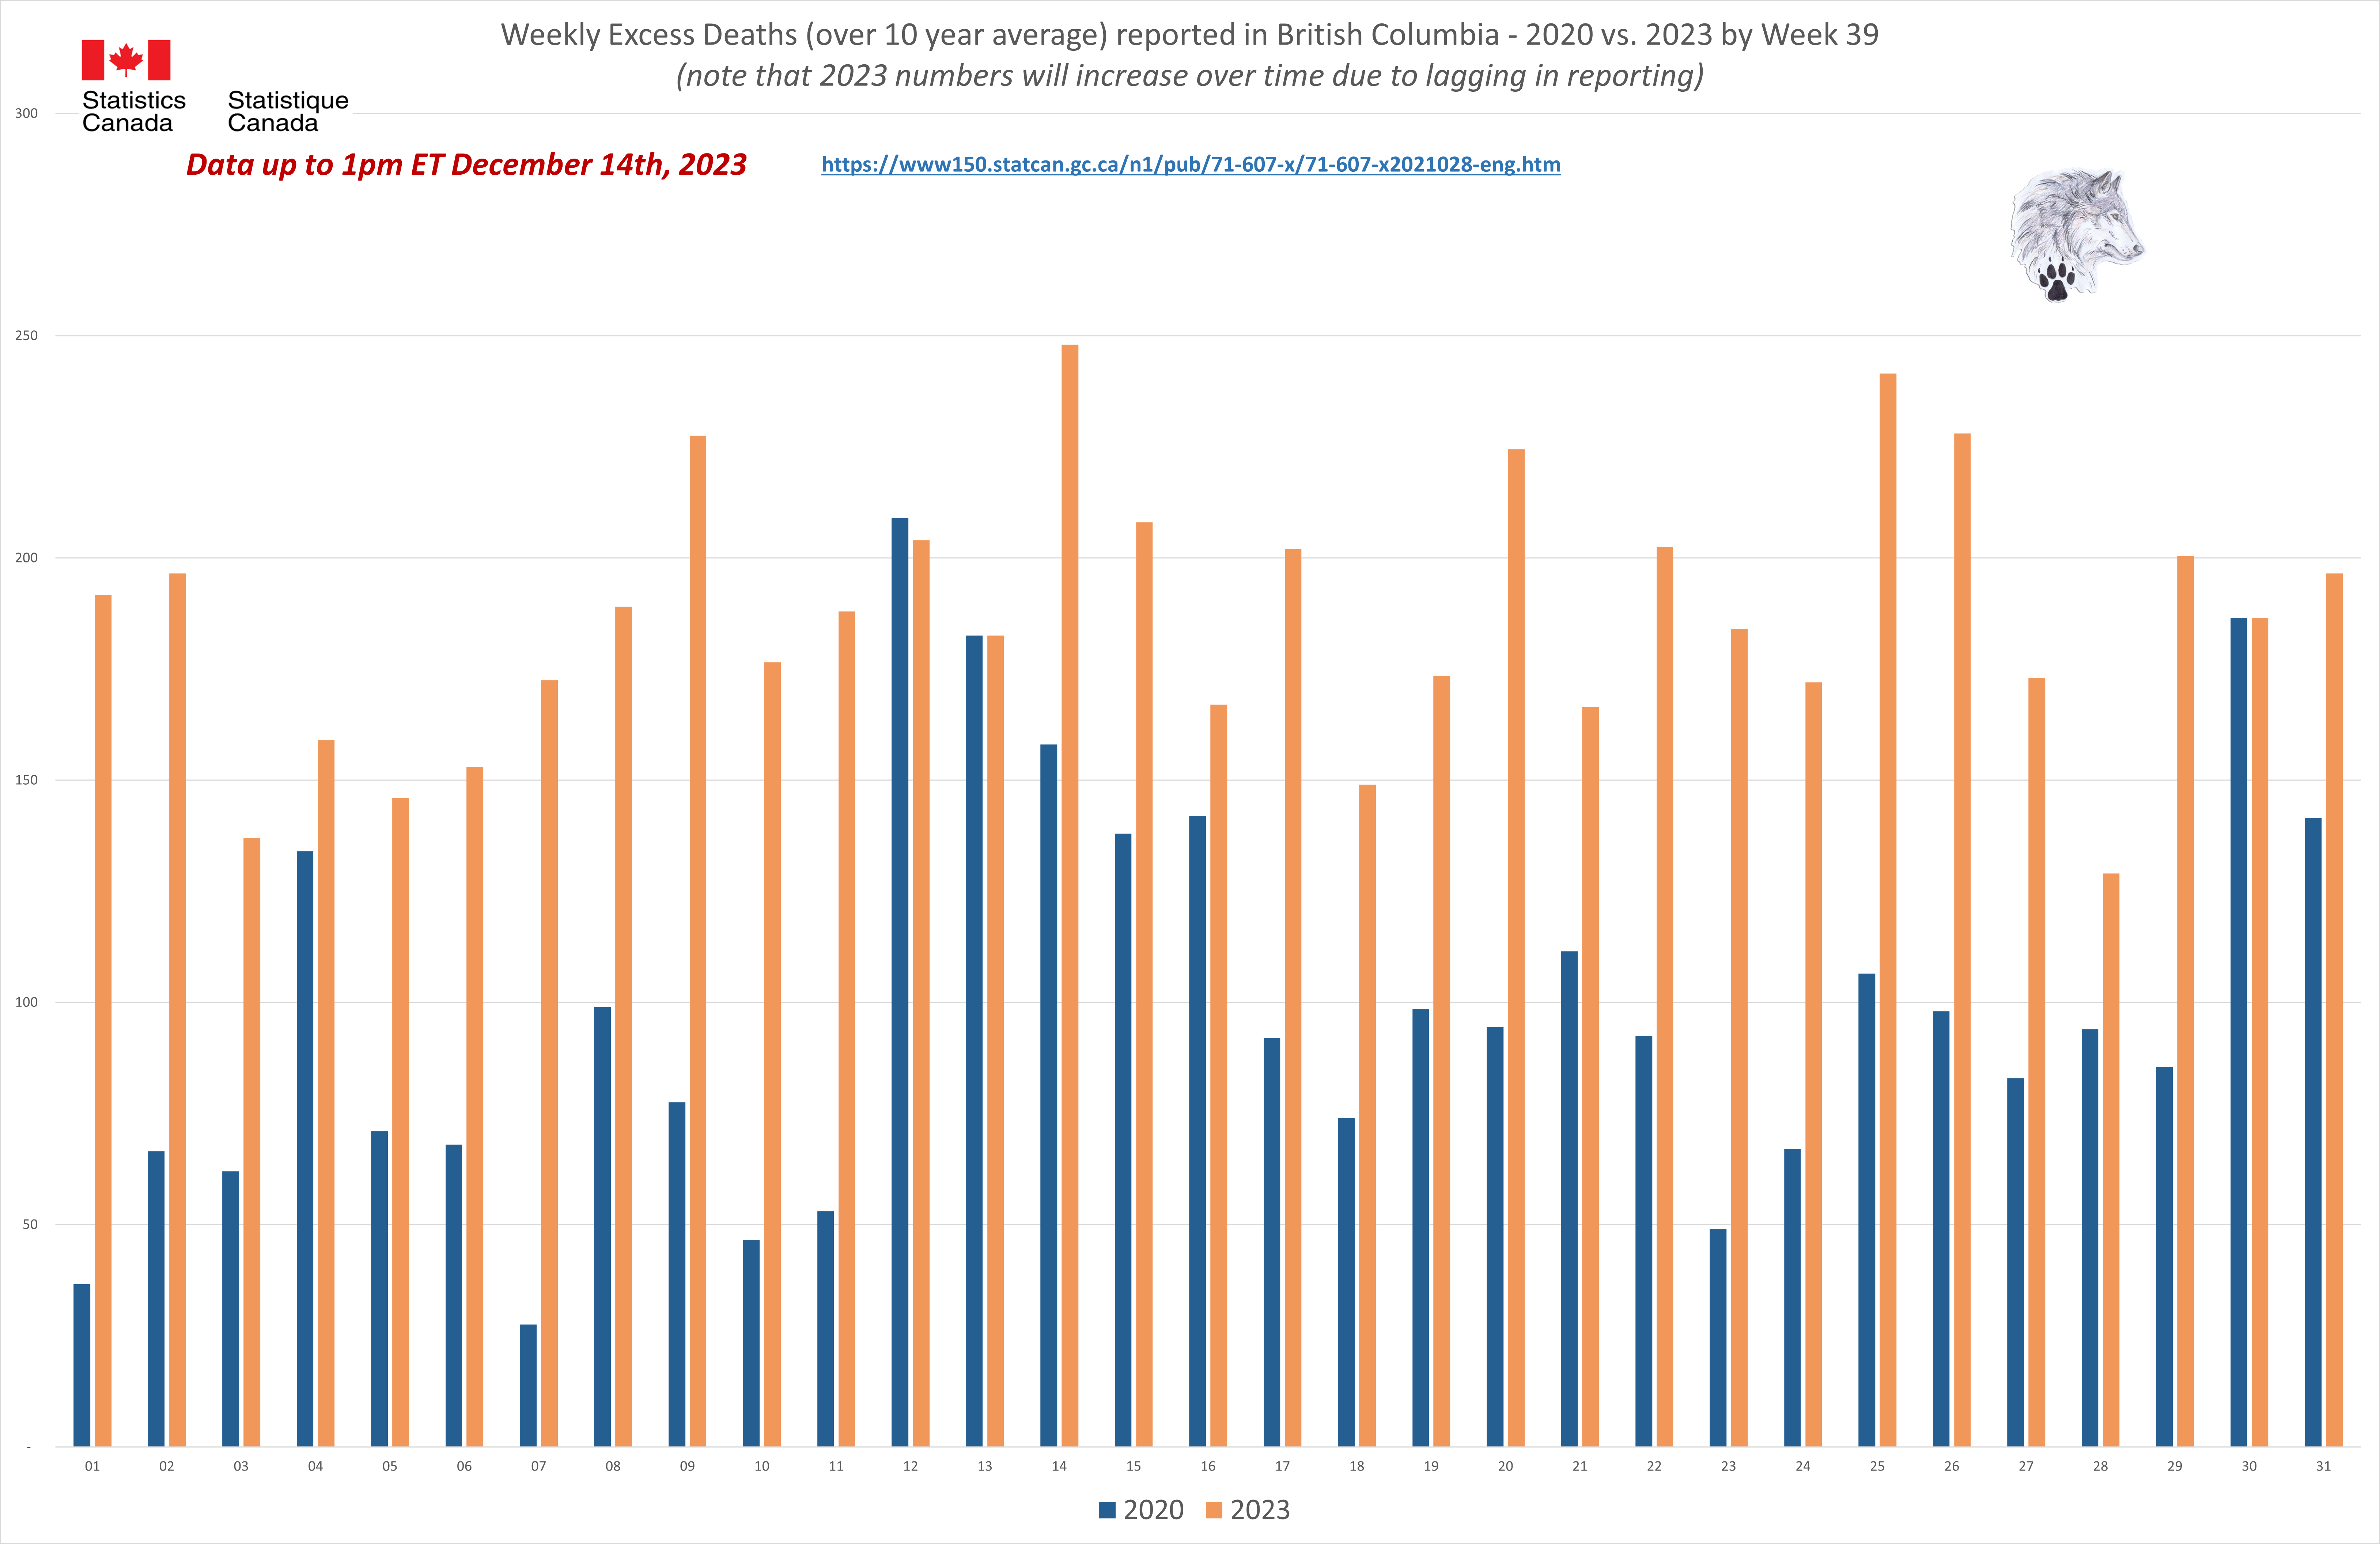
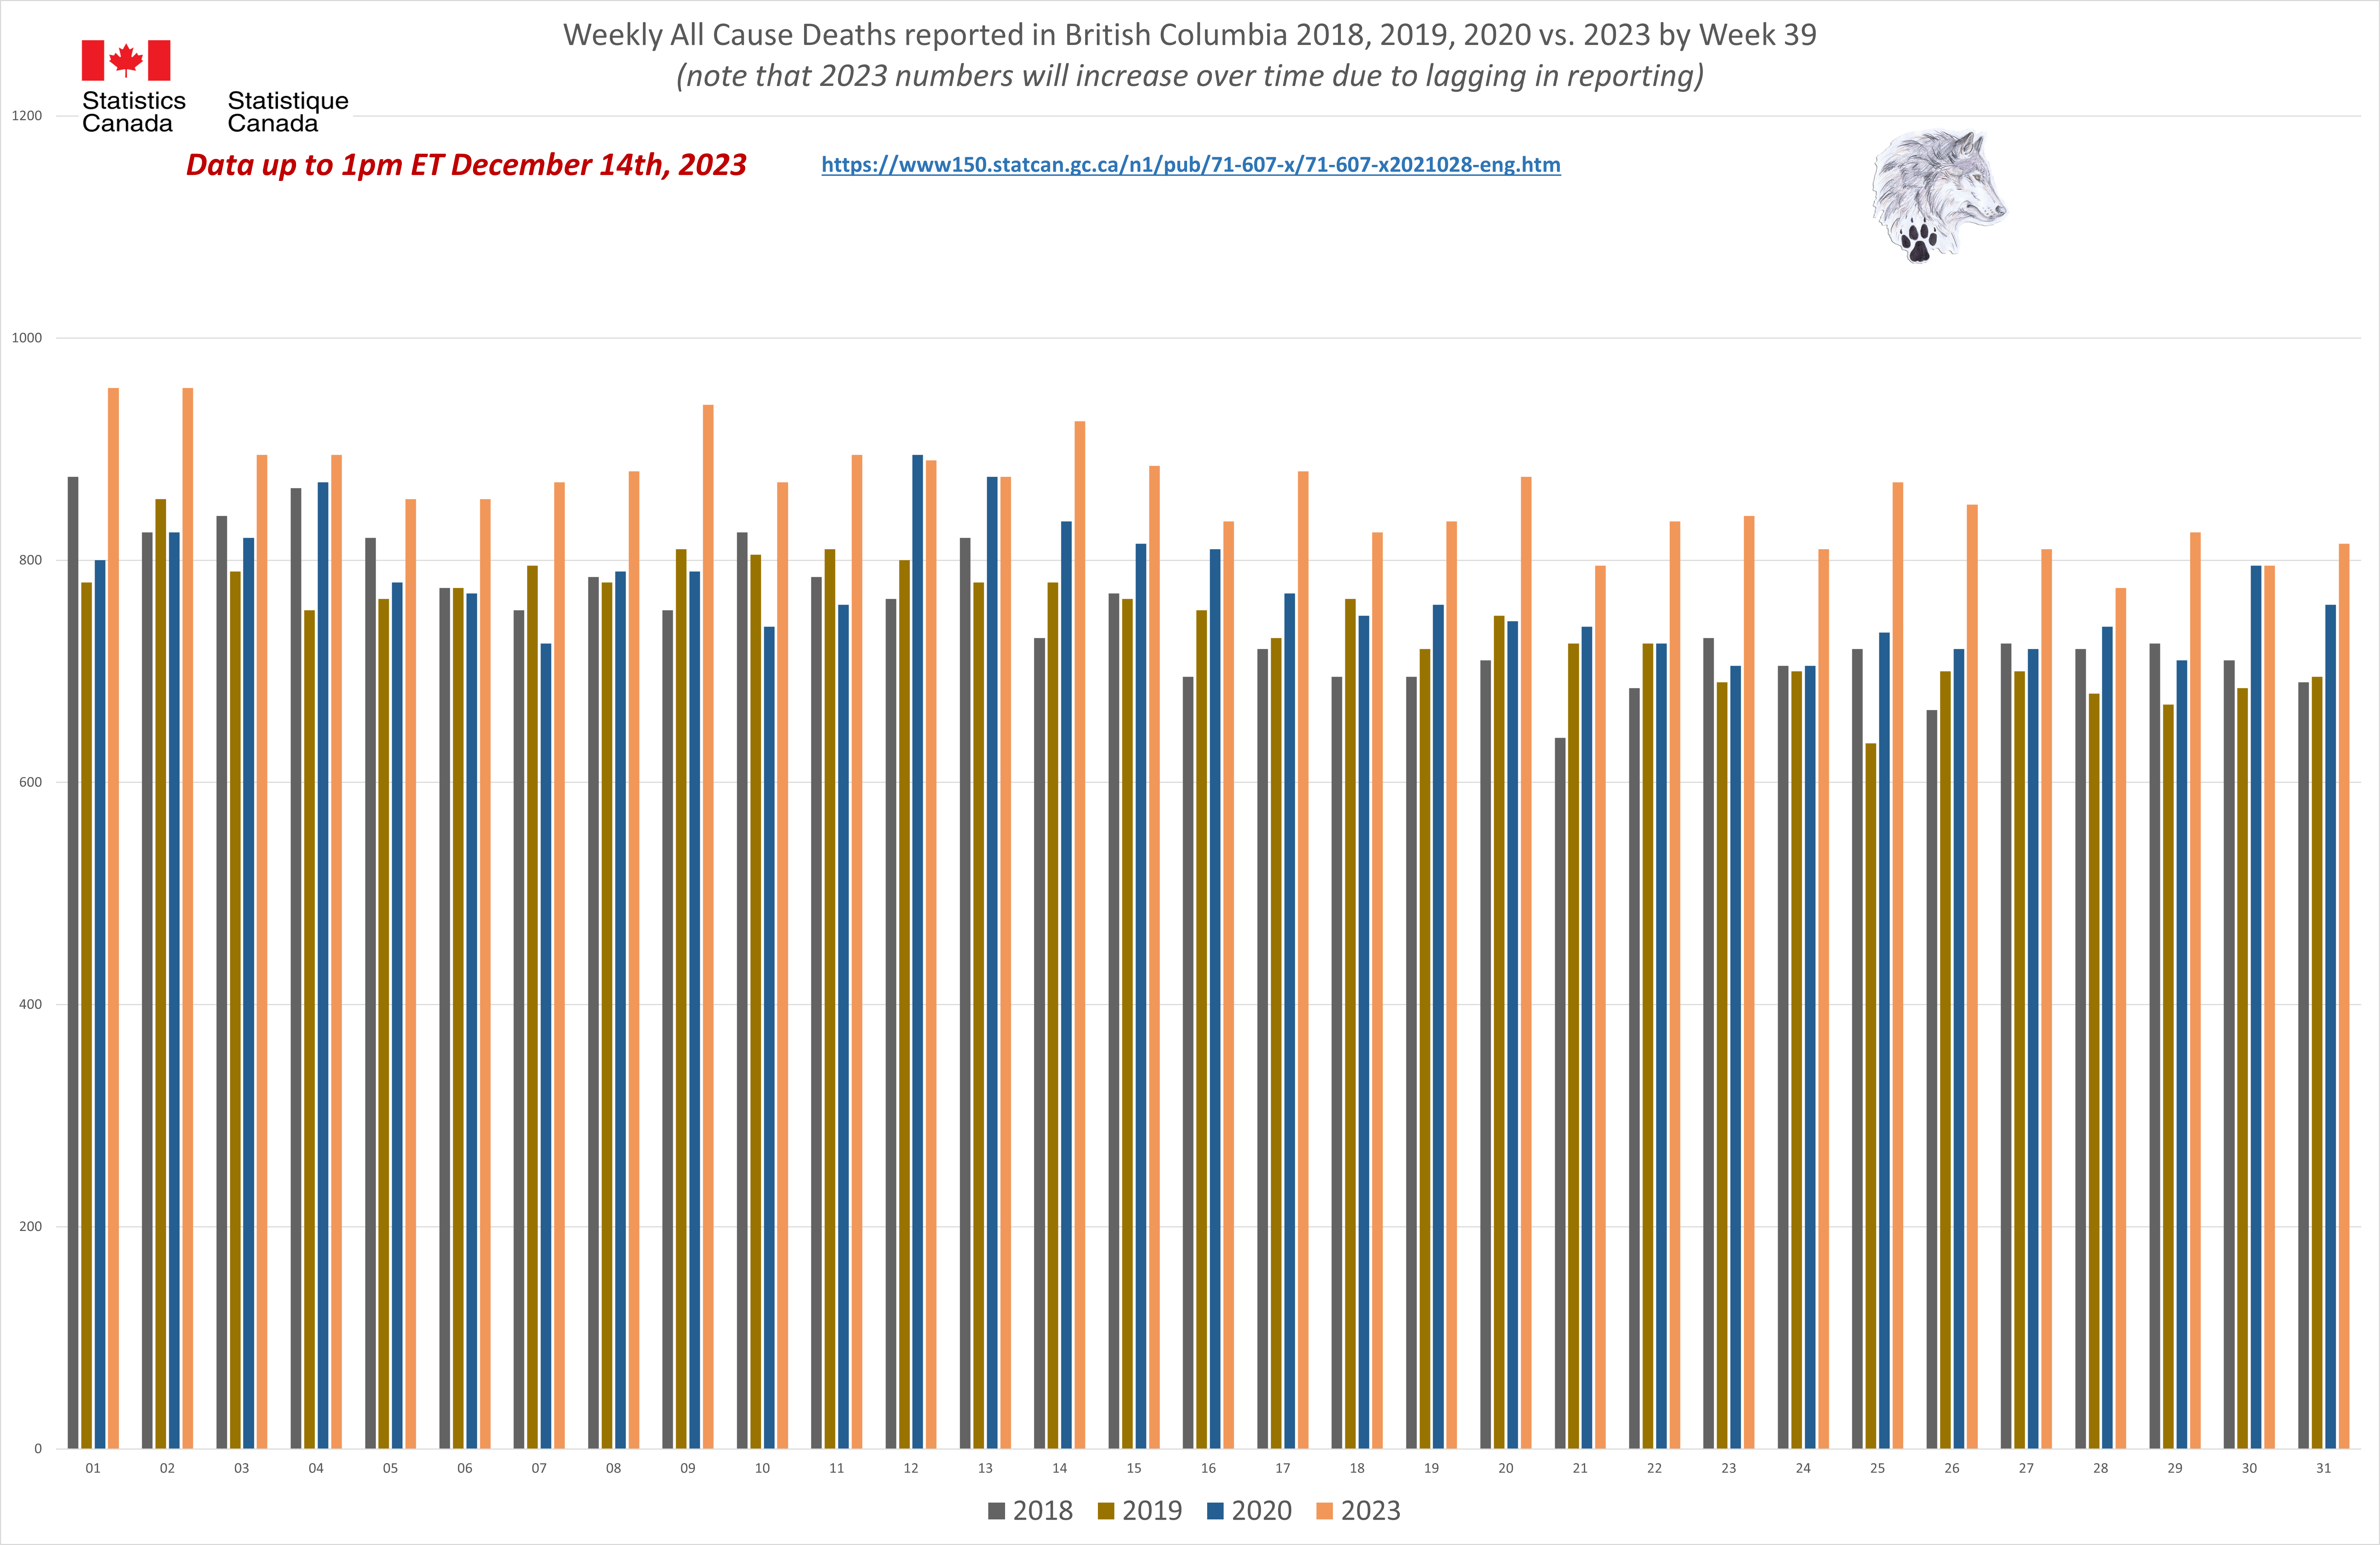
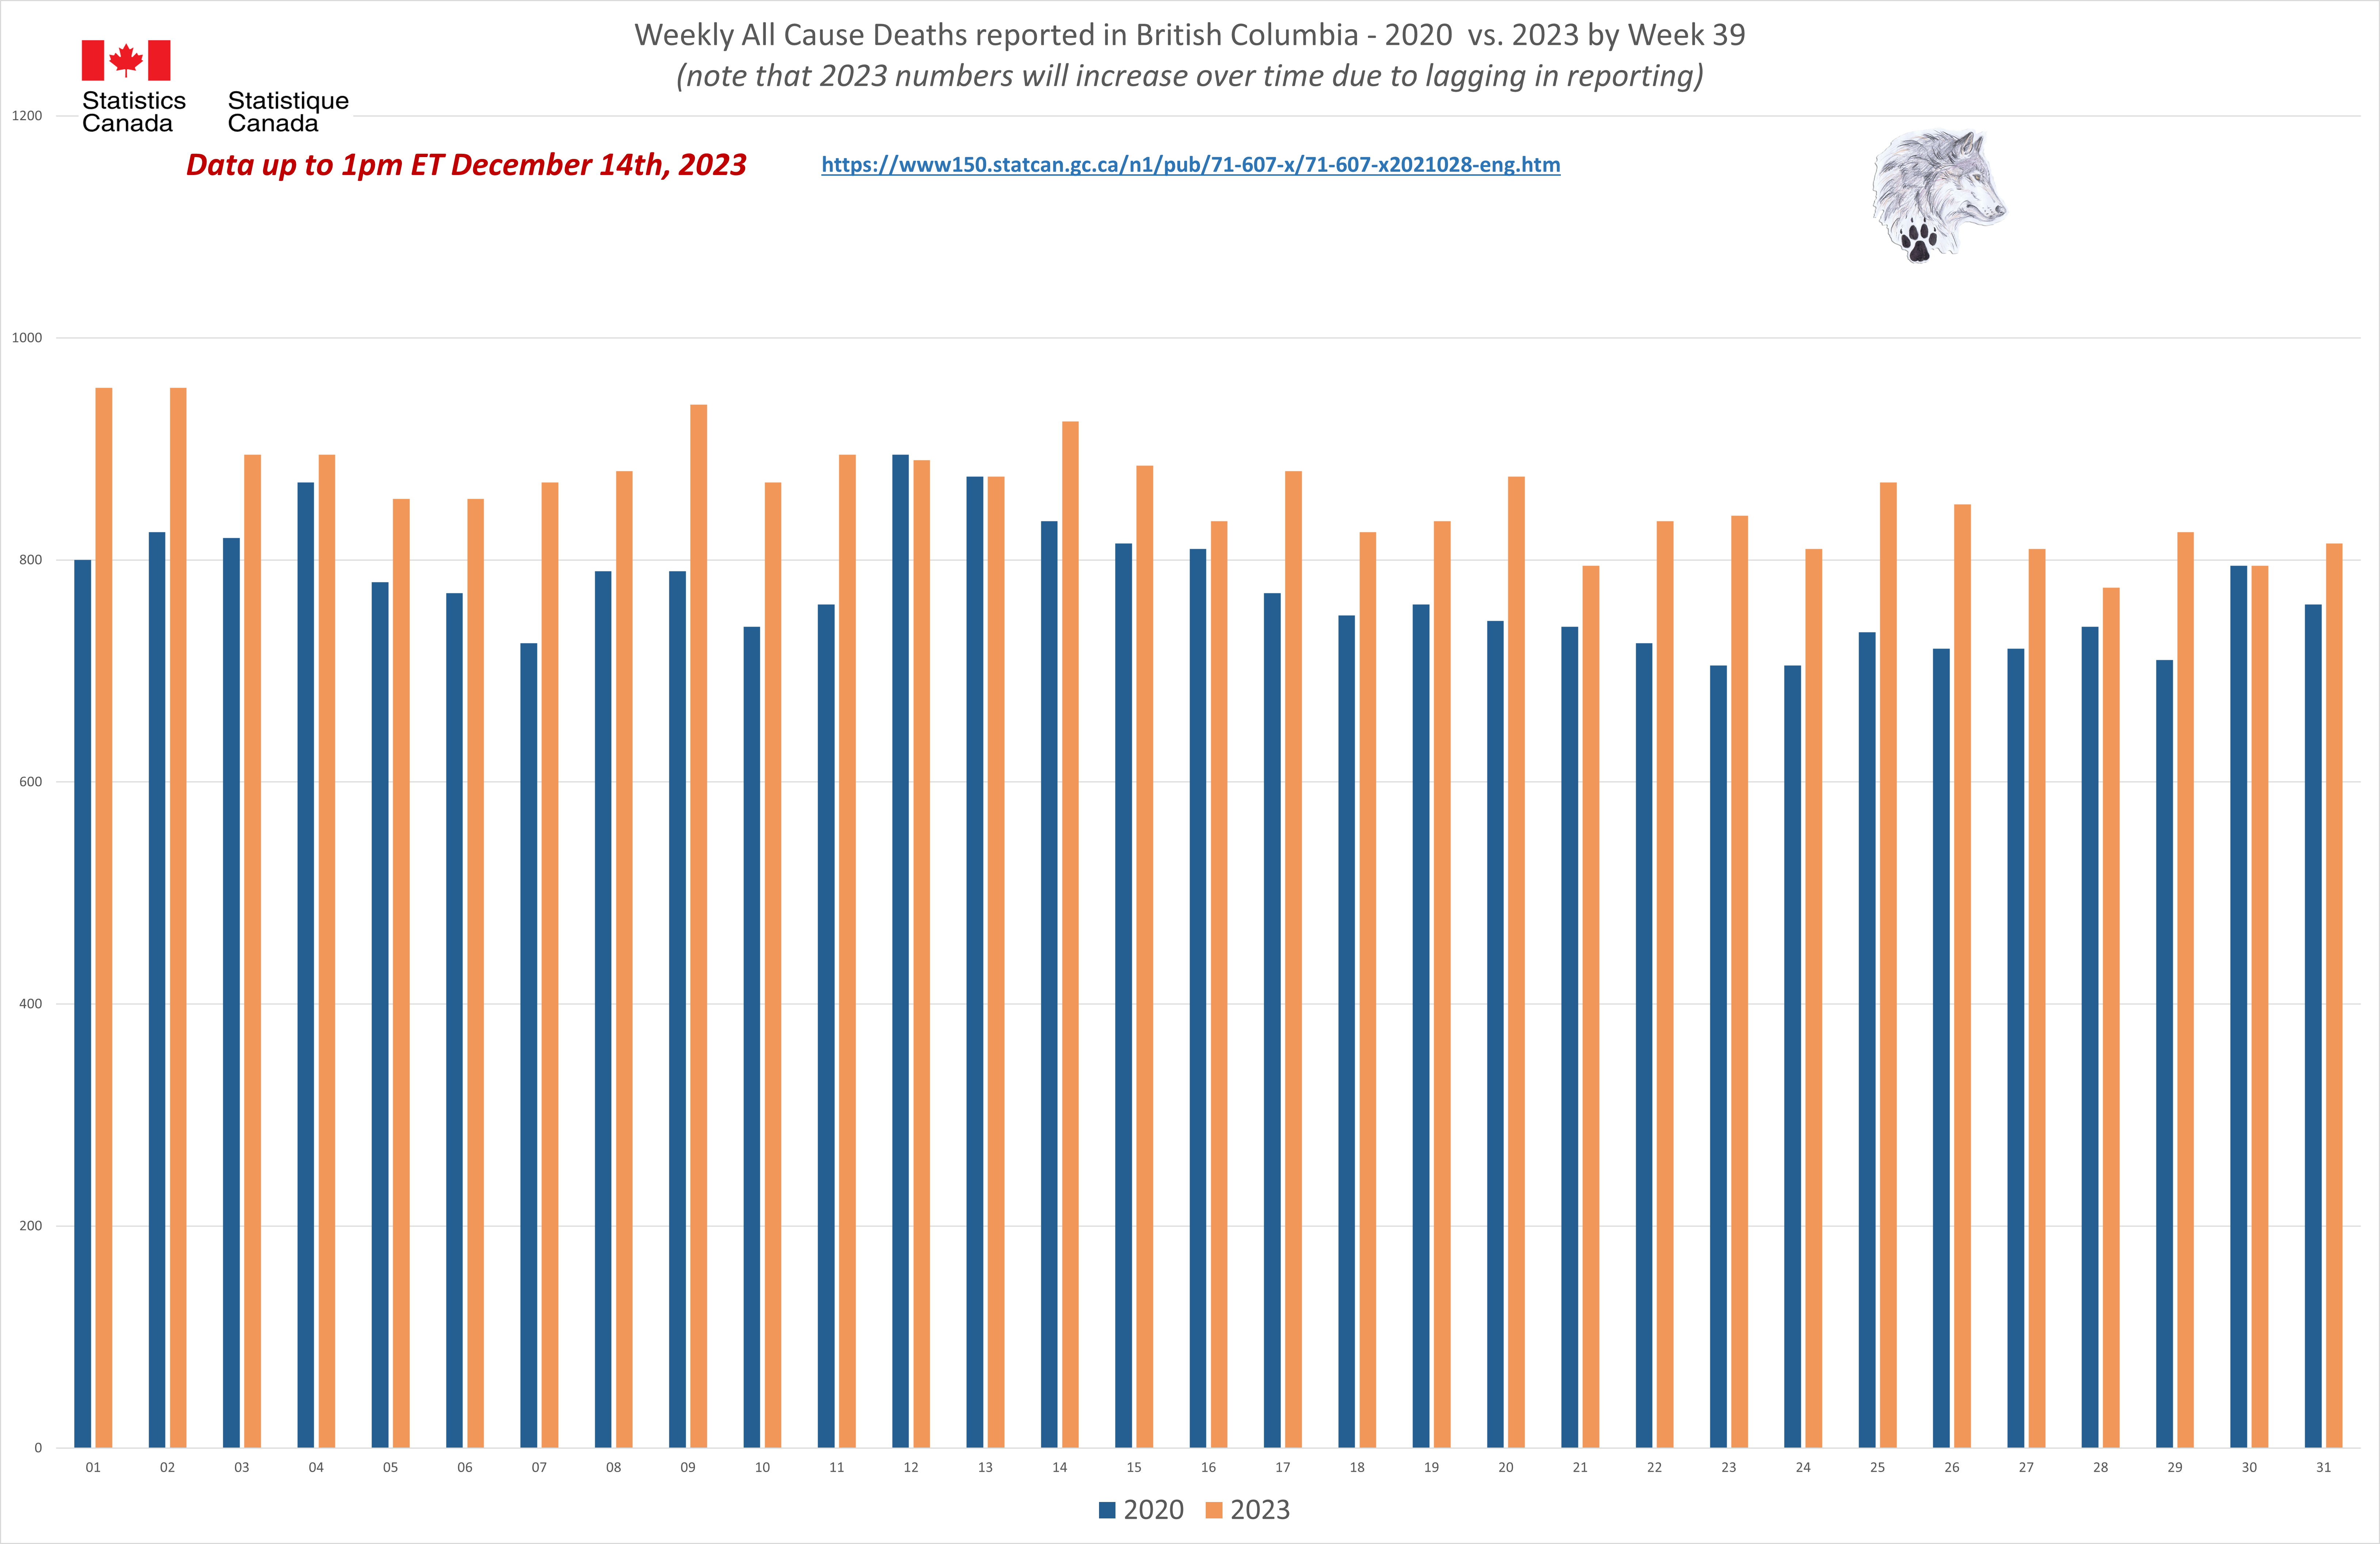
 British Columbia - All Cause Deaths 2020 vs. 2023
BC - Population 5.3 million
1,490
British Columbia - All Cause Deaths 2020 vs. 2023
BC - Population 5.3 million
1,490 more deaths were reported in the first
39 weeks of 2020 than in 2019. However, we have
4,470 more deaths reported in the comparable period in 2023.
THREE times as many people died and not a word from anyone in authority.
All Cause deaths in 2023 are
HIGHER in
EVERY month than the reported 2020 numbers. This is even more disturbing as the 2023 numbers are still being reported and will be adjusted up as the months go on.
Why do we not see the big
RED FEAR mongering circles and numbers reported every day now as we did in 2020?
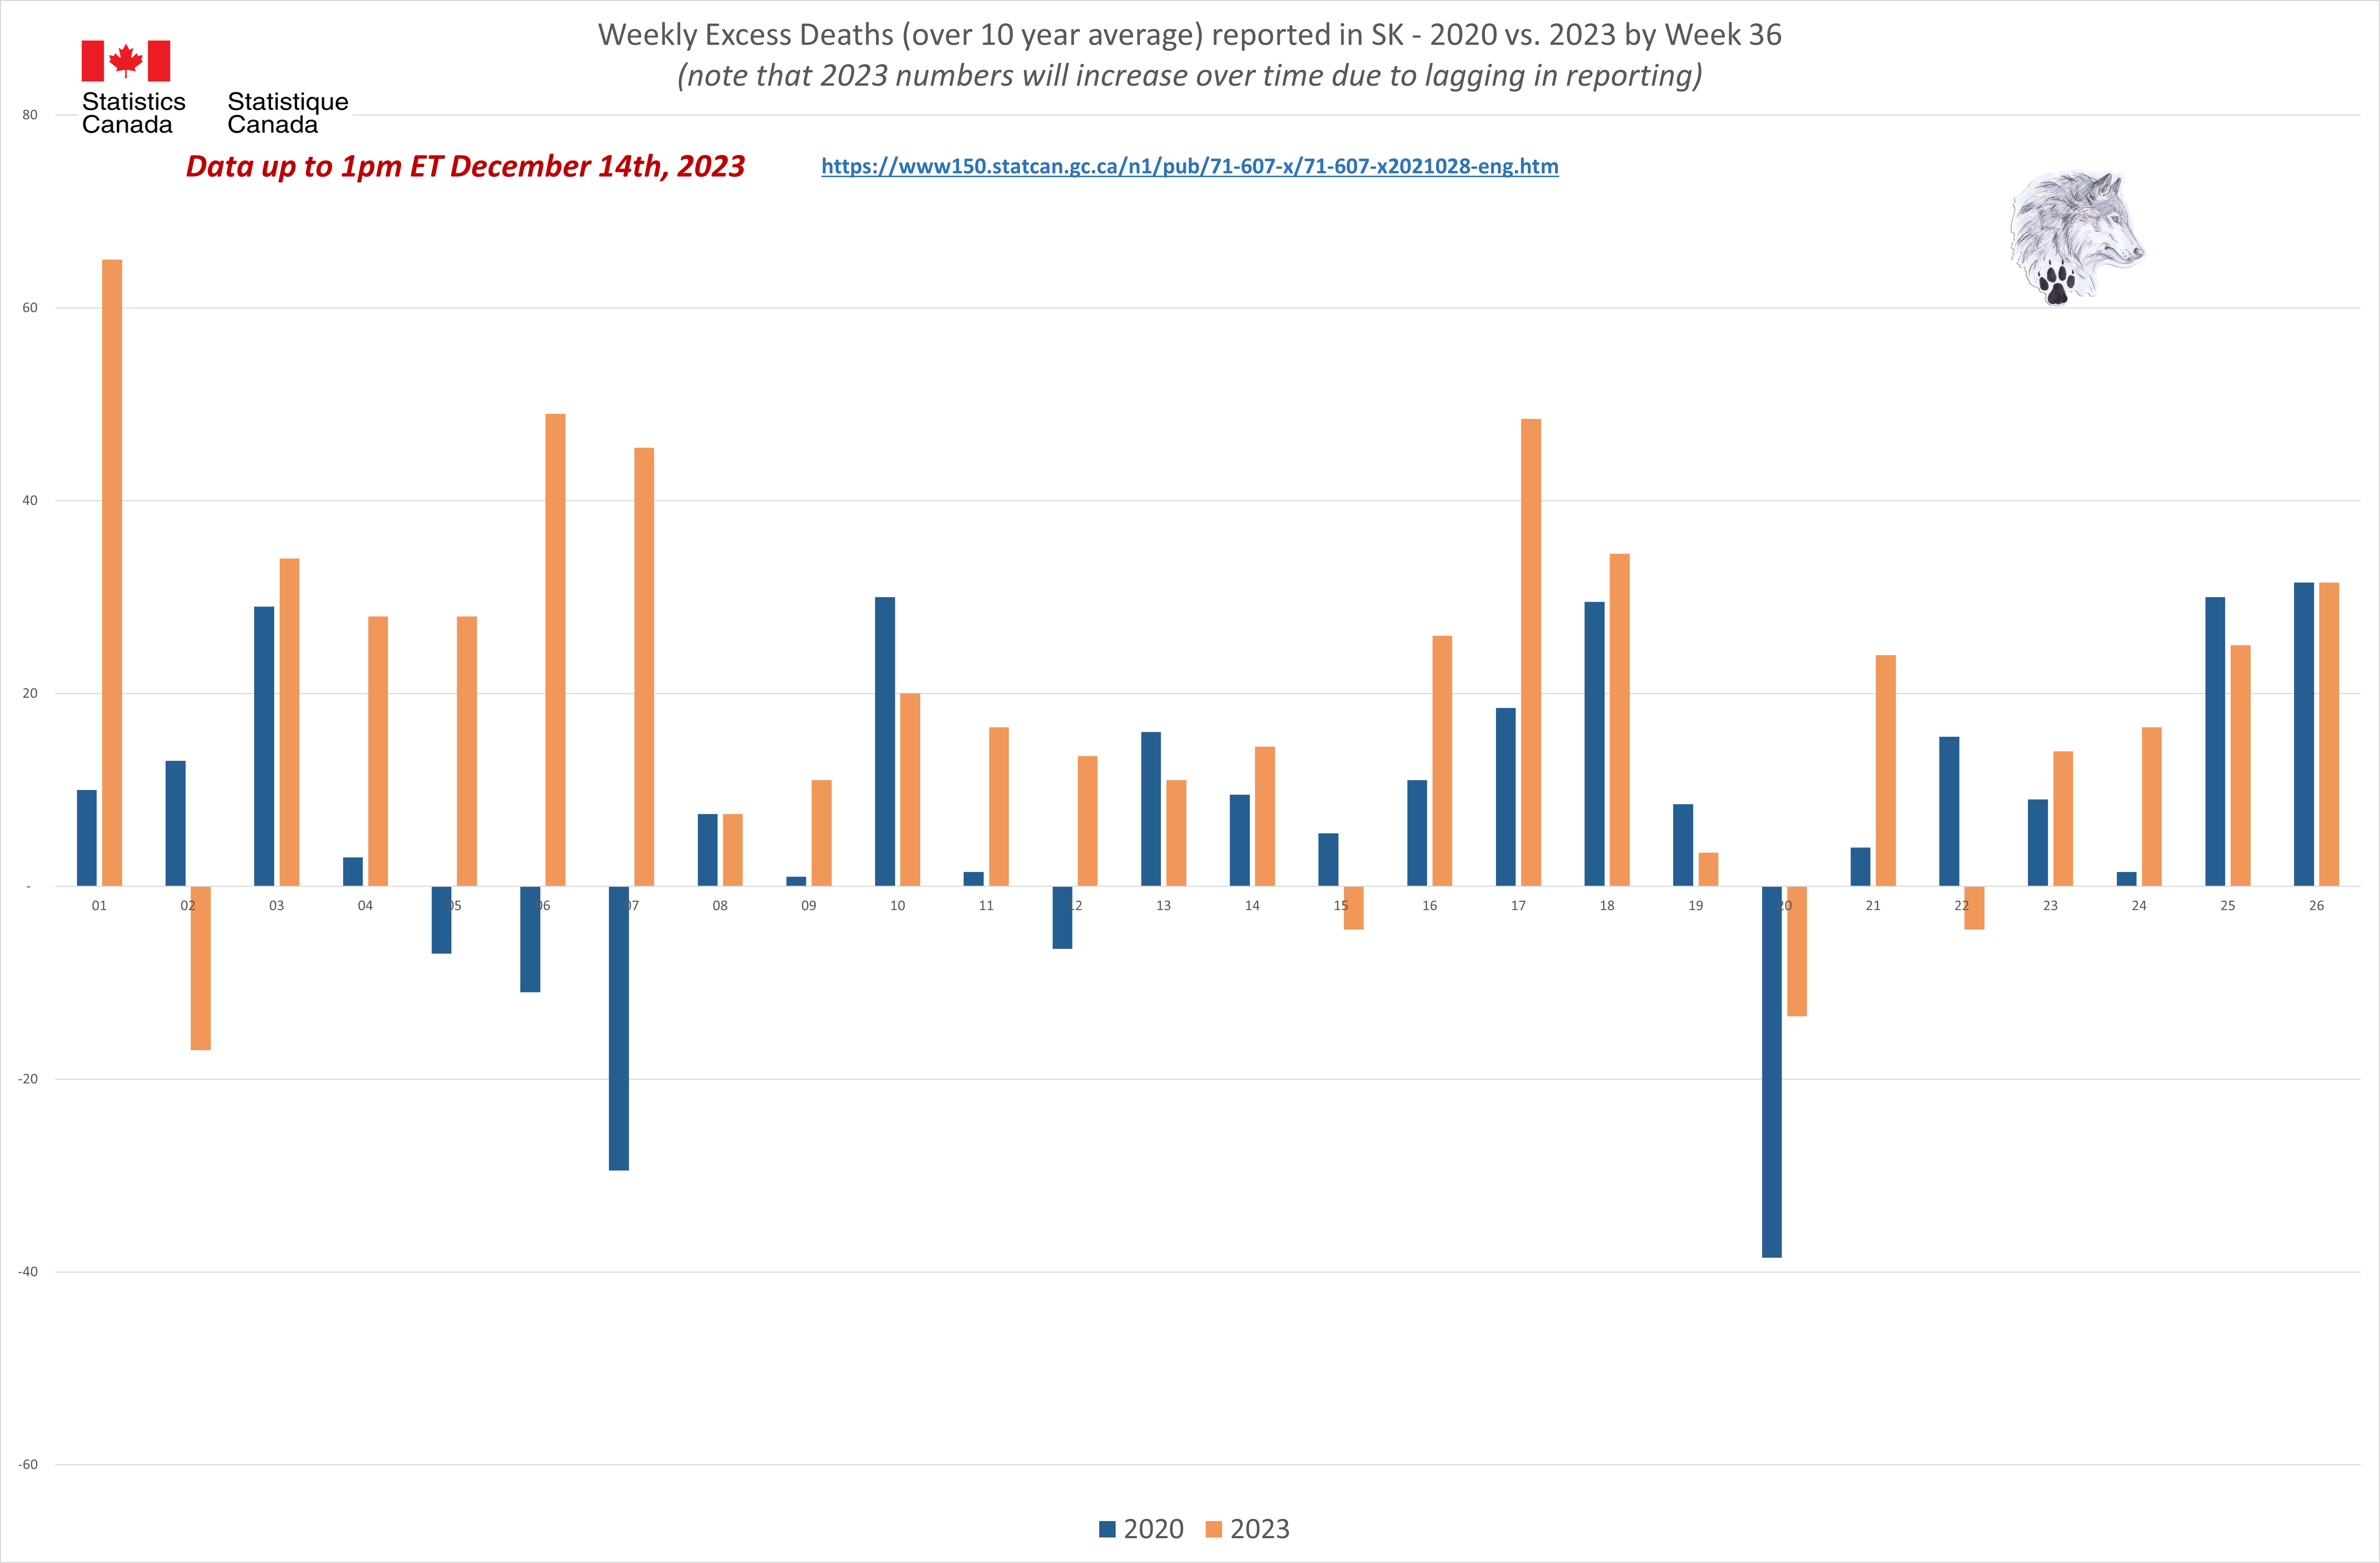
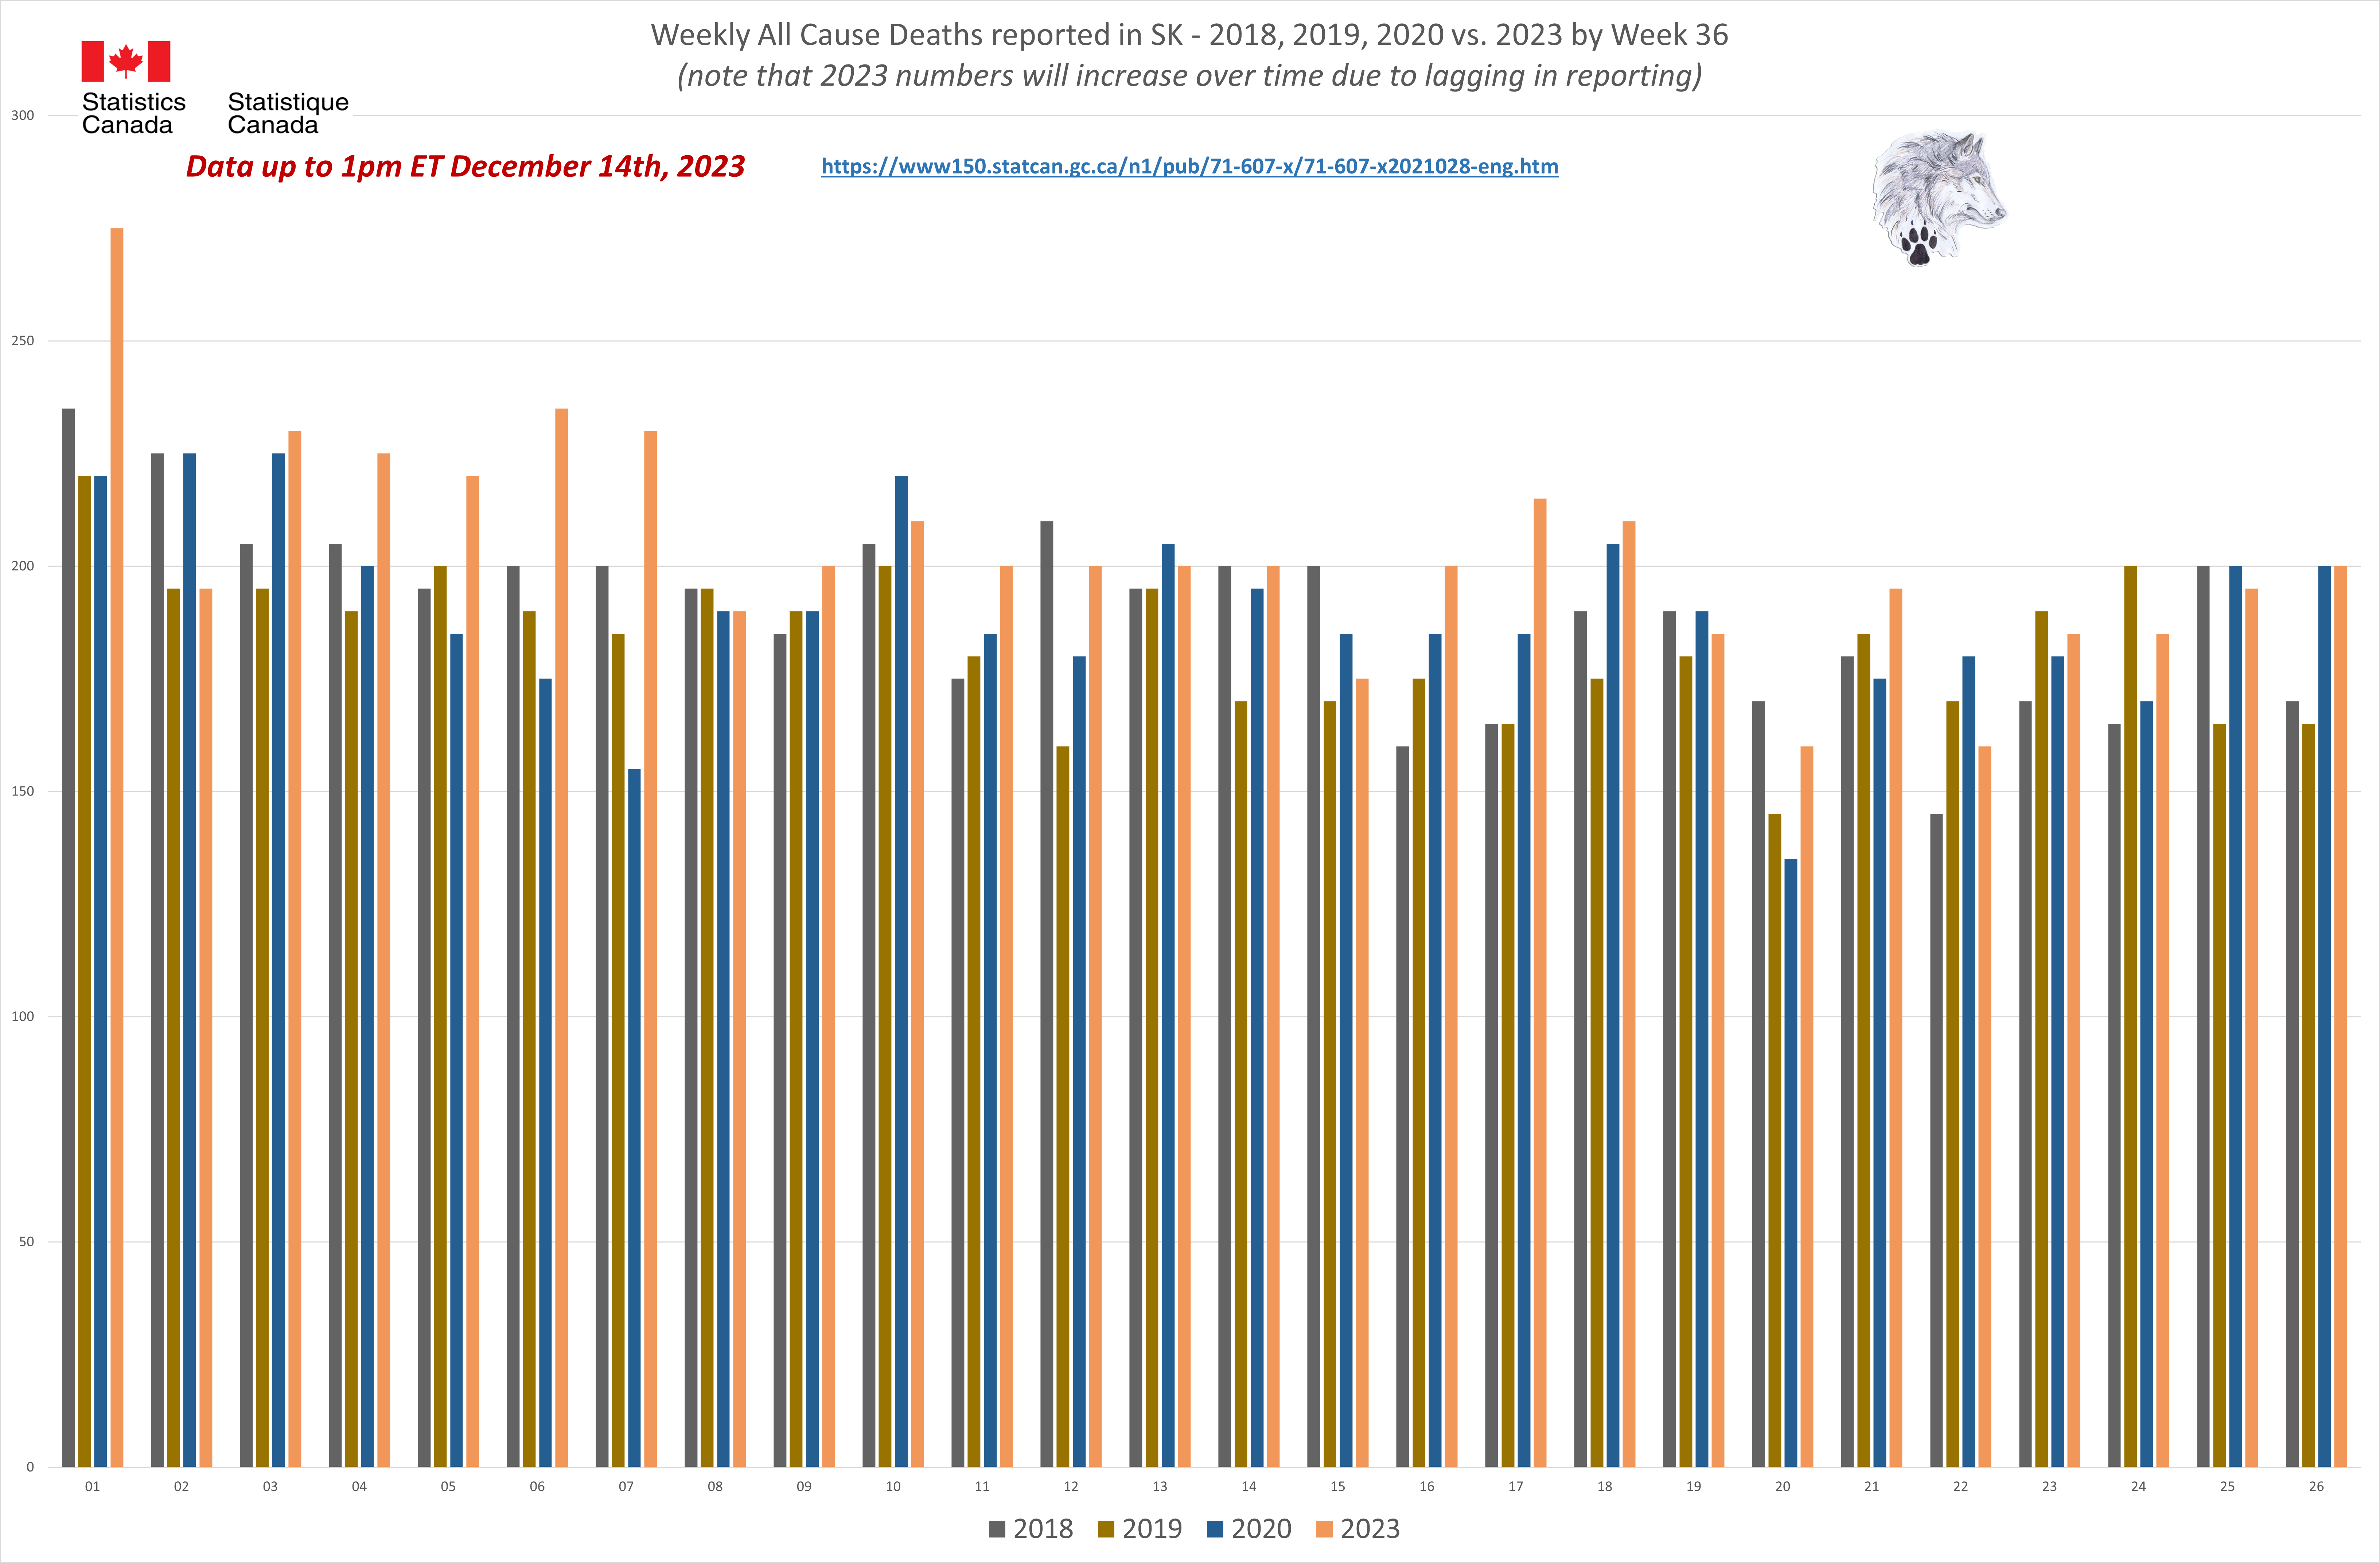
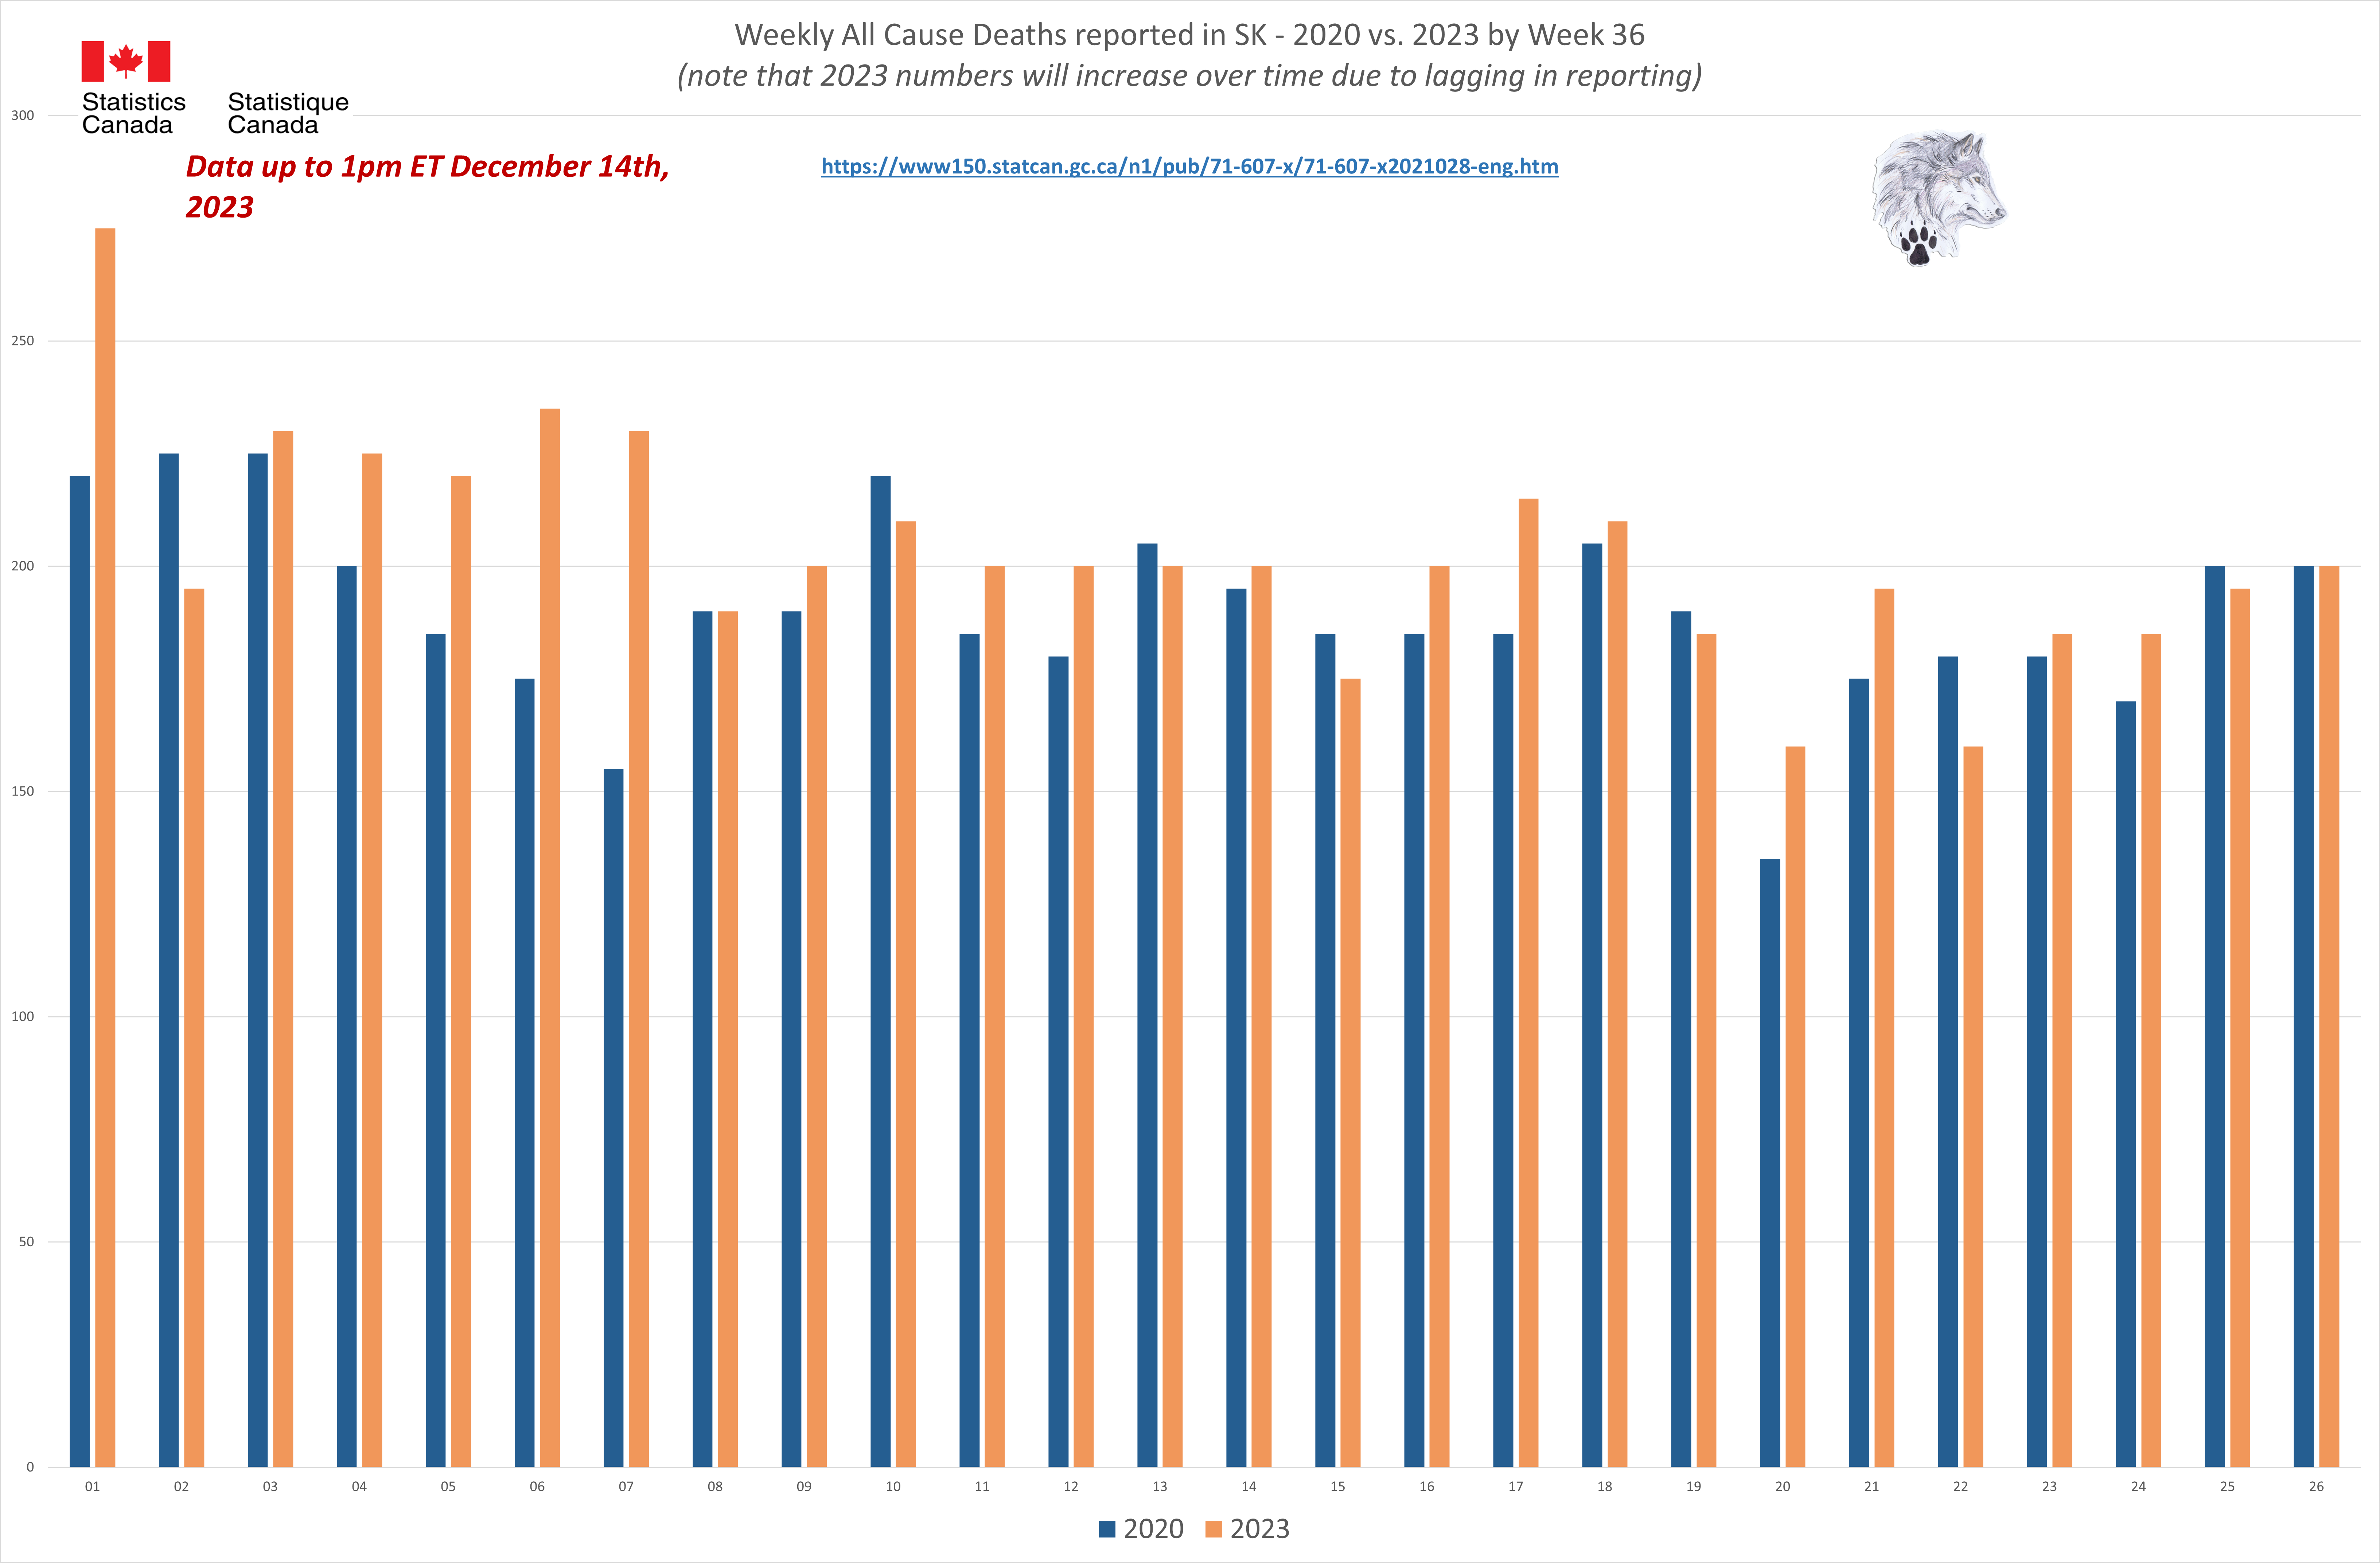
 Saskatchewan - All Cause Deaths 2020 vs. 2023
Saskatchewan - Population 1.17 million
295
Saskatchewan - All Cause Deaths 2020 vs. 2023
Saskatchewan - Population 1.17 million
295 more deaths were reported in the first
36 weeks of 2020 than in 2019. However, we have
800 more deaths reported in the comparable period in 2023.
ALMOST THREE times as many people died and not a word from anyone in authority.
All Cause deaths in 2023 are
HIGHER in
EVERY month than the reported 2020 numbers. This is even more disturbing as the 2023 numbers are still being reported and will be adjusted up as the months go on.
Why do we not see the big
RED FEAR mongering circles and numbers reported every day now as we did in 2020?
 Health Canada Source Data - All Files (5):
https://www150.statcan.gc.ca/n1/daily-quotidien/221208/dq221208f-cansim-eng.htm
Health Canada Source Data - All Files (5):
https://www150.statcan.gc.ca/n1/daily-quotidien/221208/dq221208f-cansim-eng.htm
All Cause by Age:
https://www150.statcan.gc.ca/t1/tbl1/en/tv.action?pid=1310076801
All Cause by Cause:
https://www150.statcan.gc.ca/t1/tbl1/en/tv.action?pid=1310076801
Health Canada Charts (note these charts obfuscate the actual increase in All Cause Mortality. Analysis of the data by province (see above) is required for the true picture in Canada)
https://www150.statcan.gc.ca/n1/pub/71-607-x/71-607-x2021028-eng.htm
And it is getting worse, replicated the world over. Even in Sweden.
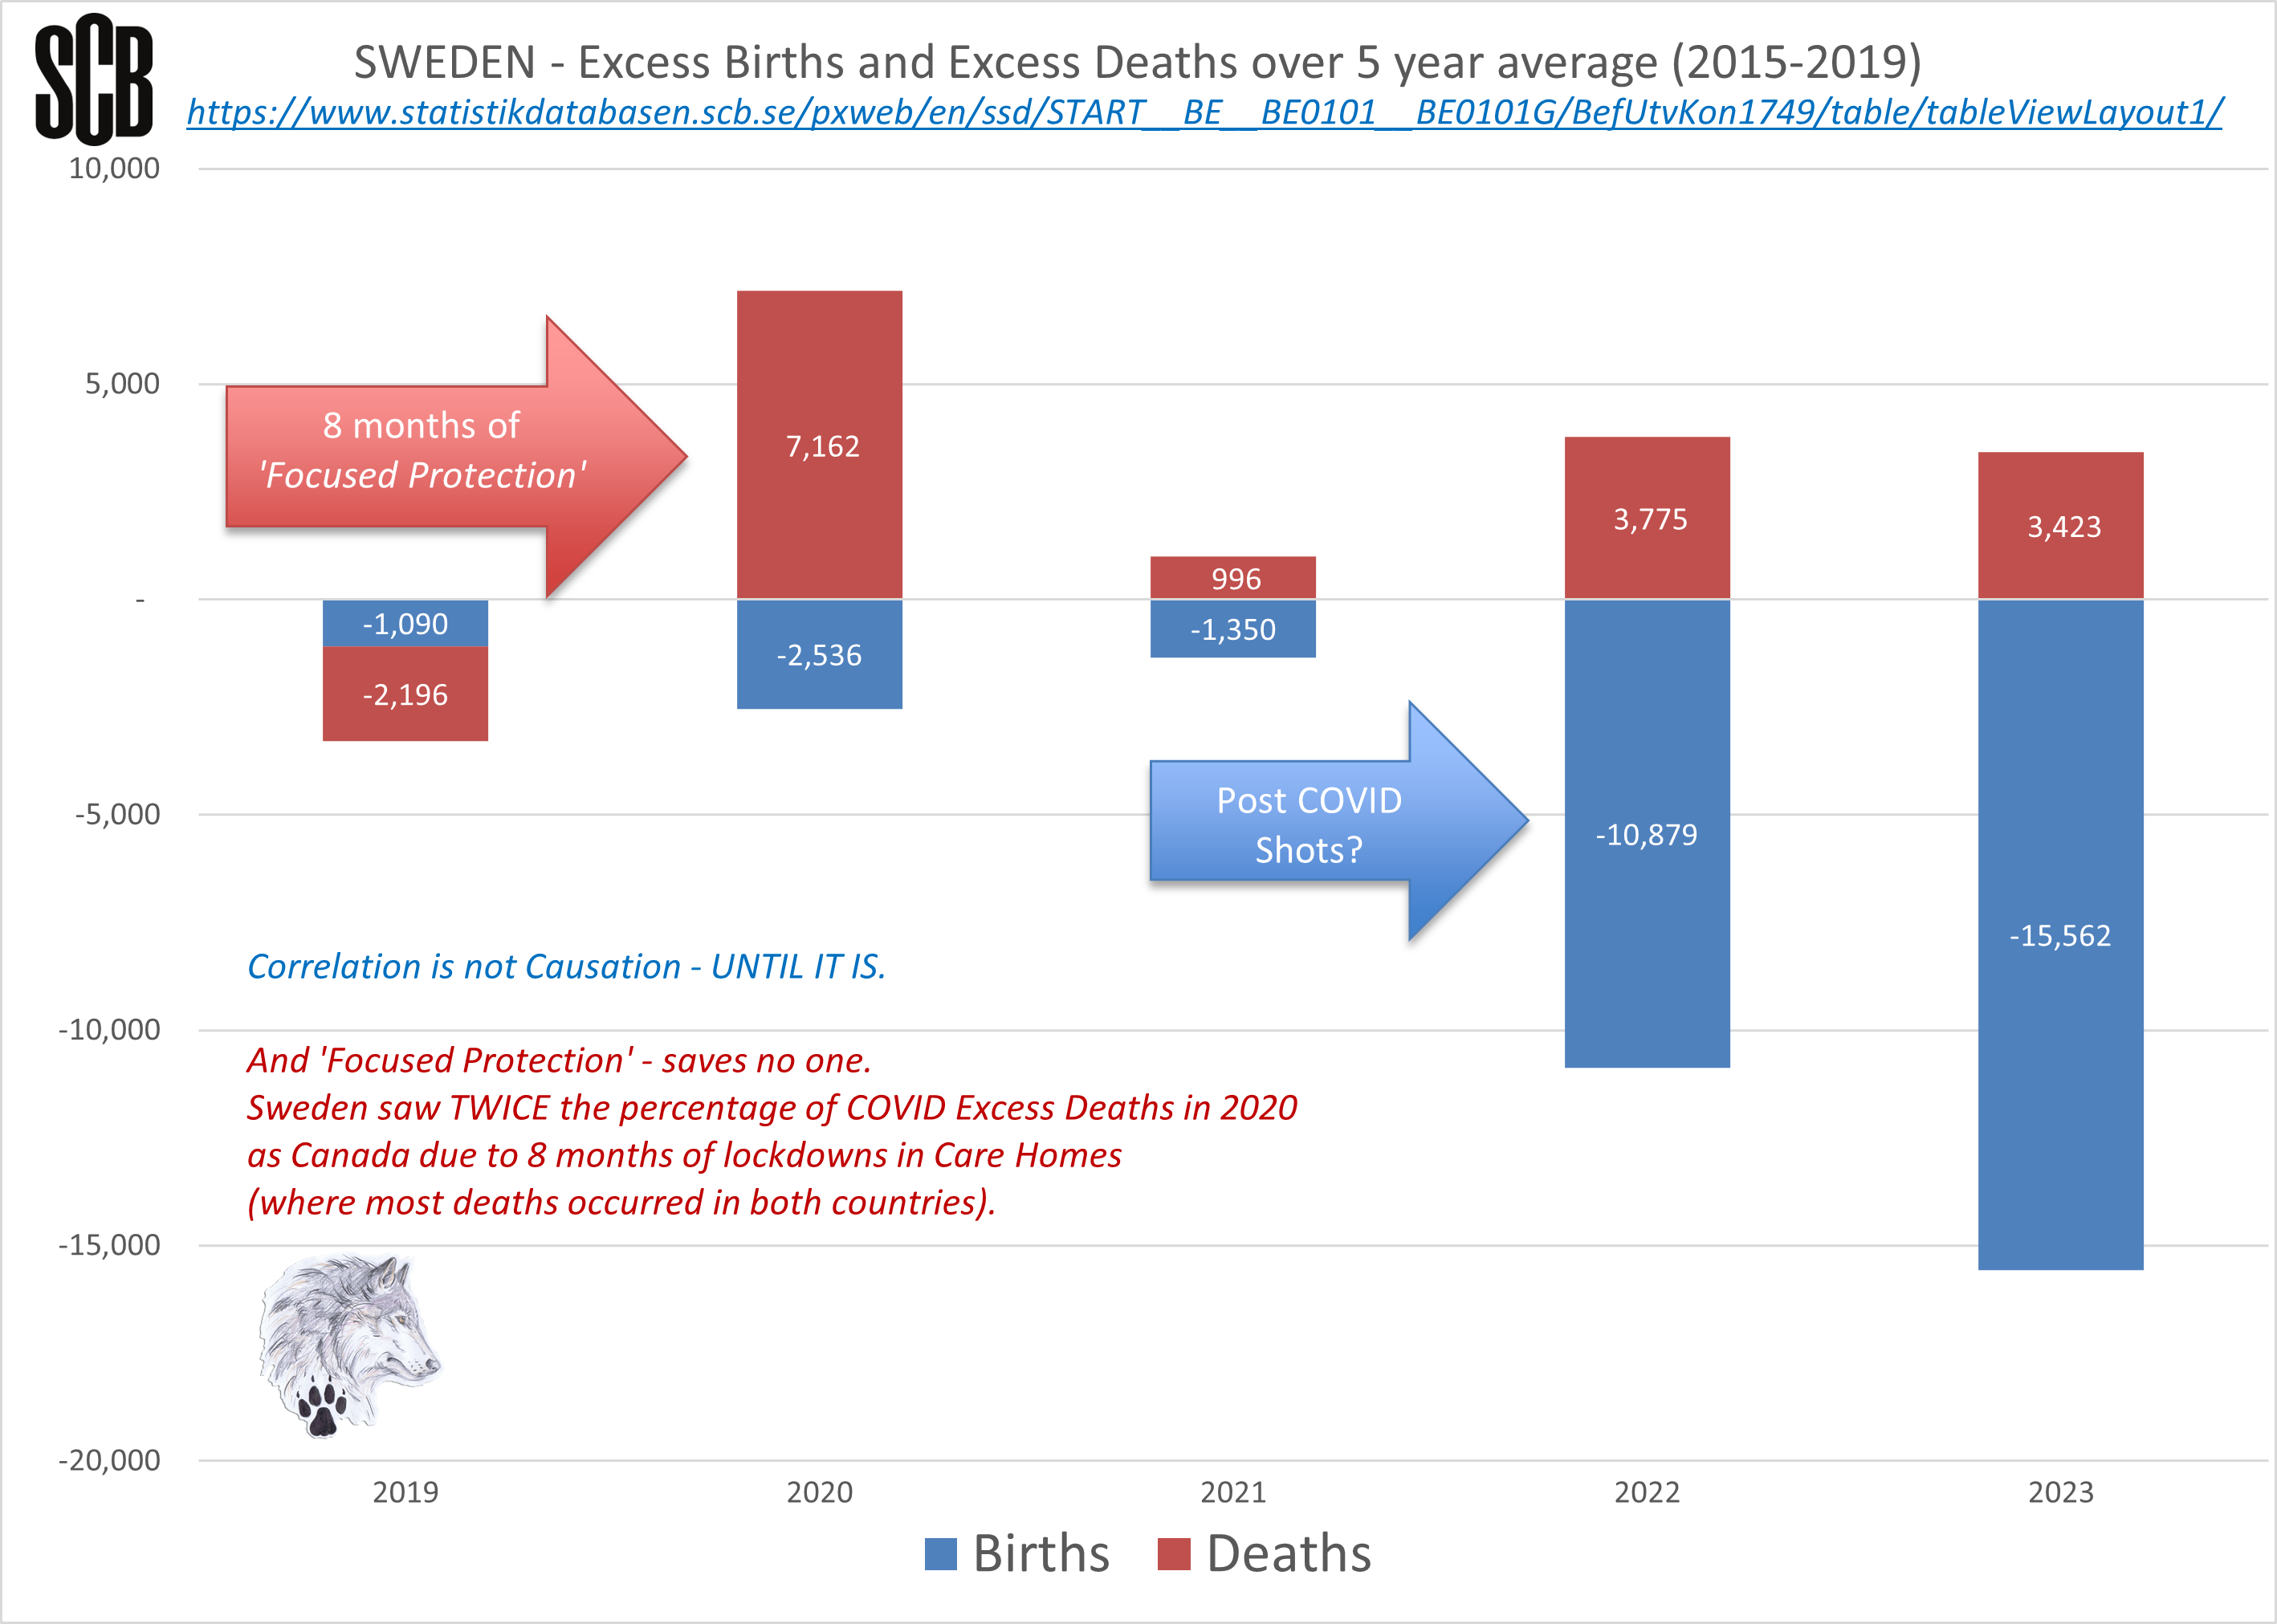
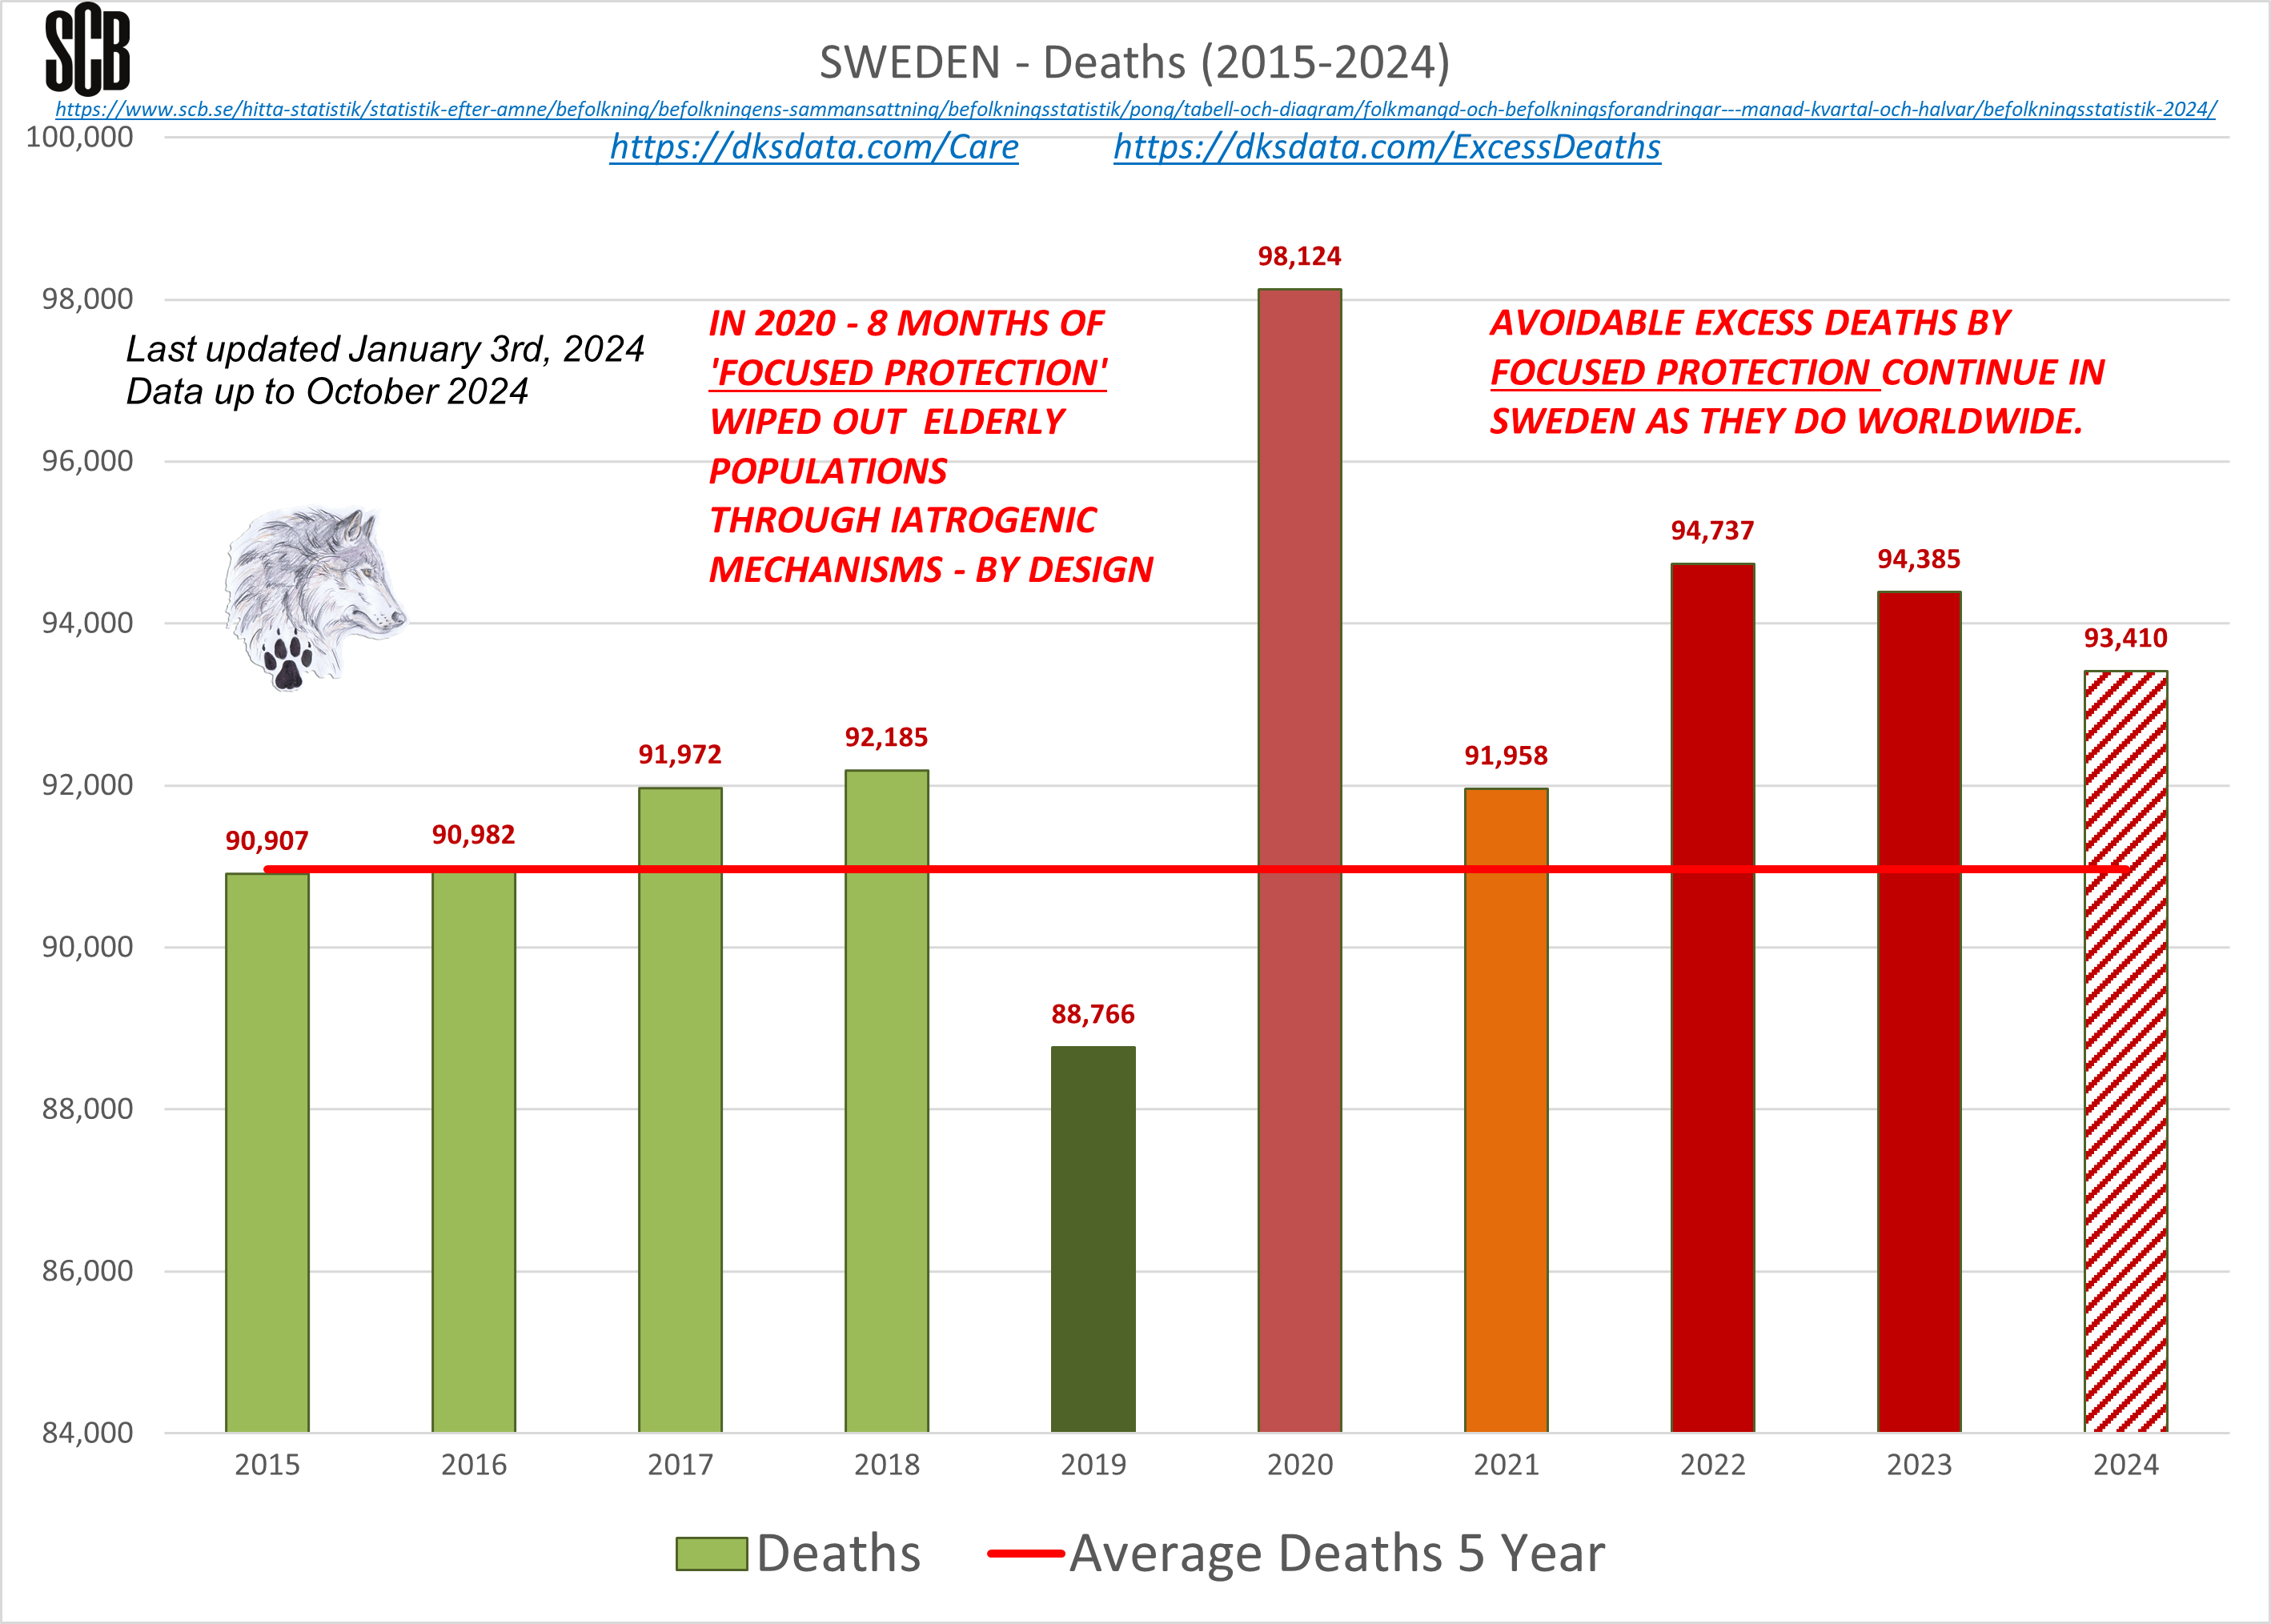
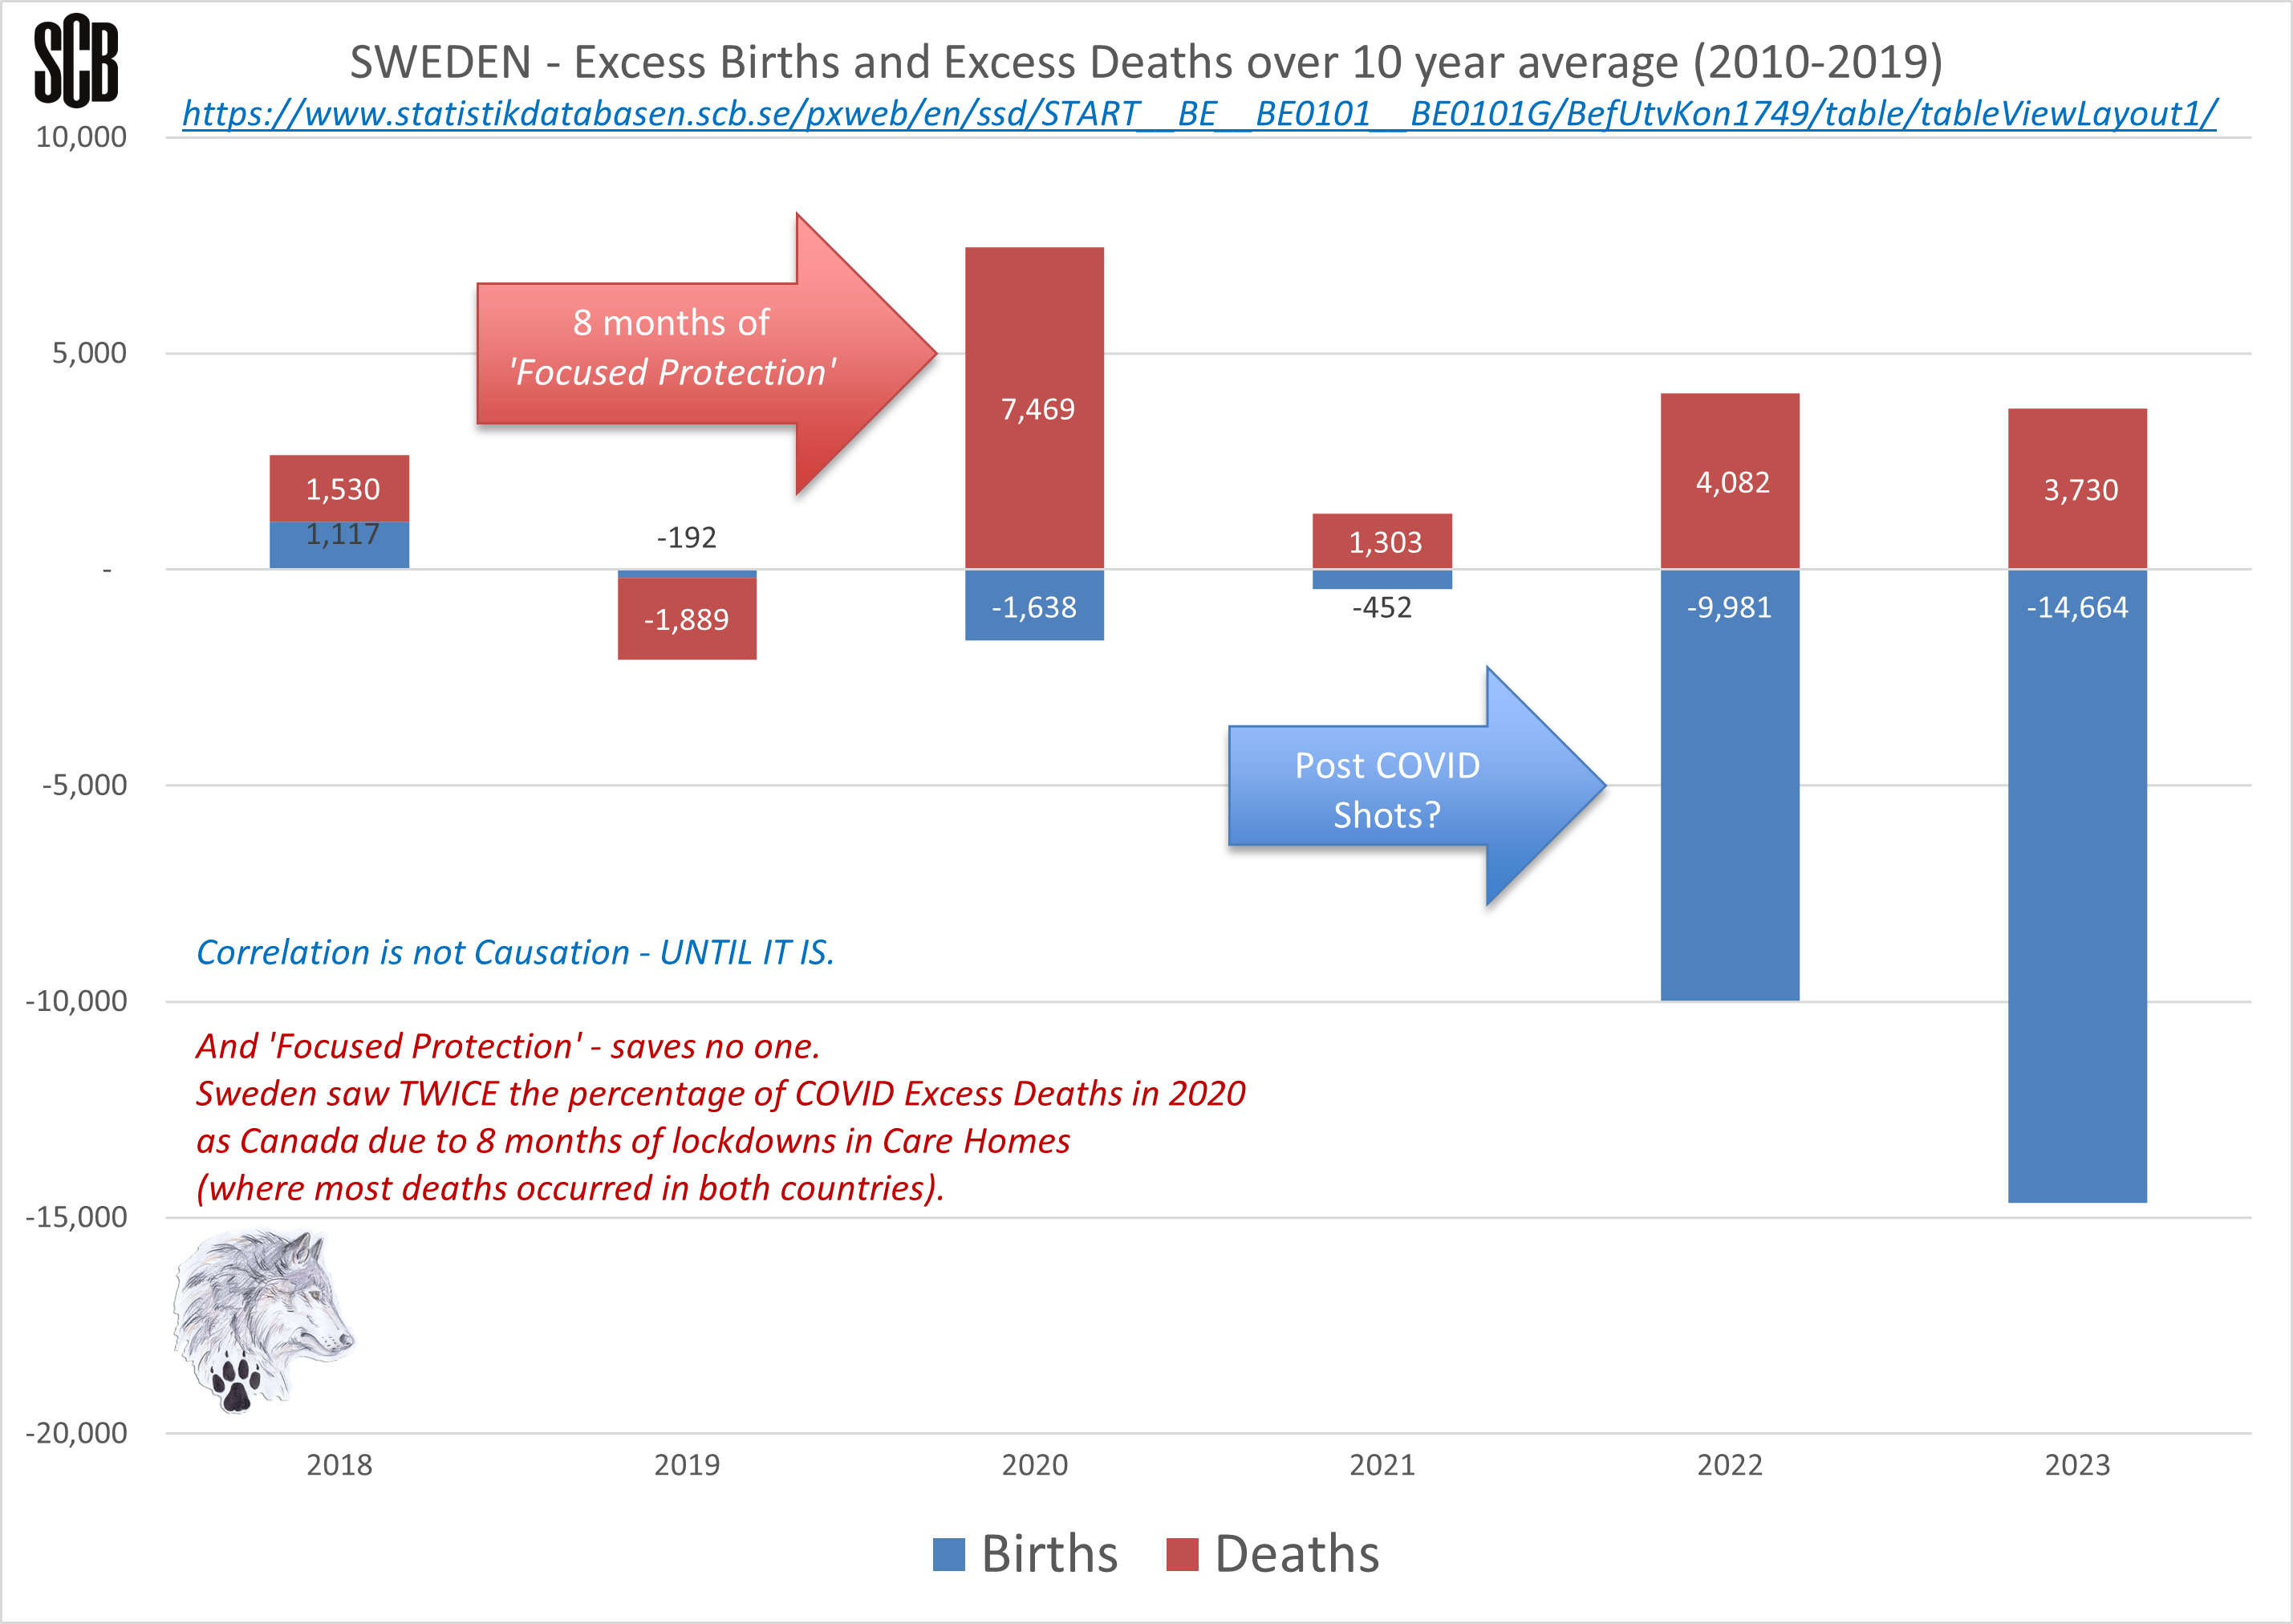
SWEDEN - Not what you thought.
The fallacy of “FOCUSED PROTECTION”
"SWEDEN DIDN'T LOCK DOWN" -
FALSE
(Sweden locked down the 'Most Vulnerable' for 8 months in 2020.) - Focused Protection in Care Homes - KILLS
Sweden Excess Deaths spiked, mainly for Care Homes in 2020 when THEY were locked down as a result of 'Focused Protection'.
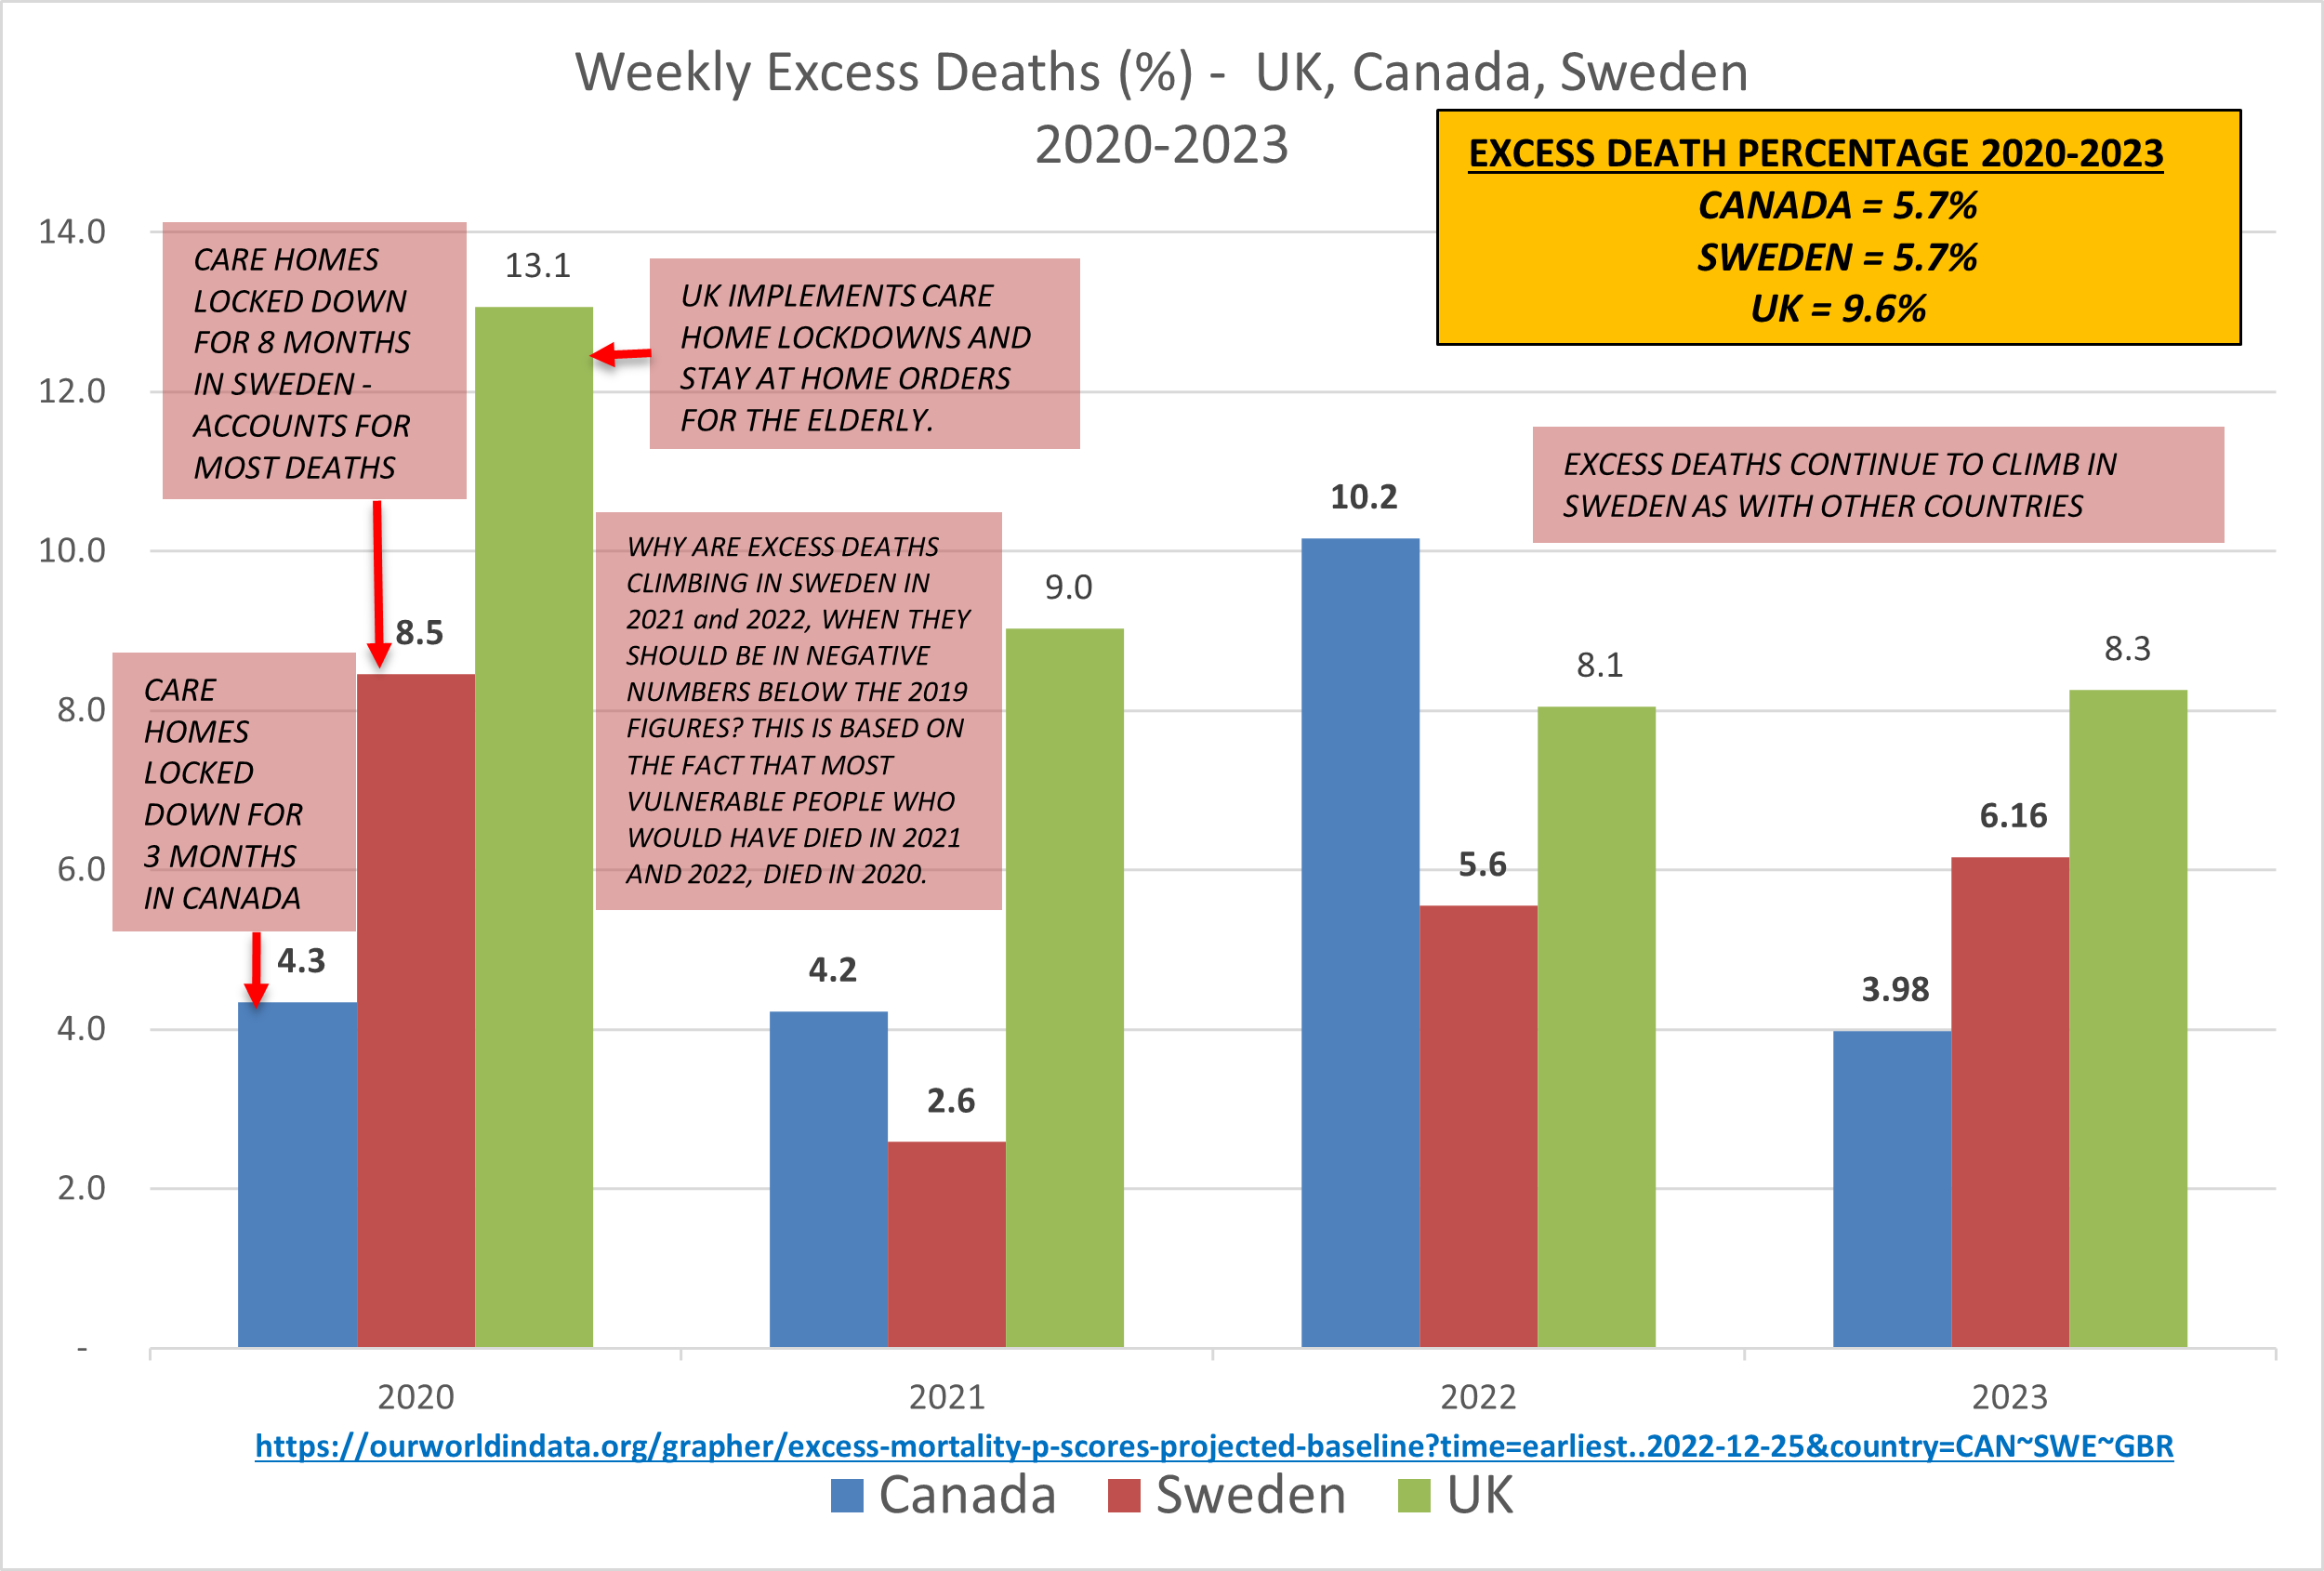
Excess Deaths in Sweden were almost double that of Canada, falling between Canada and the UK (4.4%, 8.5% & 13.1% respectively in 2020).
The UK implemented Care Home lockdowns and stay at home orders for the elderly, causing a larger spike in elderly deaths (along with other deadly protocols - #MidazolamMatt).
That is followed by spikes in Excess Deaths after vaccination programs.
Sweden has a lower rate of vaccination than Canada (supply issues and does not include those under 12, whereas Canada has vaccinated 6 months and up).
Swedish Excess Death rate in 2020 is double Canada due to a longer total ban on ANYONE accessing Care Homes (8 months vs. 3 months in Canada).
WHY ARE EXCESS DEATHS CLIMBING IN SWEDEN IN 2021, 2022, 2023 and 2024 WHEN THEY SHOULD BE IN NEGATIVE NUMBERS BELOW THE 2019 FIGURES?
THIS IS BASED ON THE FACT THAT MOST VULNERABLE PEOPLE WHO WOULD HAVE DIED IN 2021, 2022, and 2023 DIED IN 2020.
And is Sweden is so wonderful, why has EMIGRATION suddenly spiked in 2024?
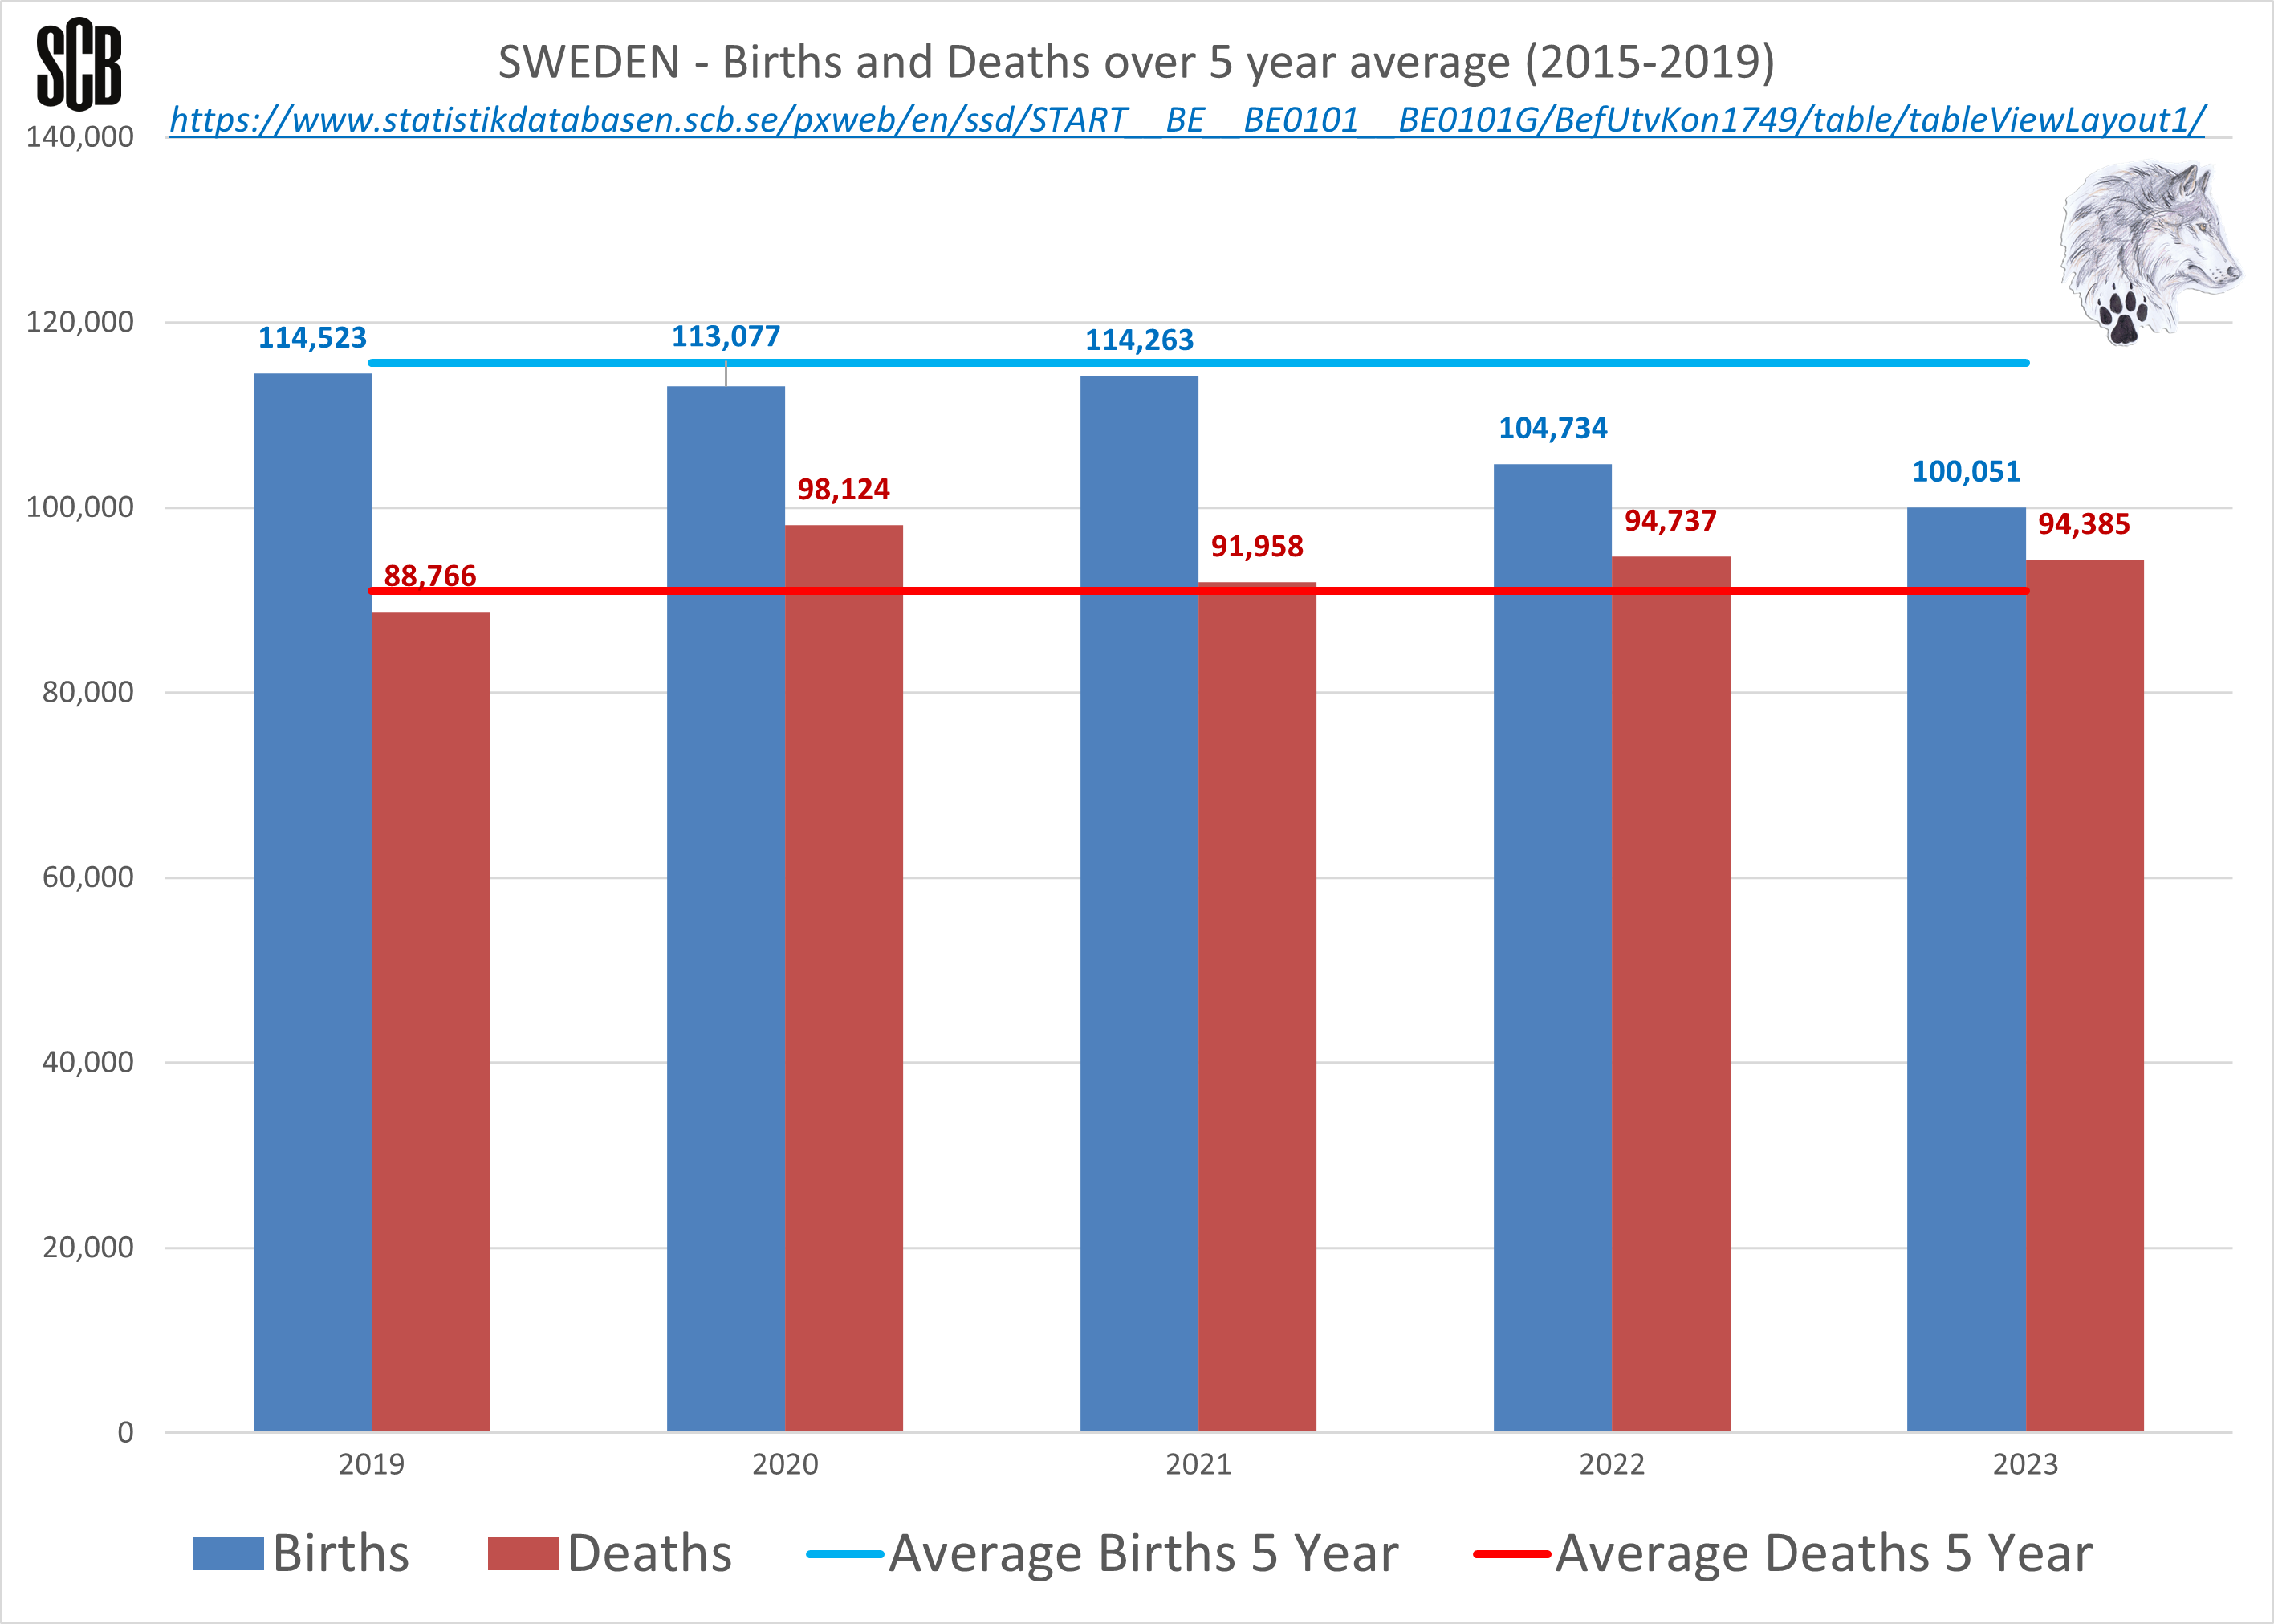
October 2024 UPDATE FOR SWEDEN.
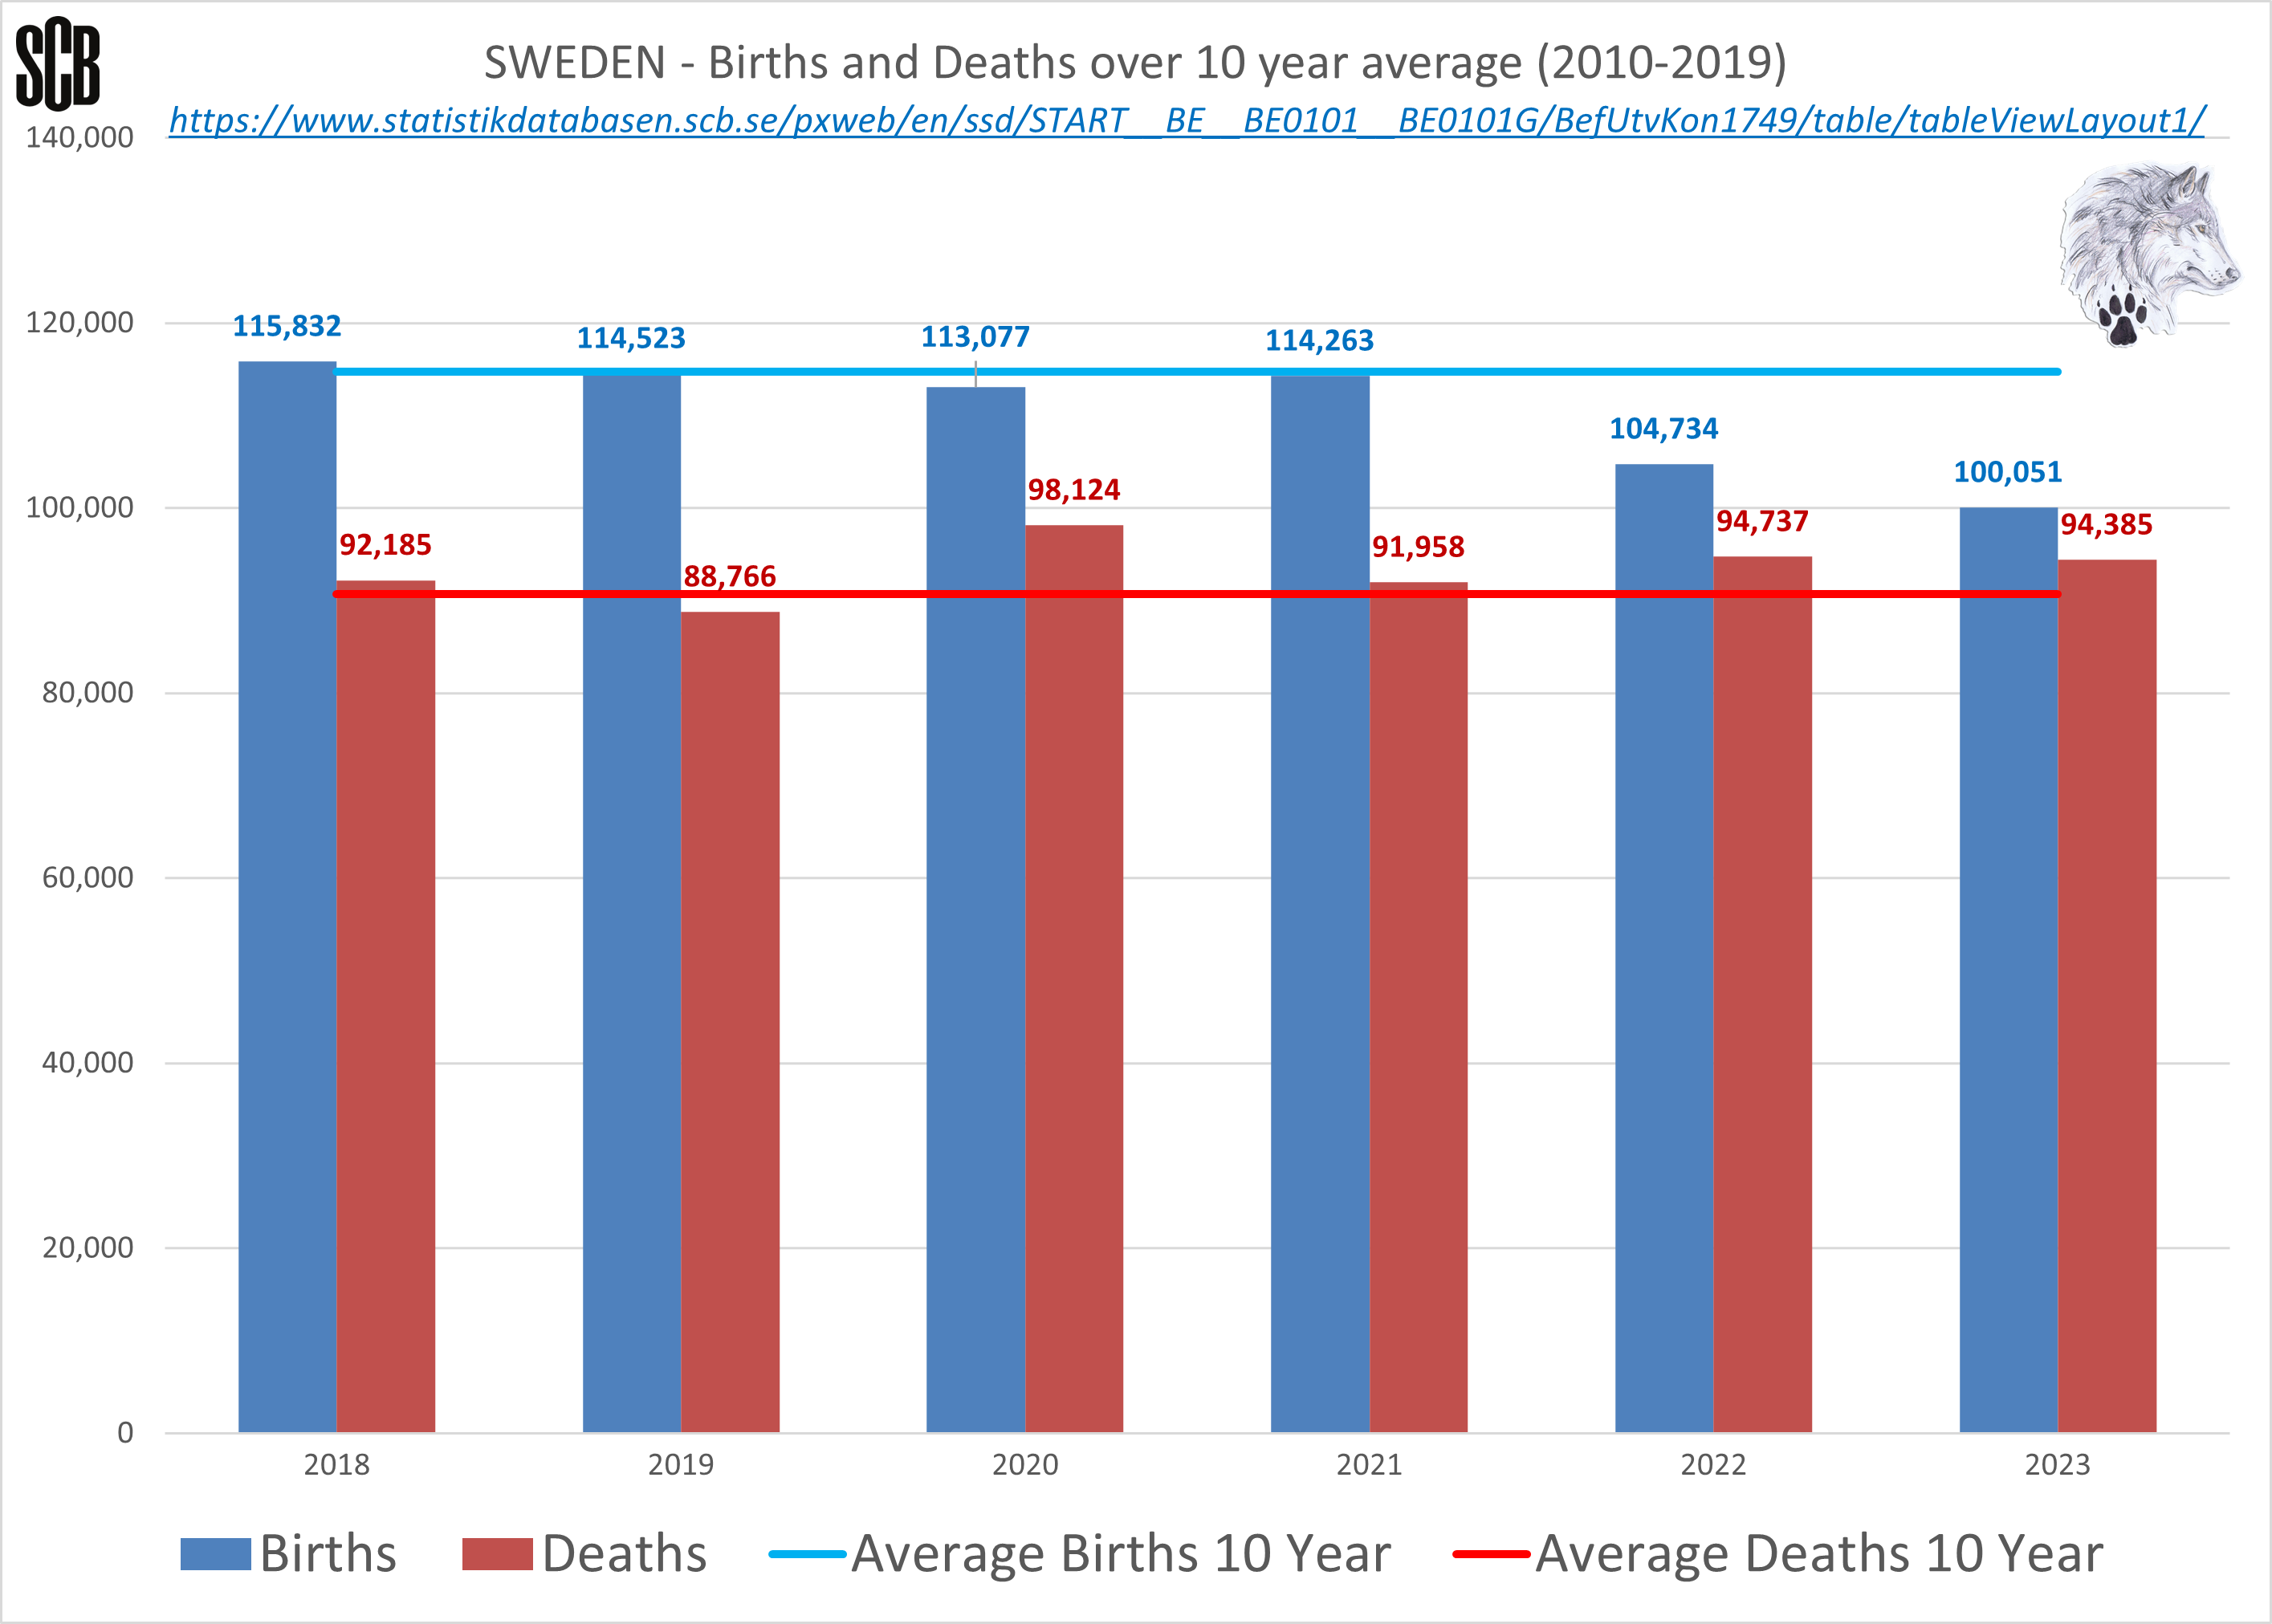
Births plummeting since 2020 and deaths continue to rise at the same rate as 2022.
Now the gap between new births and deaths is almost zero. THIS IS THE DEATH OF A NATION.
2023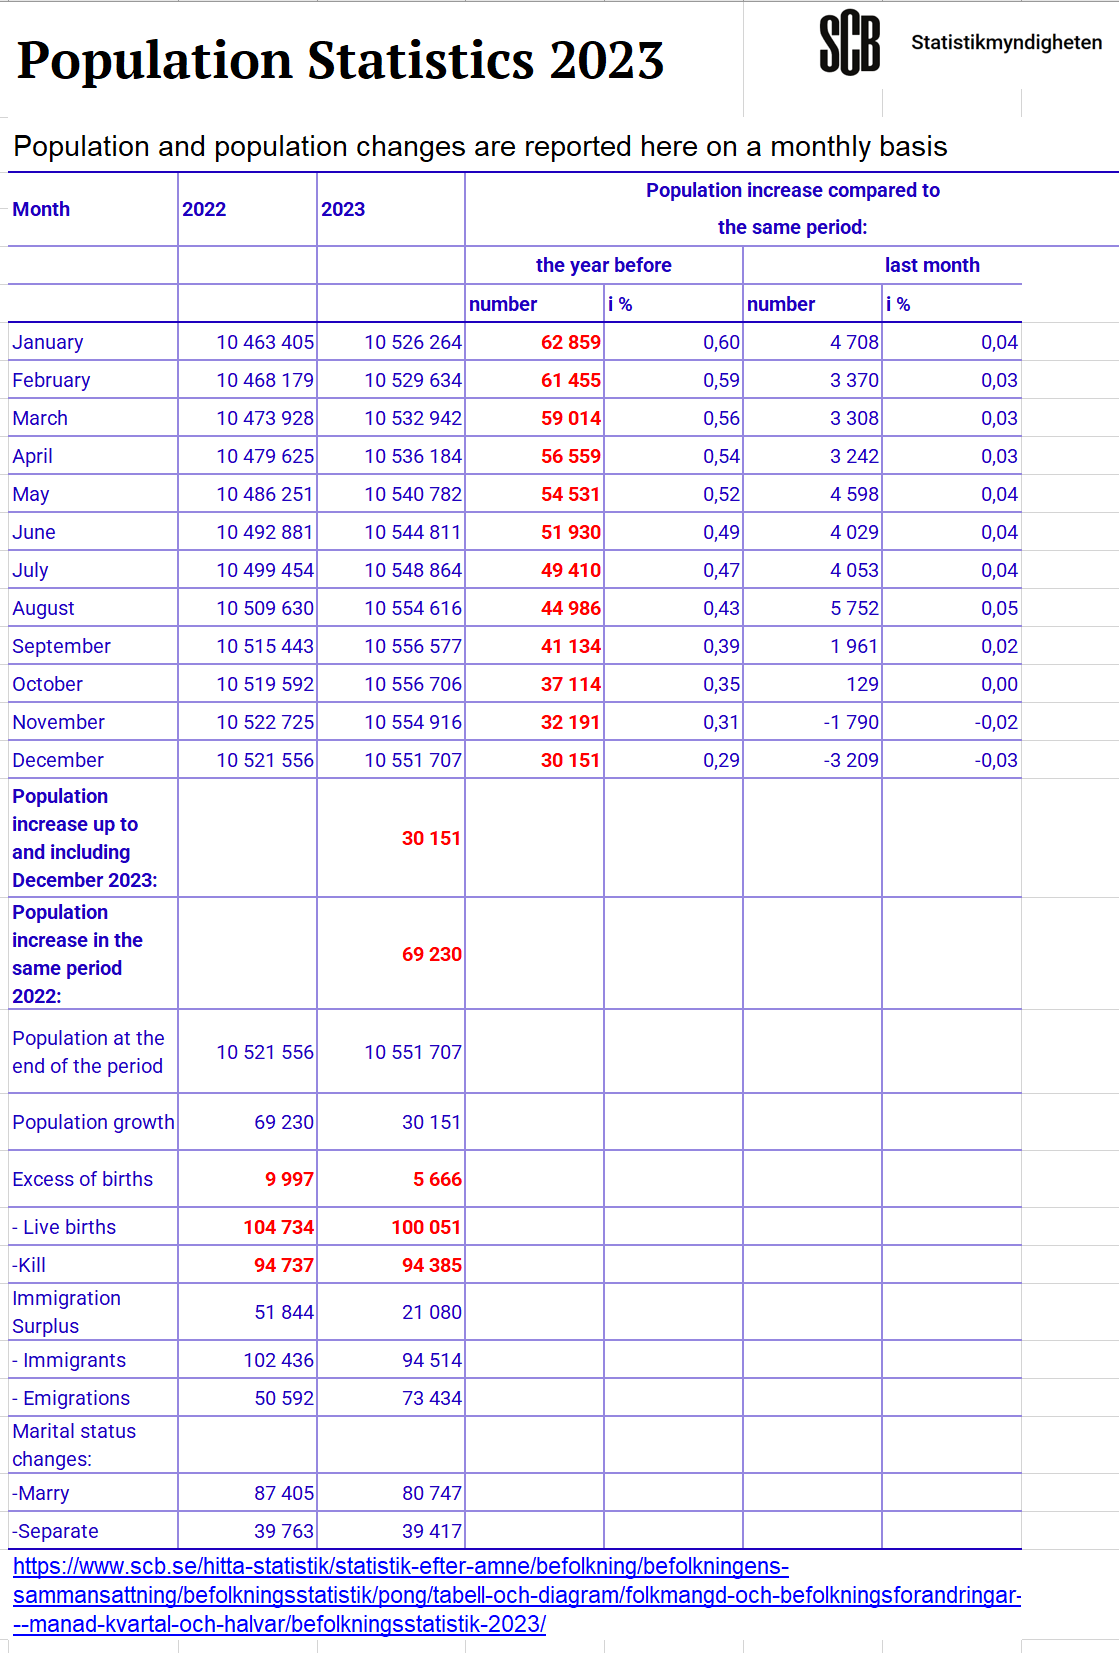 |
2024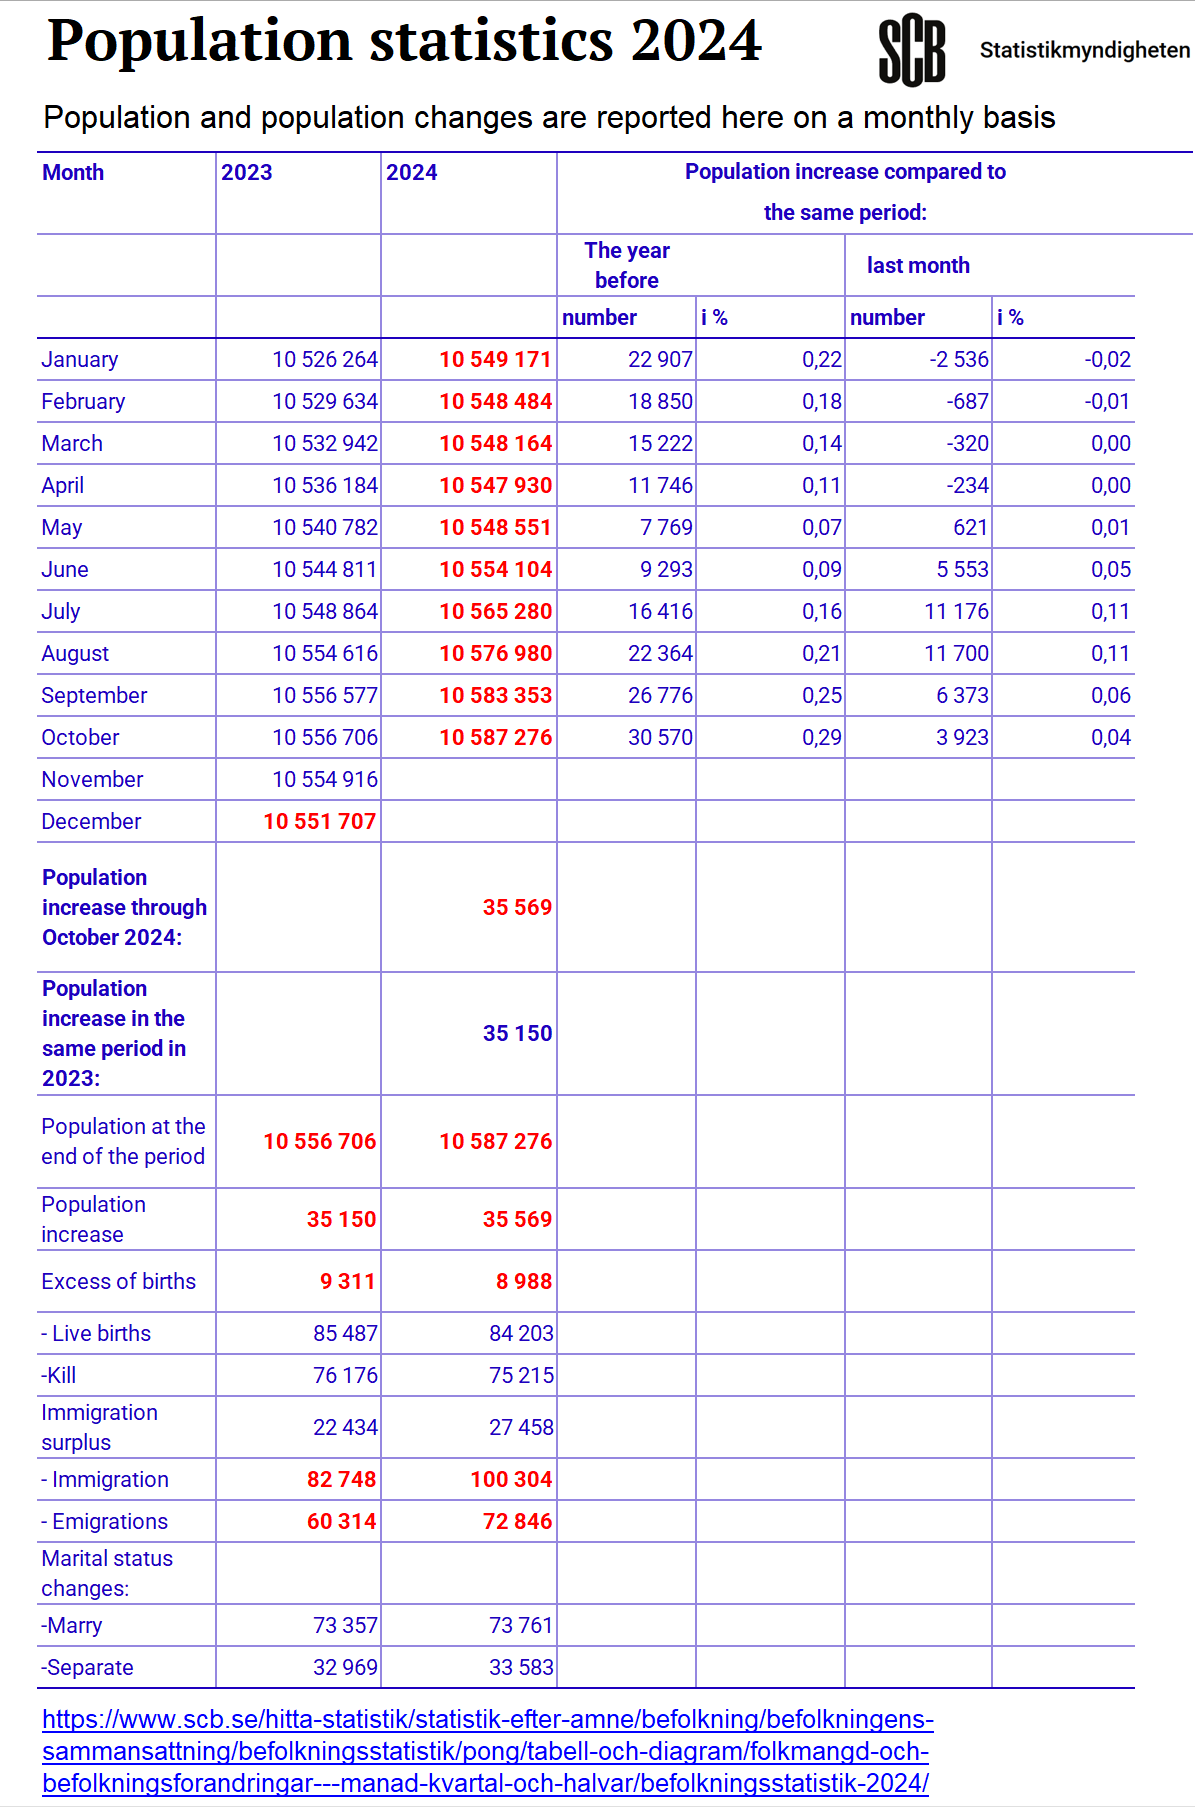 |
Births and Deaths - SWEDEN 2018-2024
 |
 |
Sweden has an overall (average) identical excess death rate to Canada from 2020-2022. >5%. (note this is increasing in both countries based on the latest data - currently being updated)
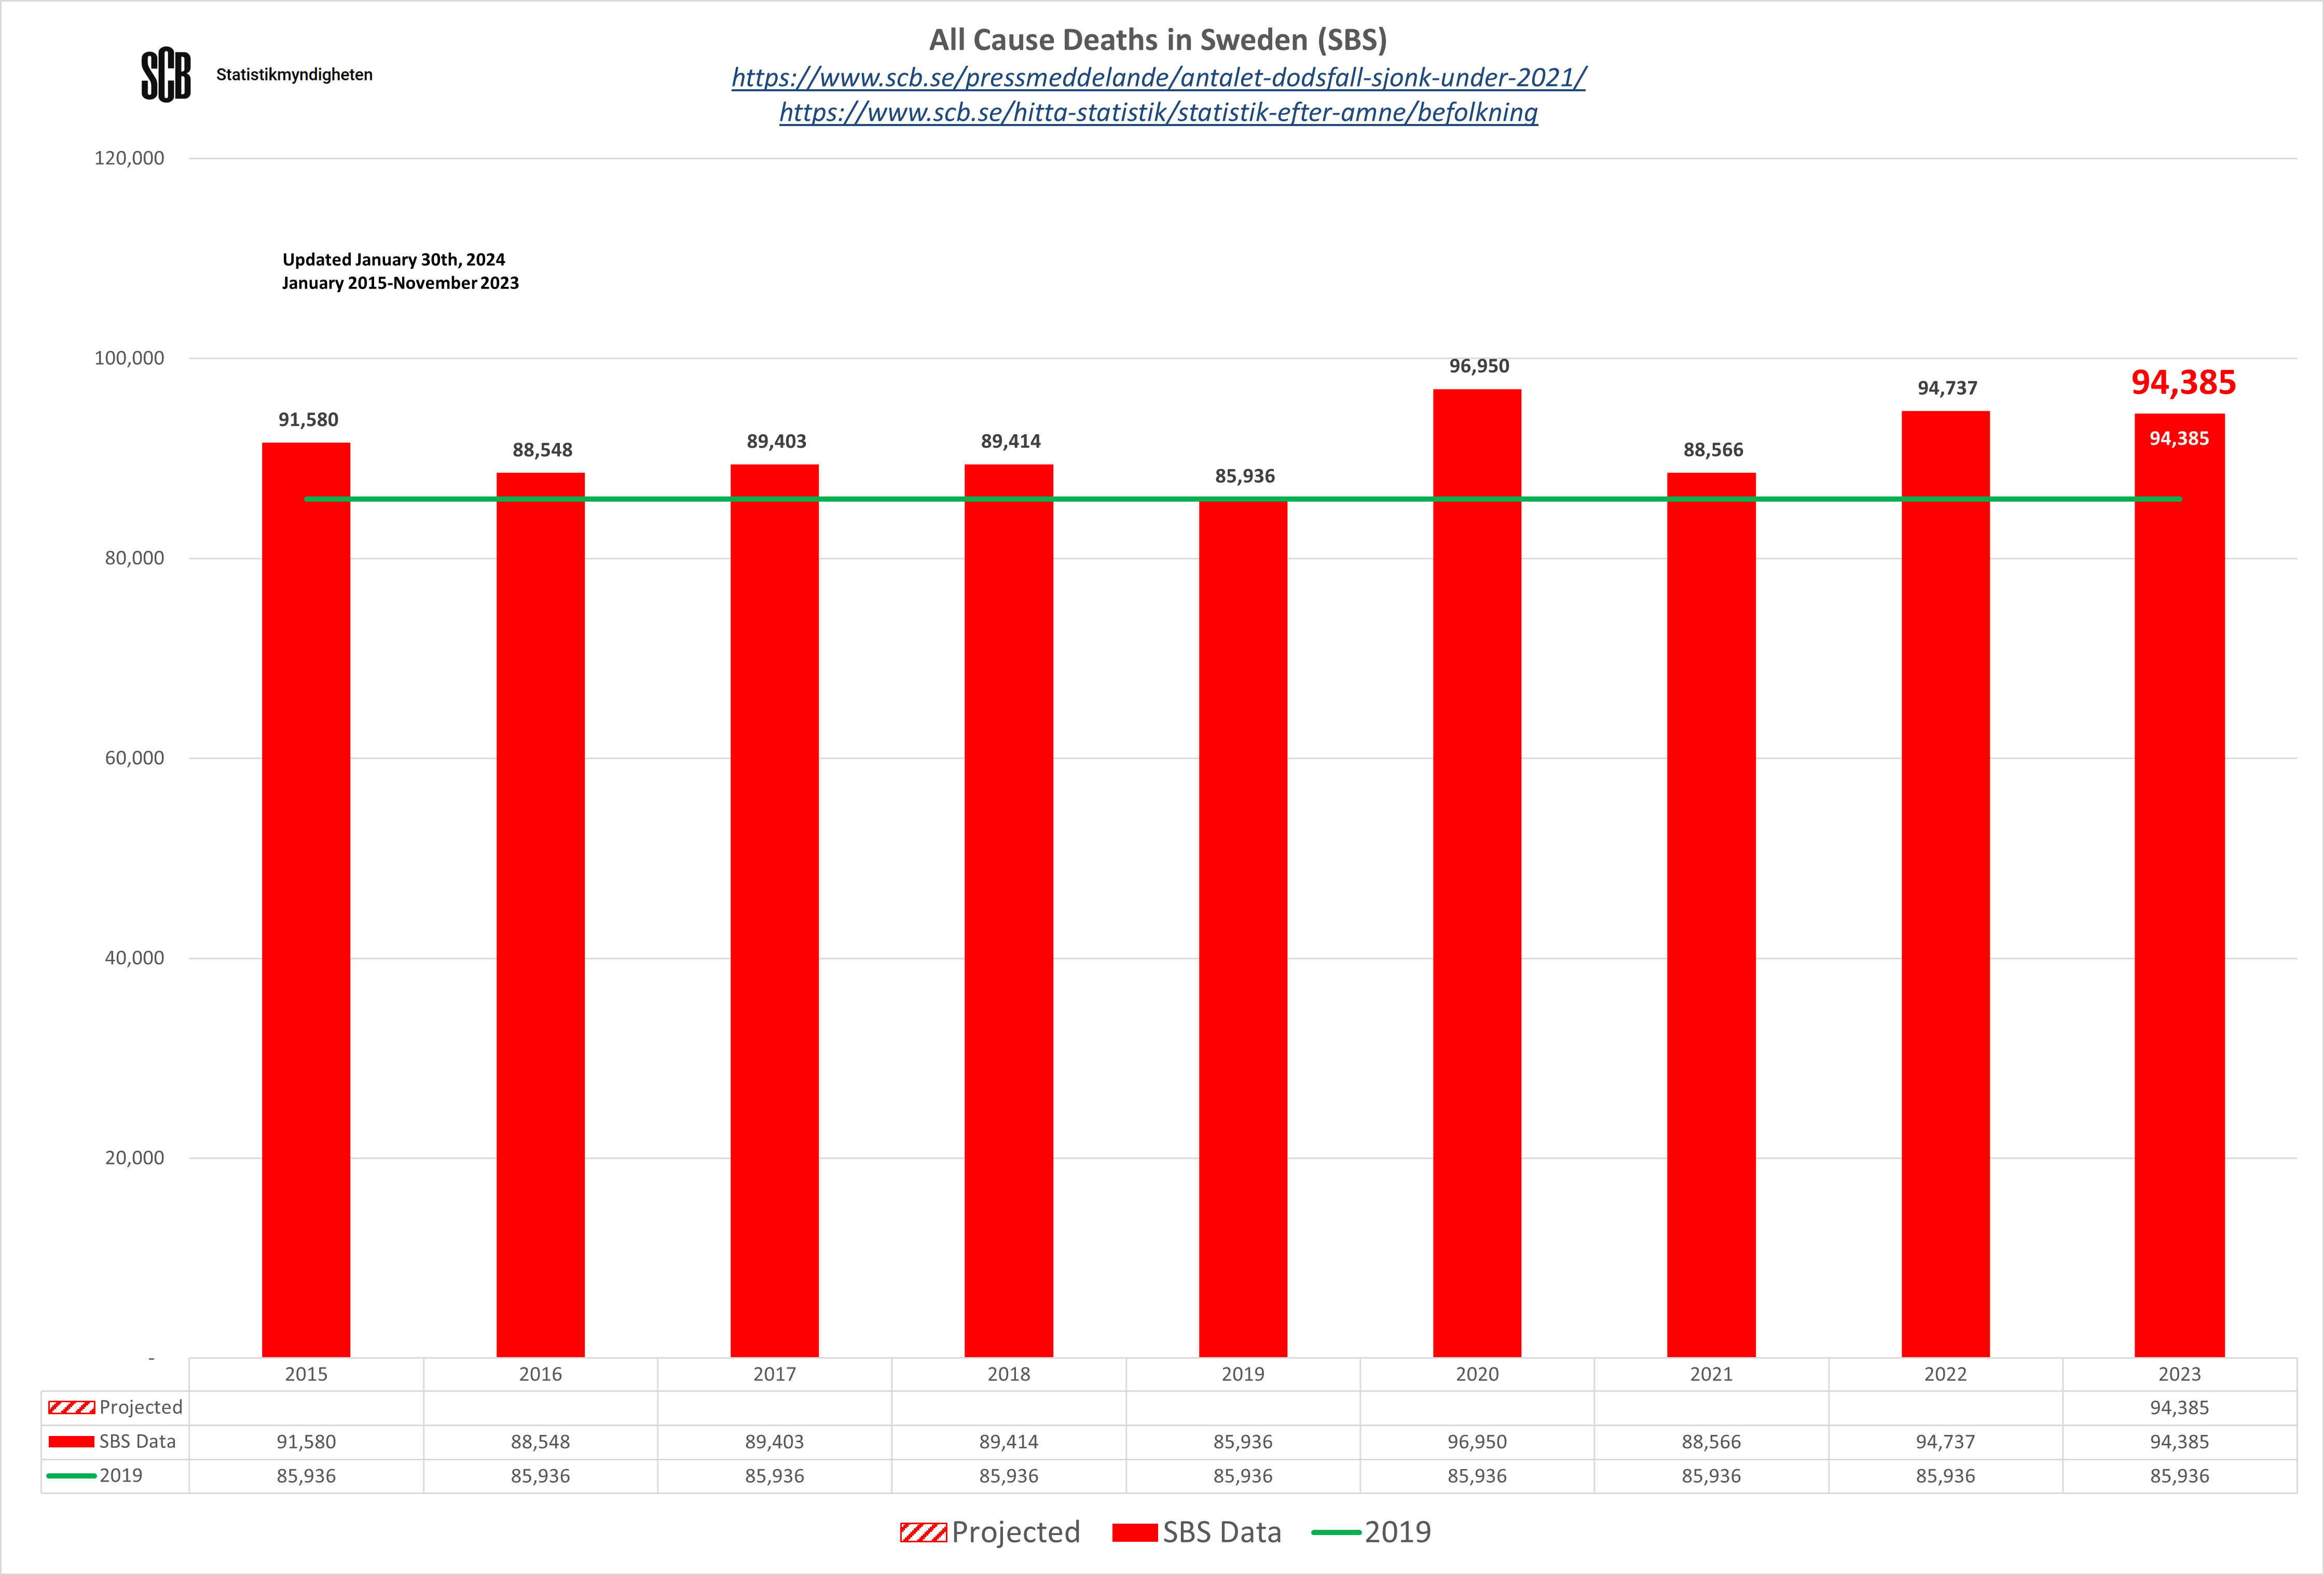
Sweden Data SBS
SBS Data
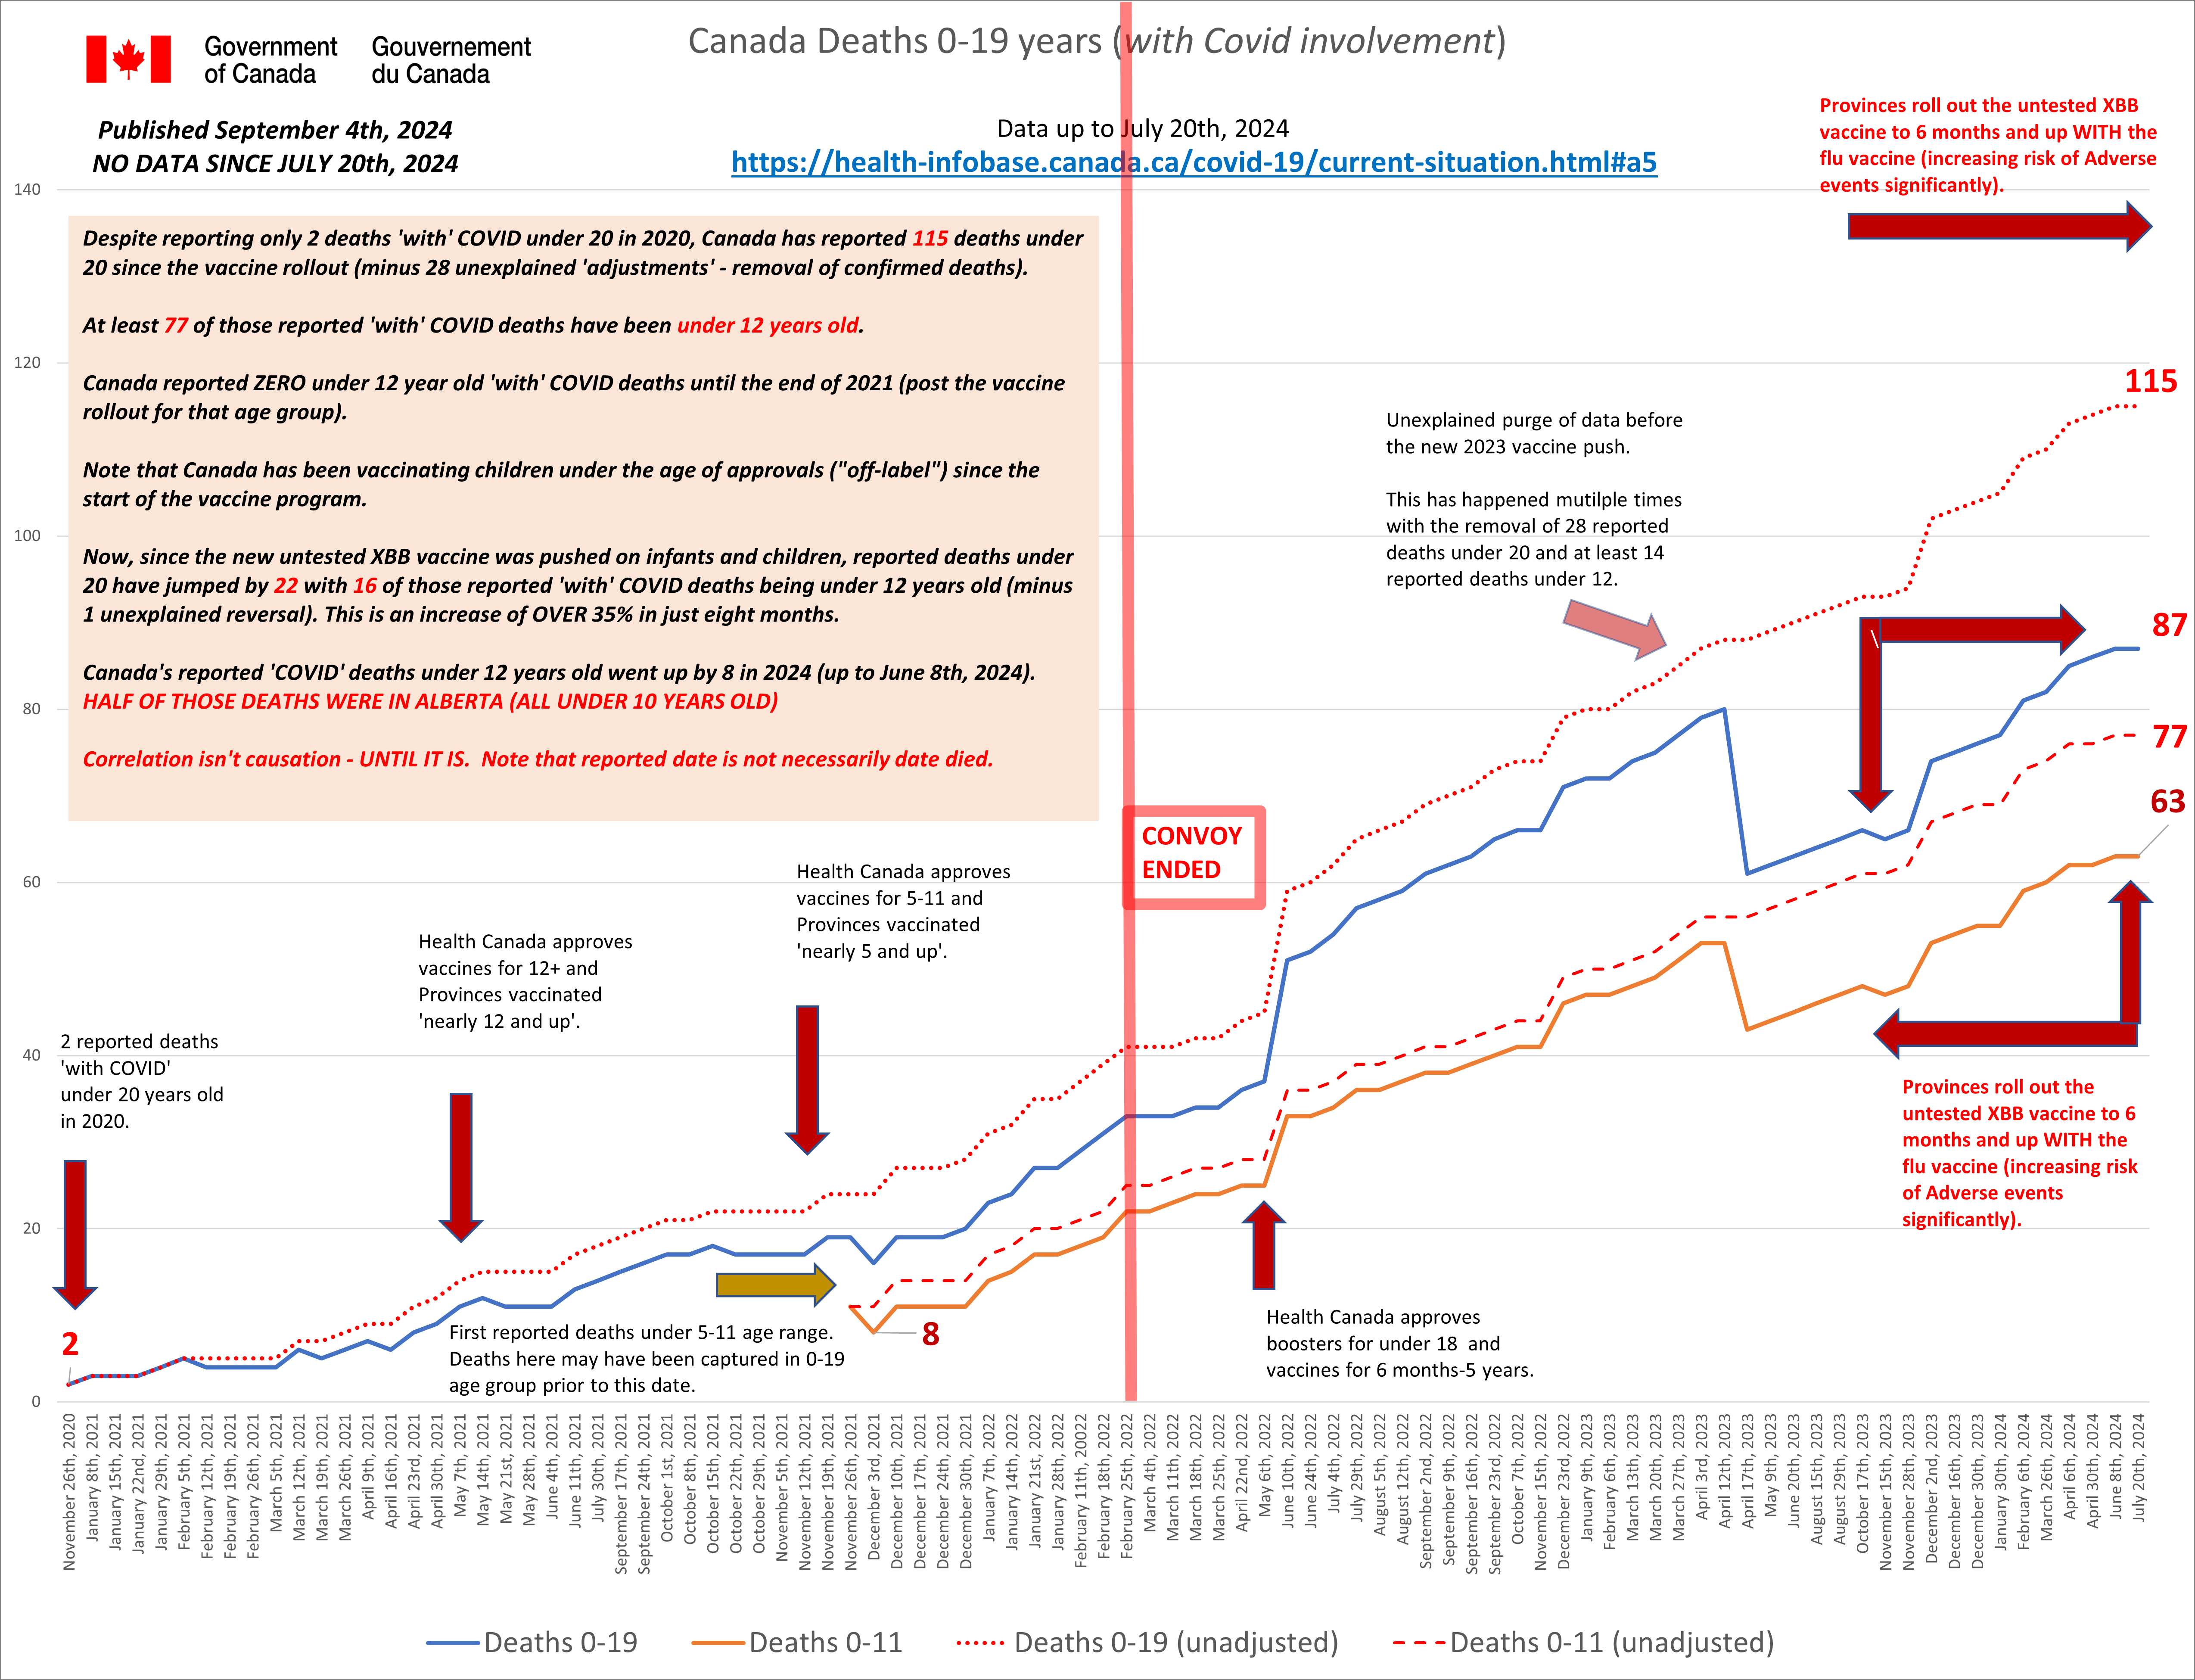
Under 20's 'WITH' COVID - Deaths Reported by Date - Latest update March 26th, 2024
Canada - Reported COVID Deaths by Age.
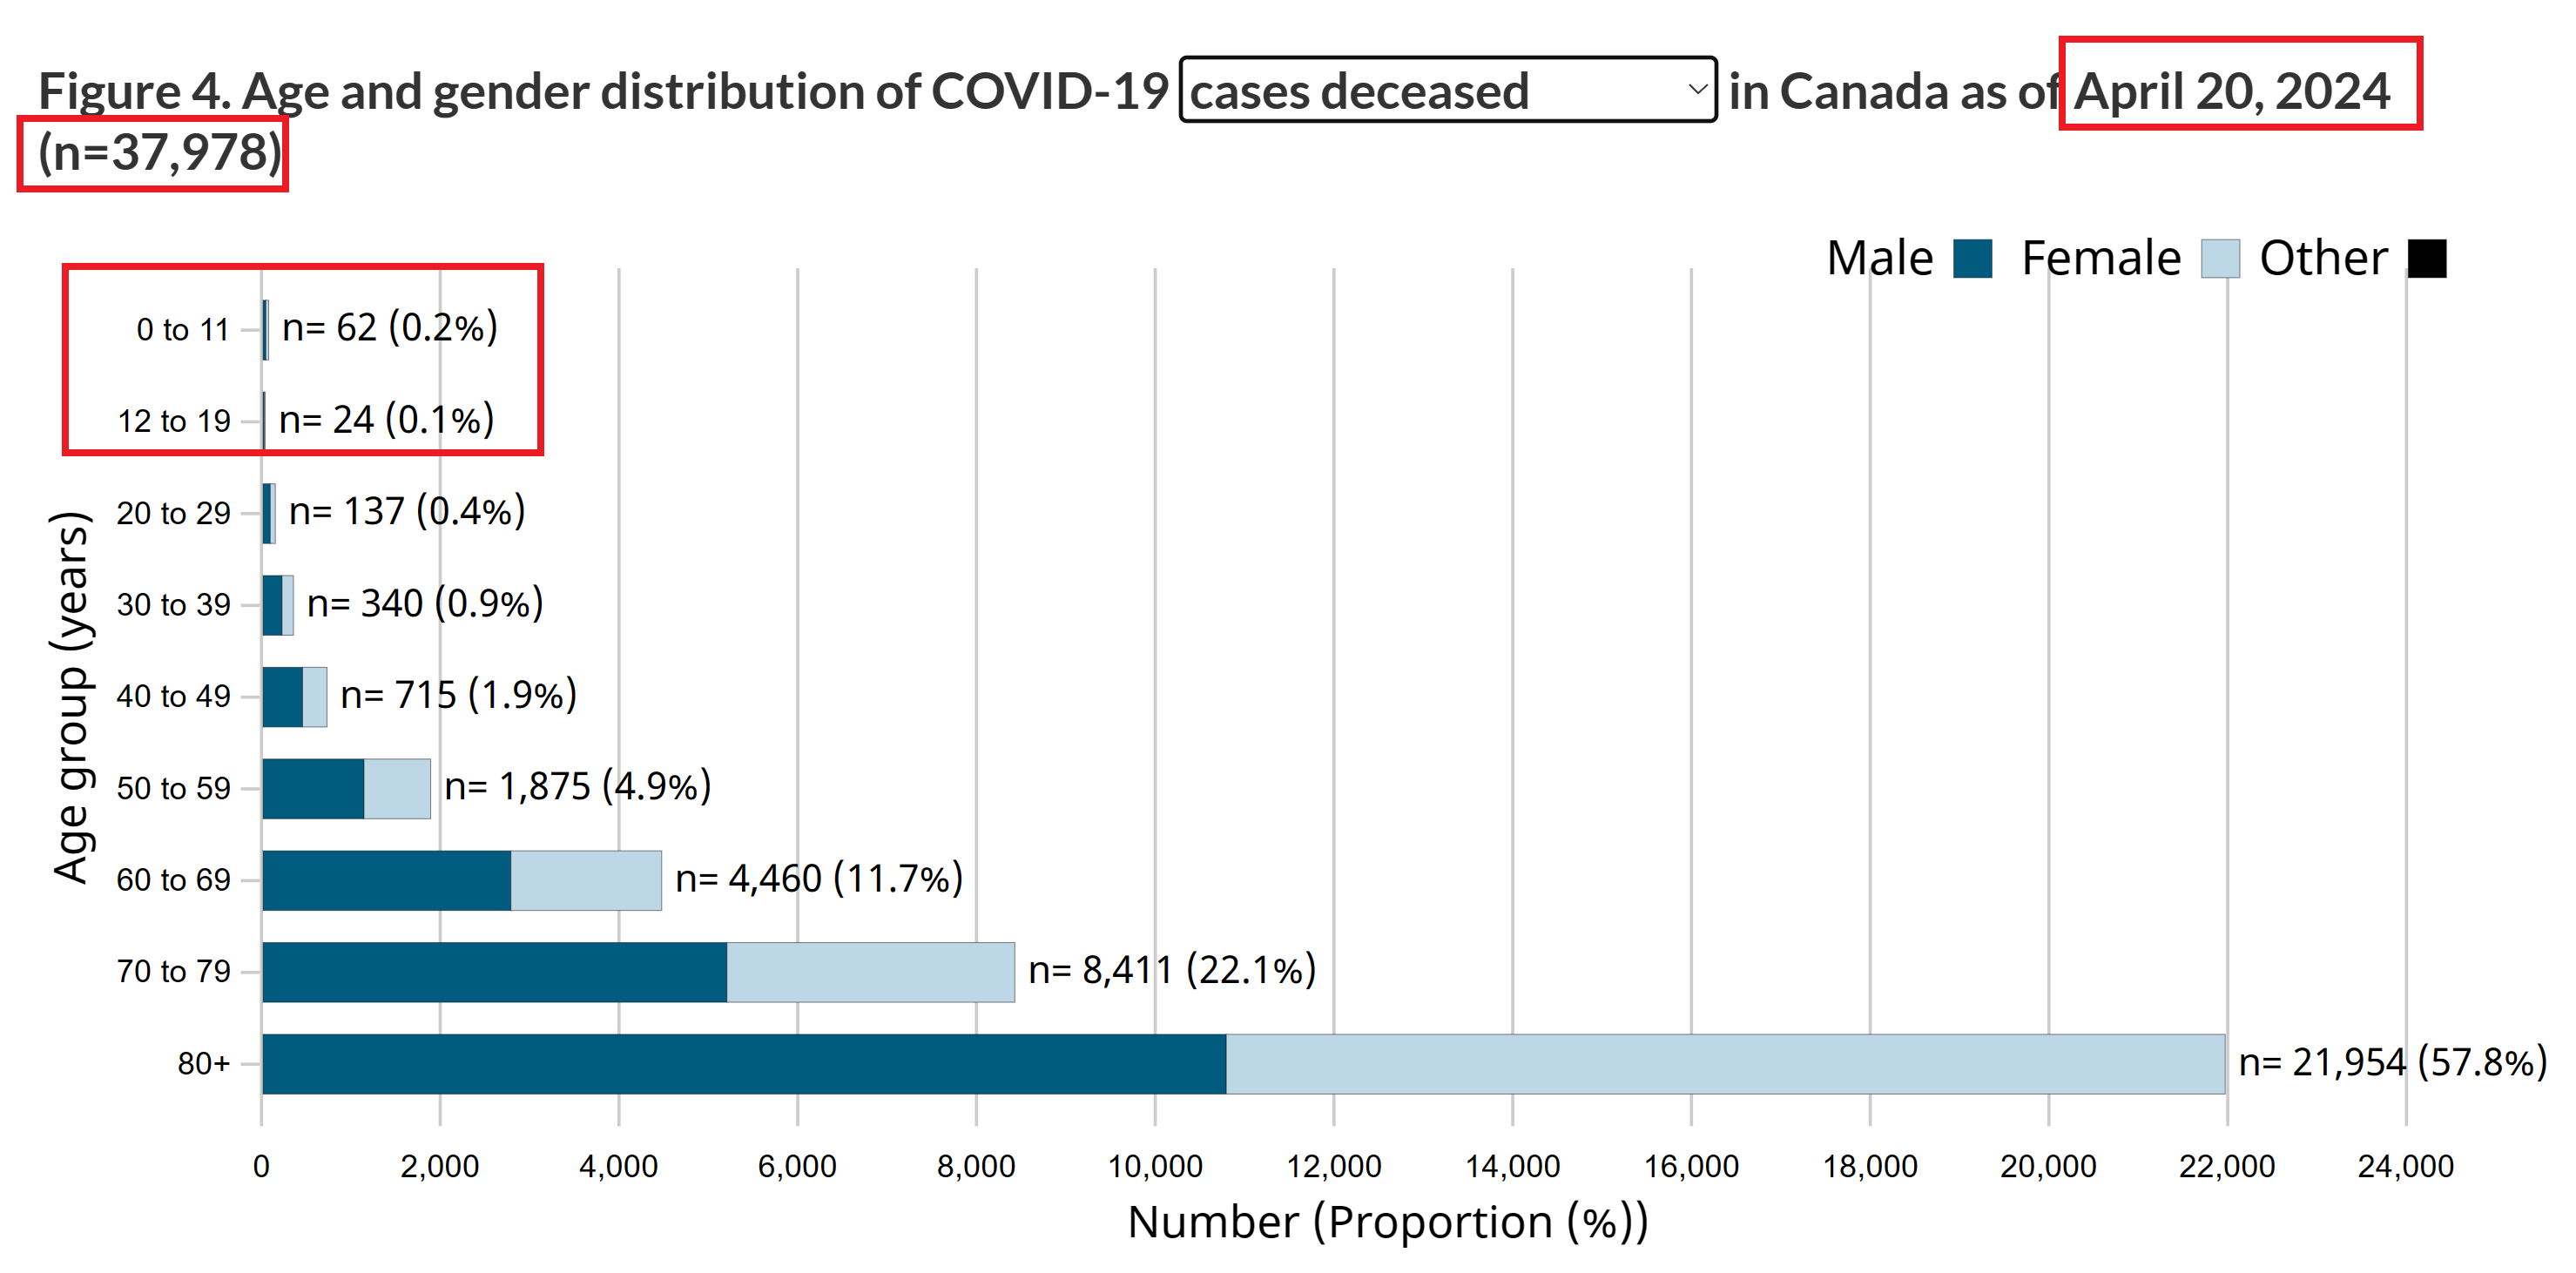
Now take all of that information and add in the PROVABLE lies about the Cases and Deaths 'with' COVID at the start.
This was and is criminal.
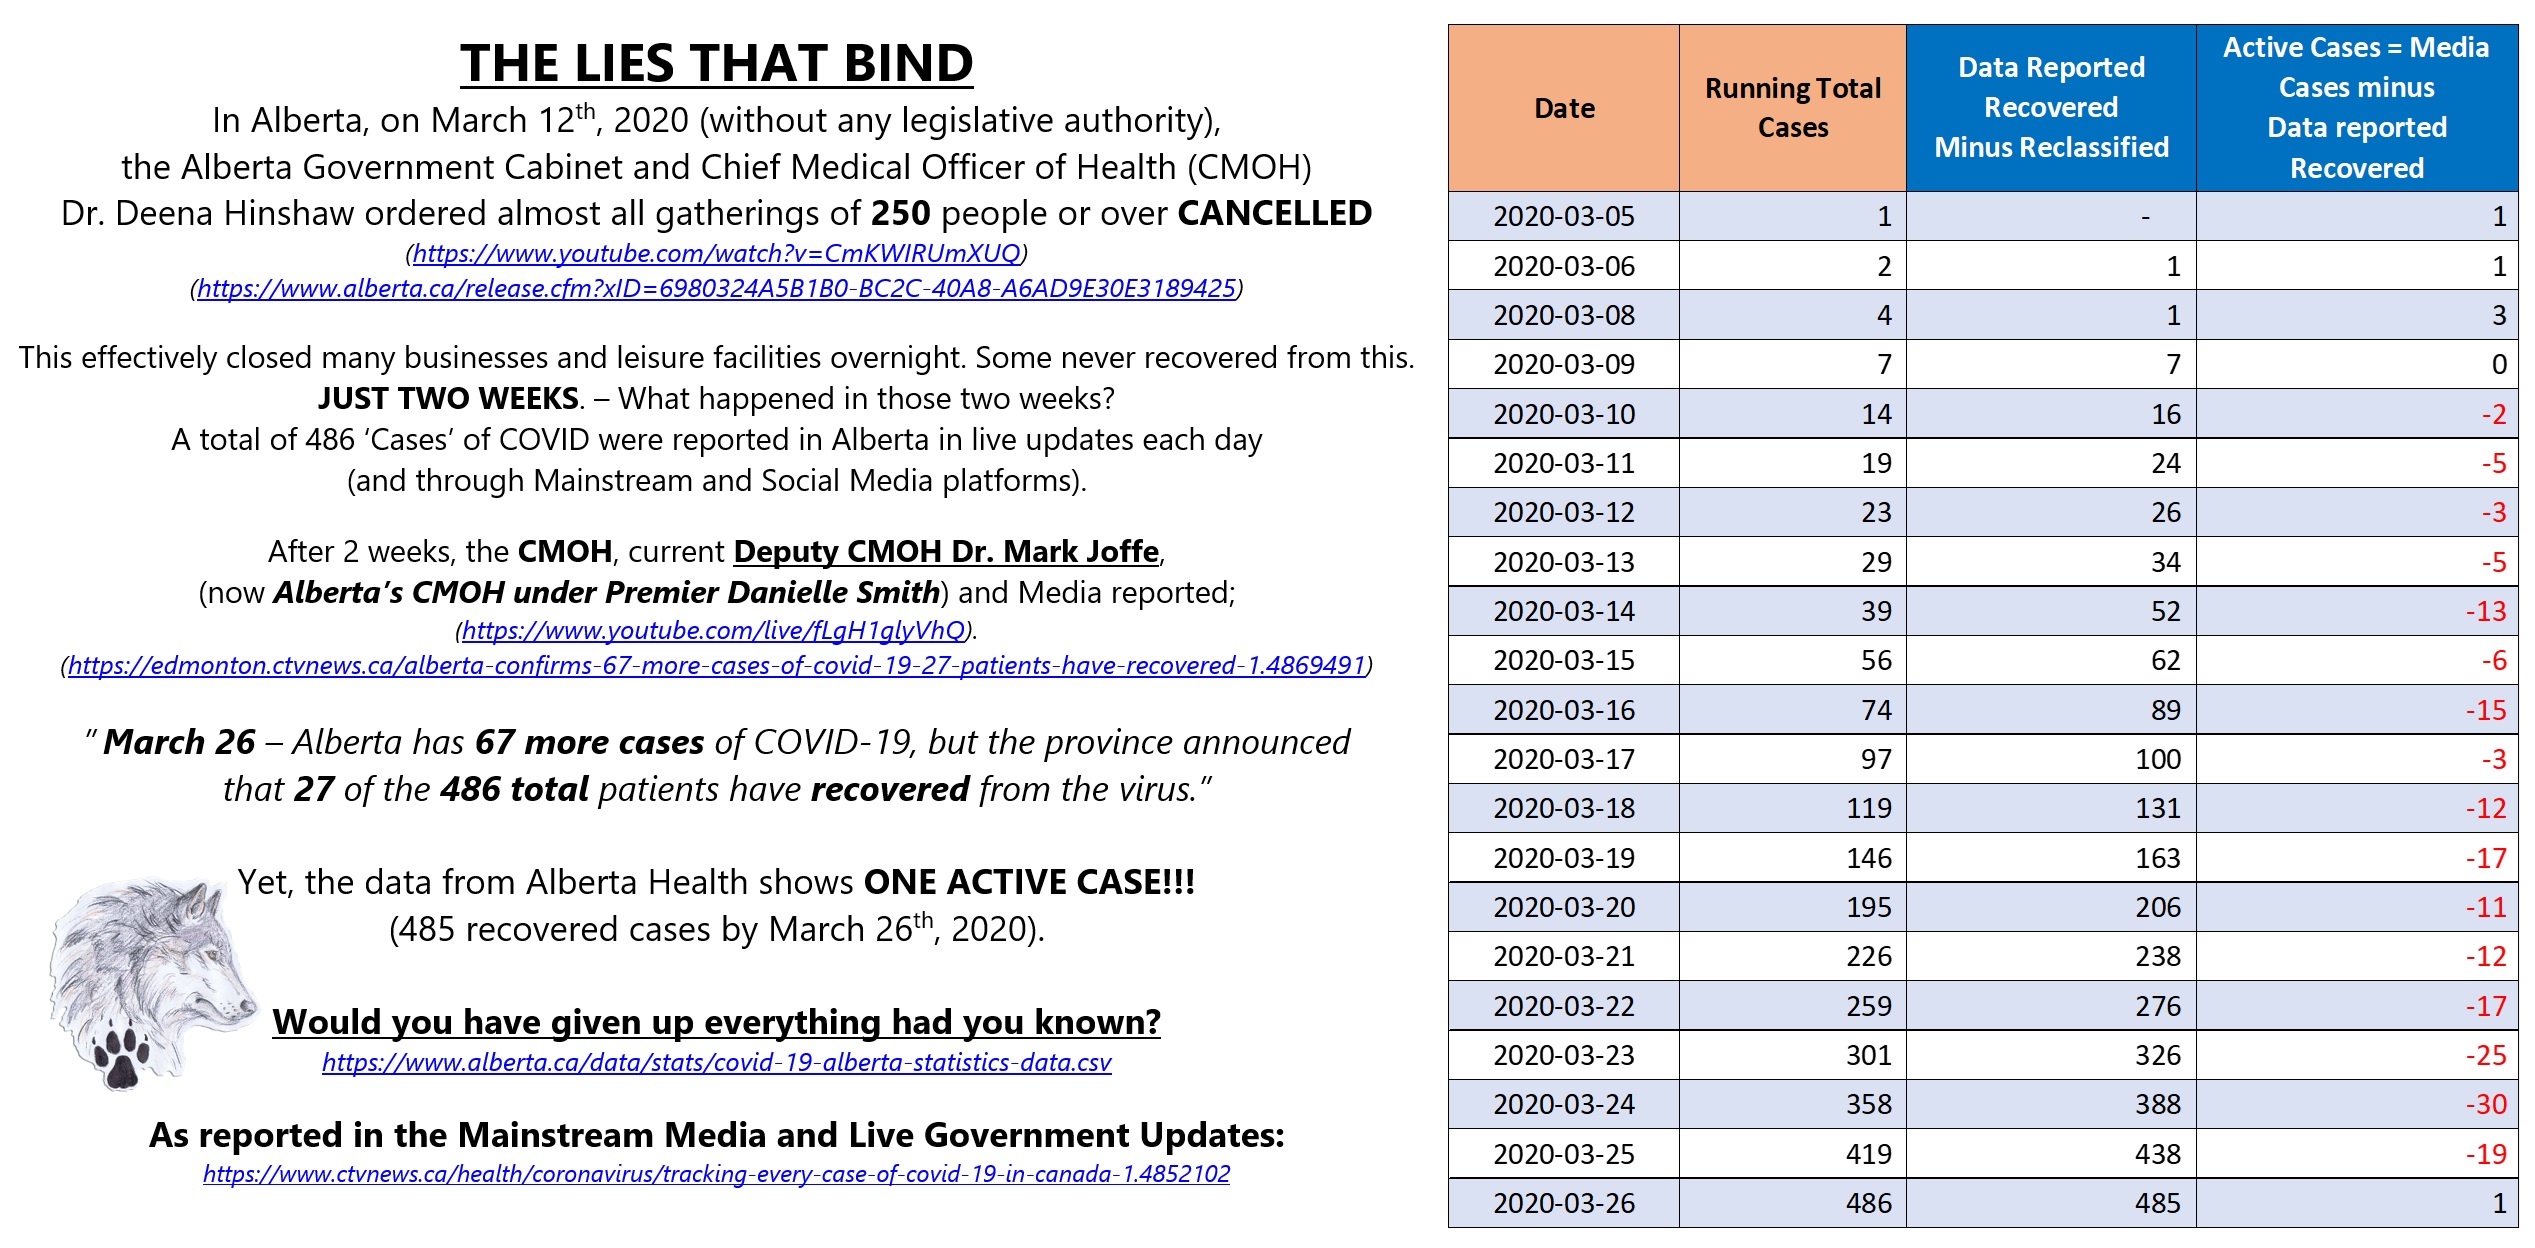
THE LIES THAT BIND - JUST TWO WEEKS
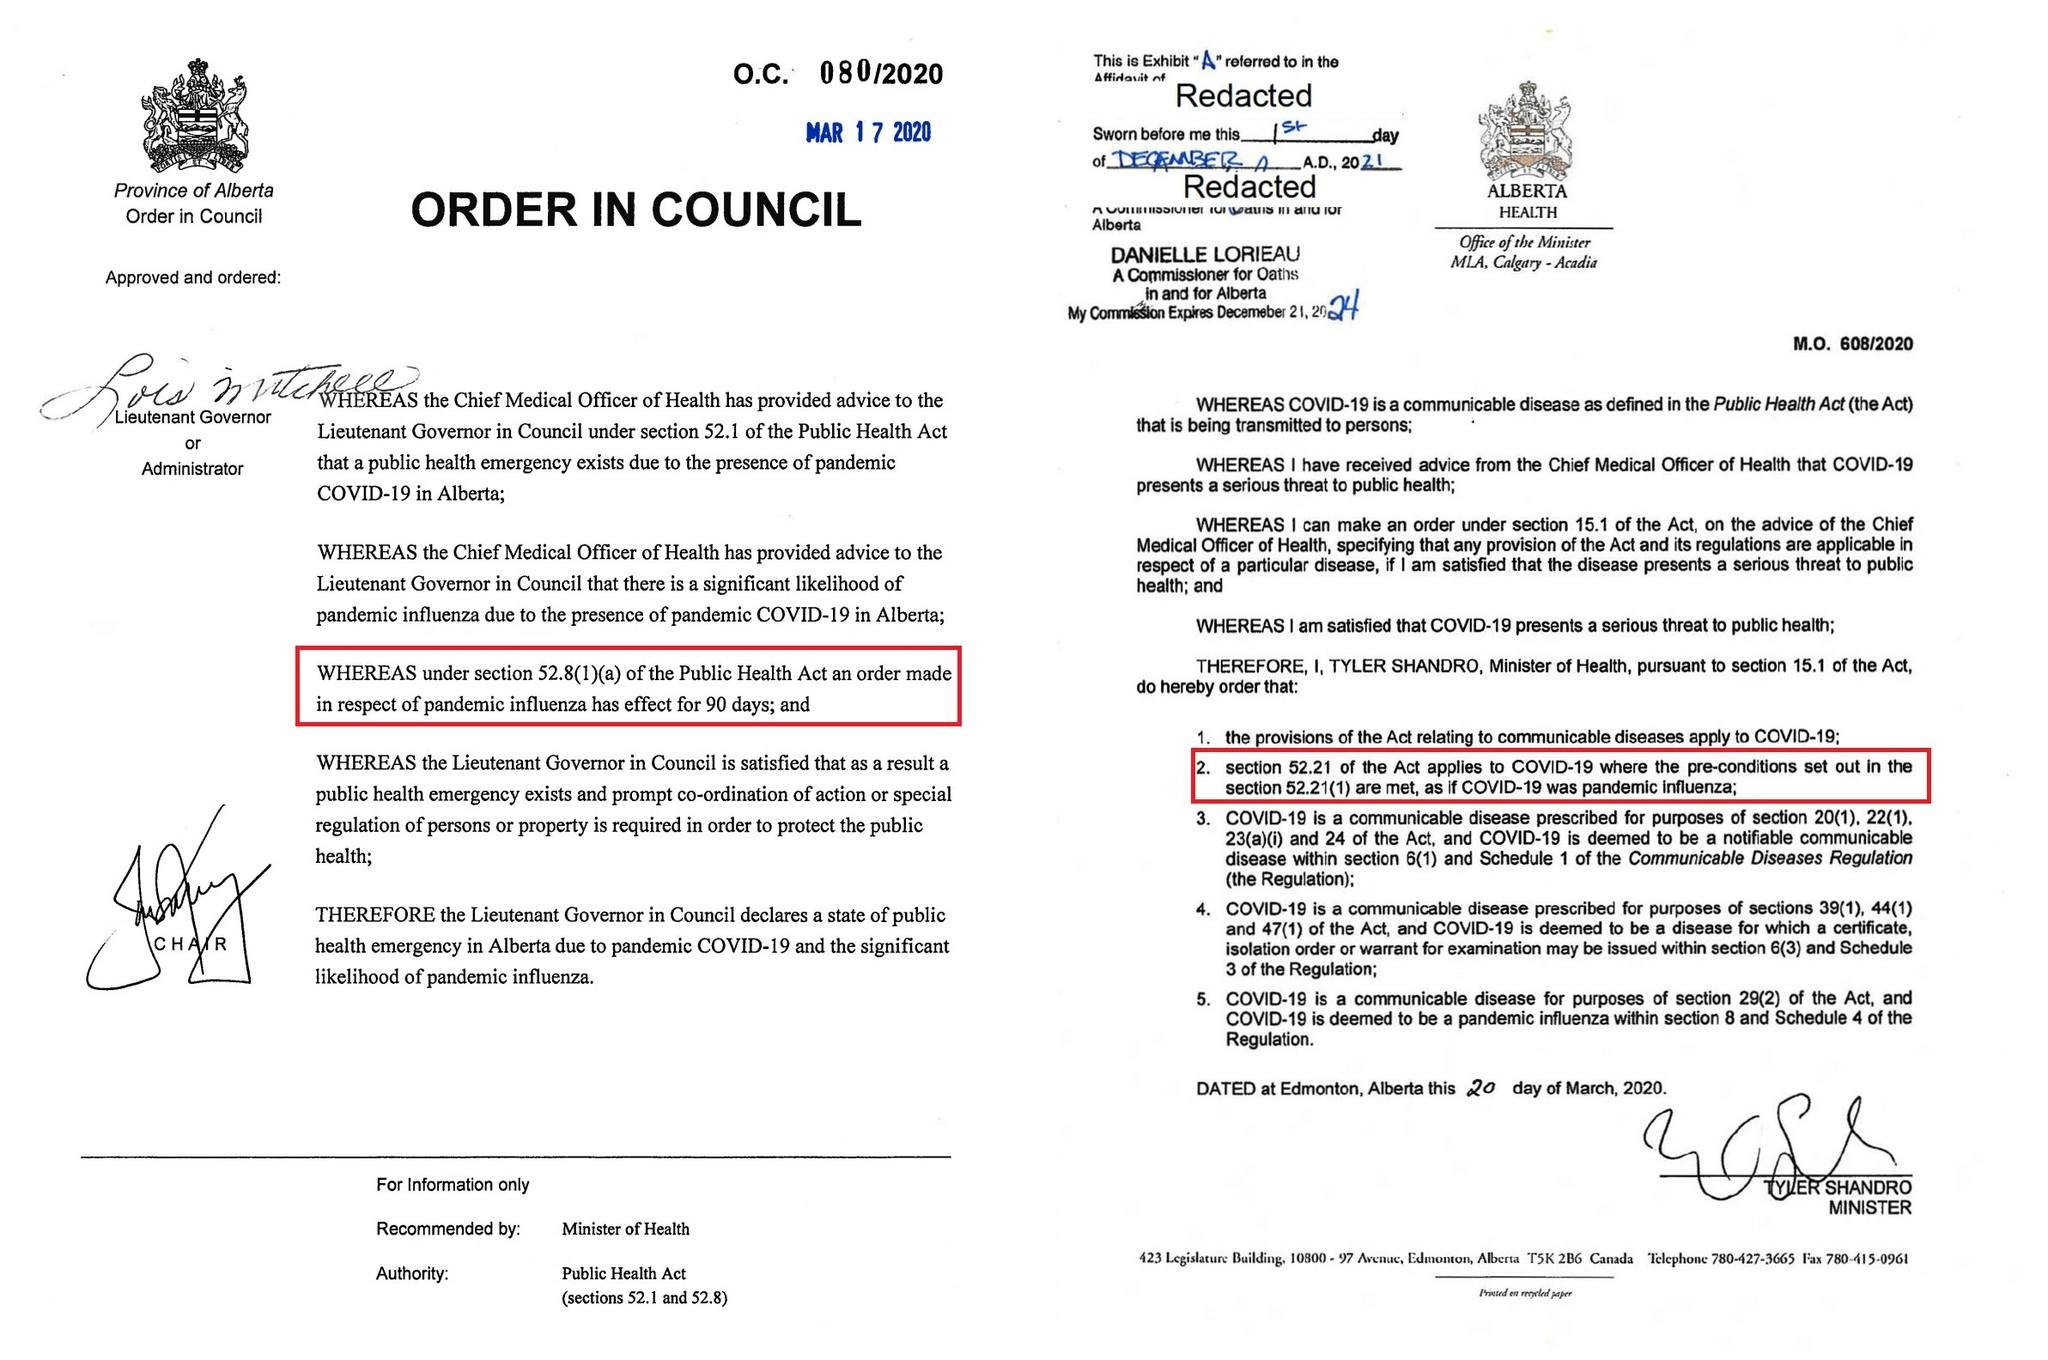
In Alberta, on March 12th, 2020 (
without any legislative authority [link]), the Alberta Government Cabinet and Chief Medical Officer of Health (CMOH) Dr. Deena Hinshaw ordered almost all gatherings of
250 people or over
CANCELLED
(
March 12th, 2020 Alberta COVID press conference live.[link])
(
March 12th, 2020 Alberta COVID press release.[link])
This effectively closed many businesses and leisure facilities overnight. Some never recovered from this.
JUST TWO WEEKS. - What happened in those two weeks?
A total of
486 'Cases' of COVID were reported in Alberta in live updates each day (and through Mainstream and Social Media platforms).
After 2 weeks, the CMOH, current
Deputy CMOH Dr. Mark Joffe, (now Alberta's CMOH under Premier Danielle Smith) and the Media reported;
"March 26 - Alberta has 67 more cases of COVID-19,
but the province announced that 27 of the 486 total patients have recovered from the virus."
(
March 26th, 2020 Alberta COVID press conference live.[link]).
(
March 26th, 2020 Alberta COVID CTV reporting.[link])
The data from Alberta Health shows
ONE ACTIVE CASE!!!
(485 recovered cases by March 26th, 2020).
Would you have given up everything had you known?
Worse than that, the data shows NEGATIVE Cases at the time.
Now do you understand why we need a POLICE INVESTIGATION, not a Government cover up?
back to top of page
back to top of page
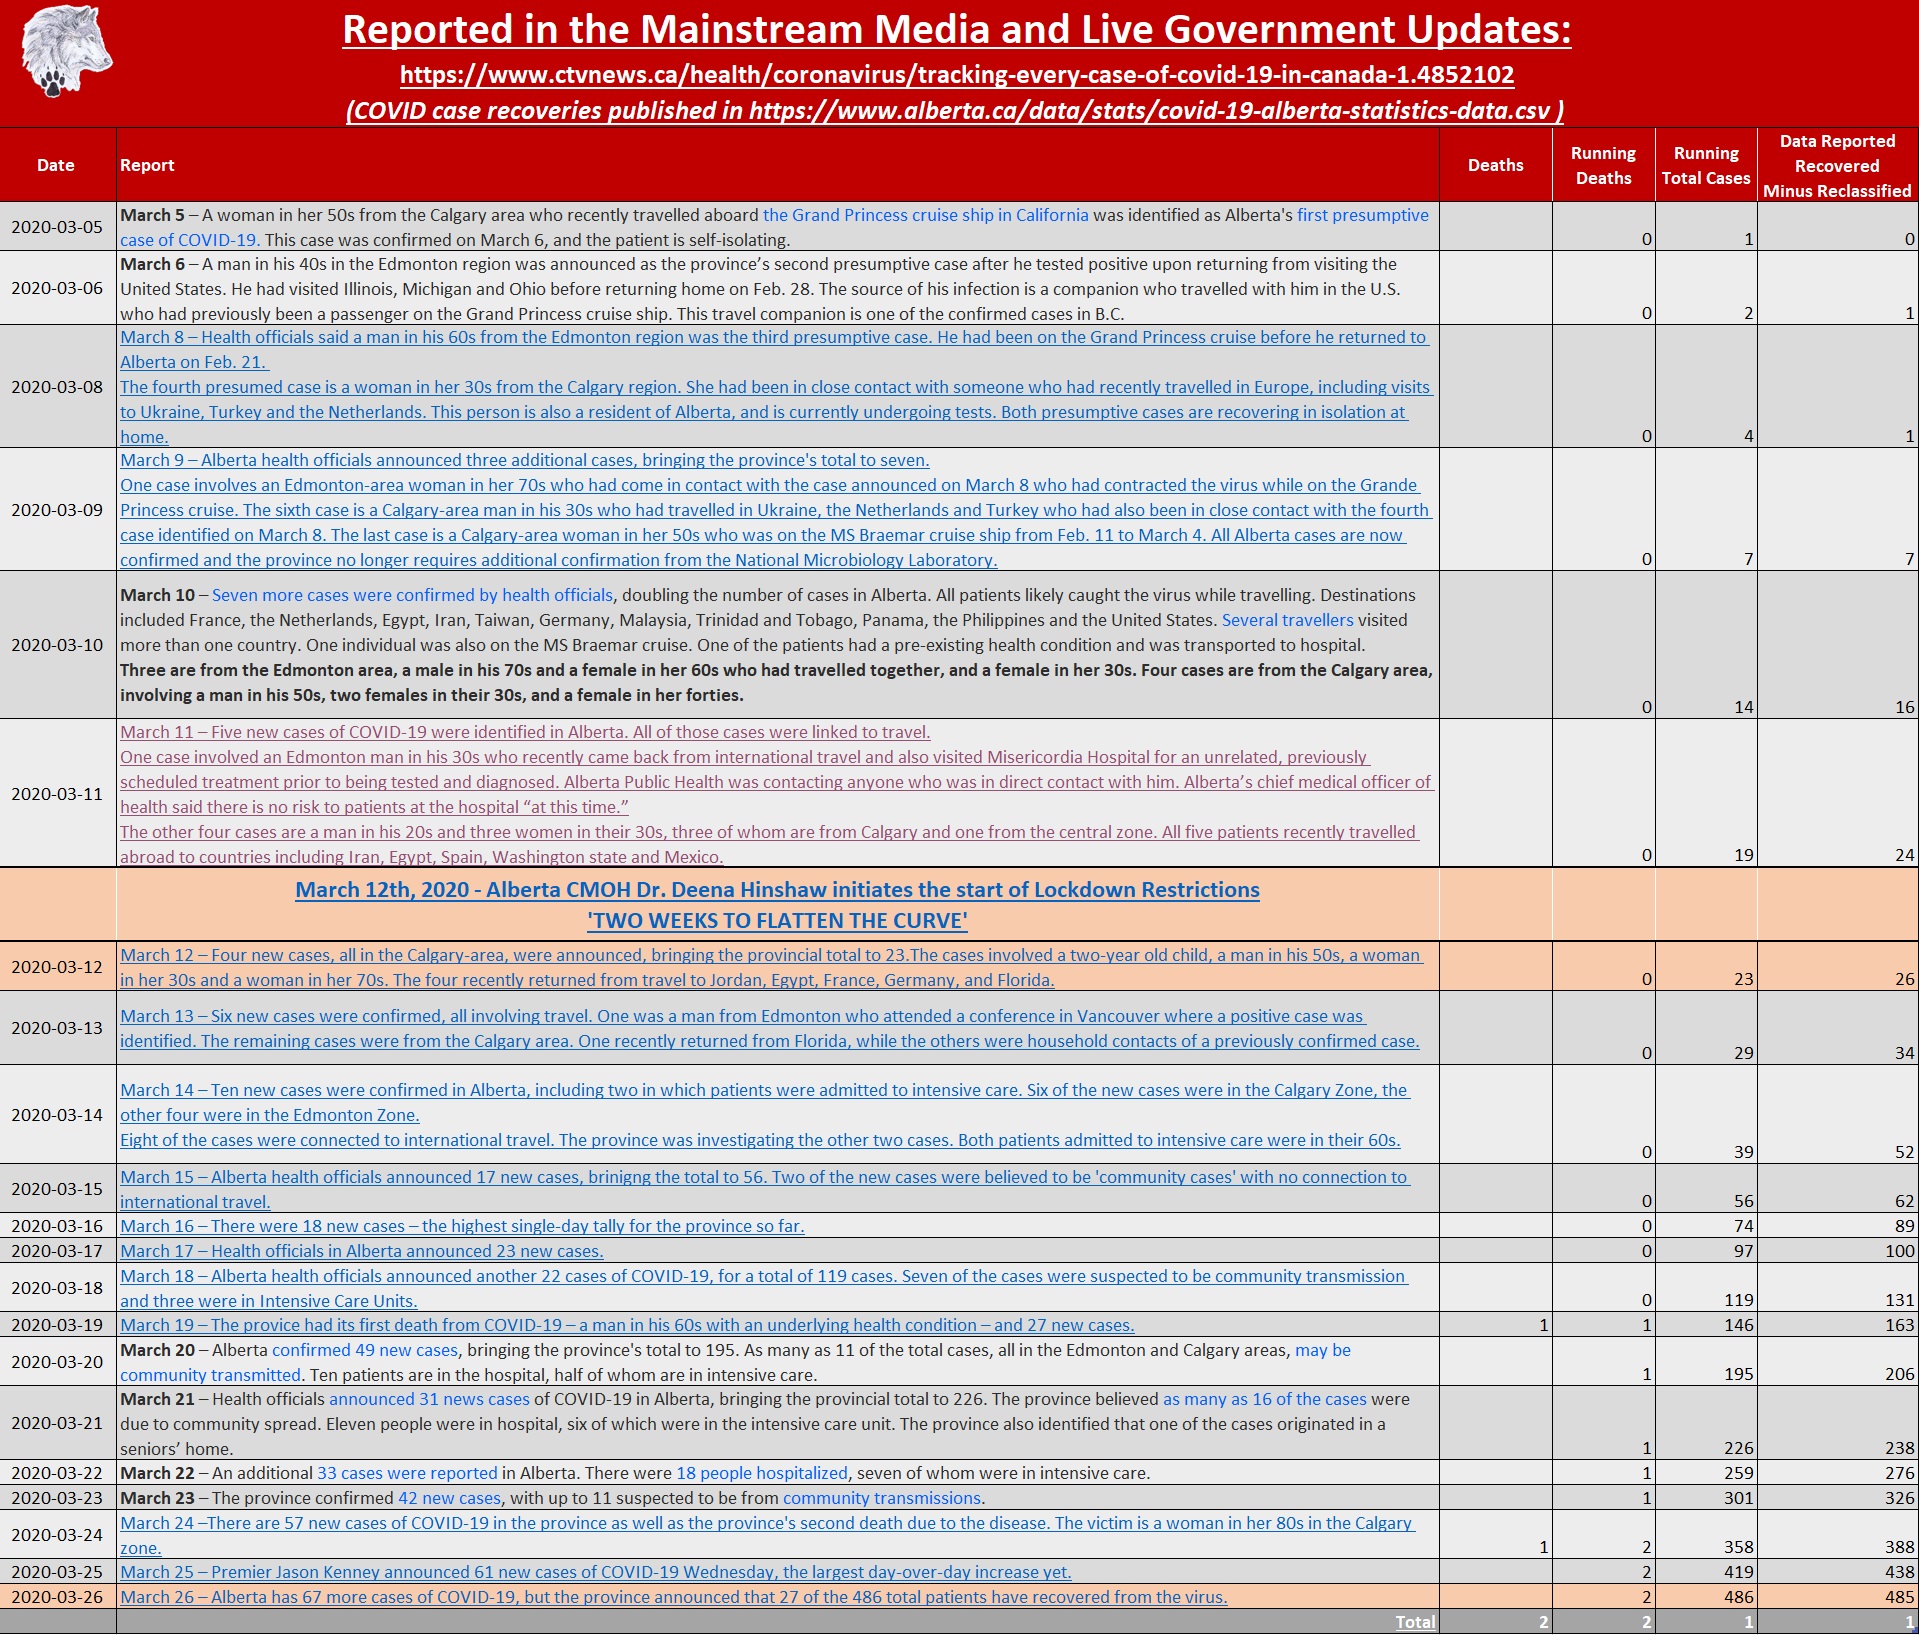
[Download PDF Link of the media updates]
As reported in Mainstream Media (CTV) and Live Government Updates:
[Download PDF Link of Alberta Health reported recovered cases - March 26th, 2020.]
back to top of page
back to top of page
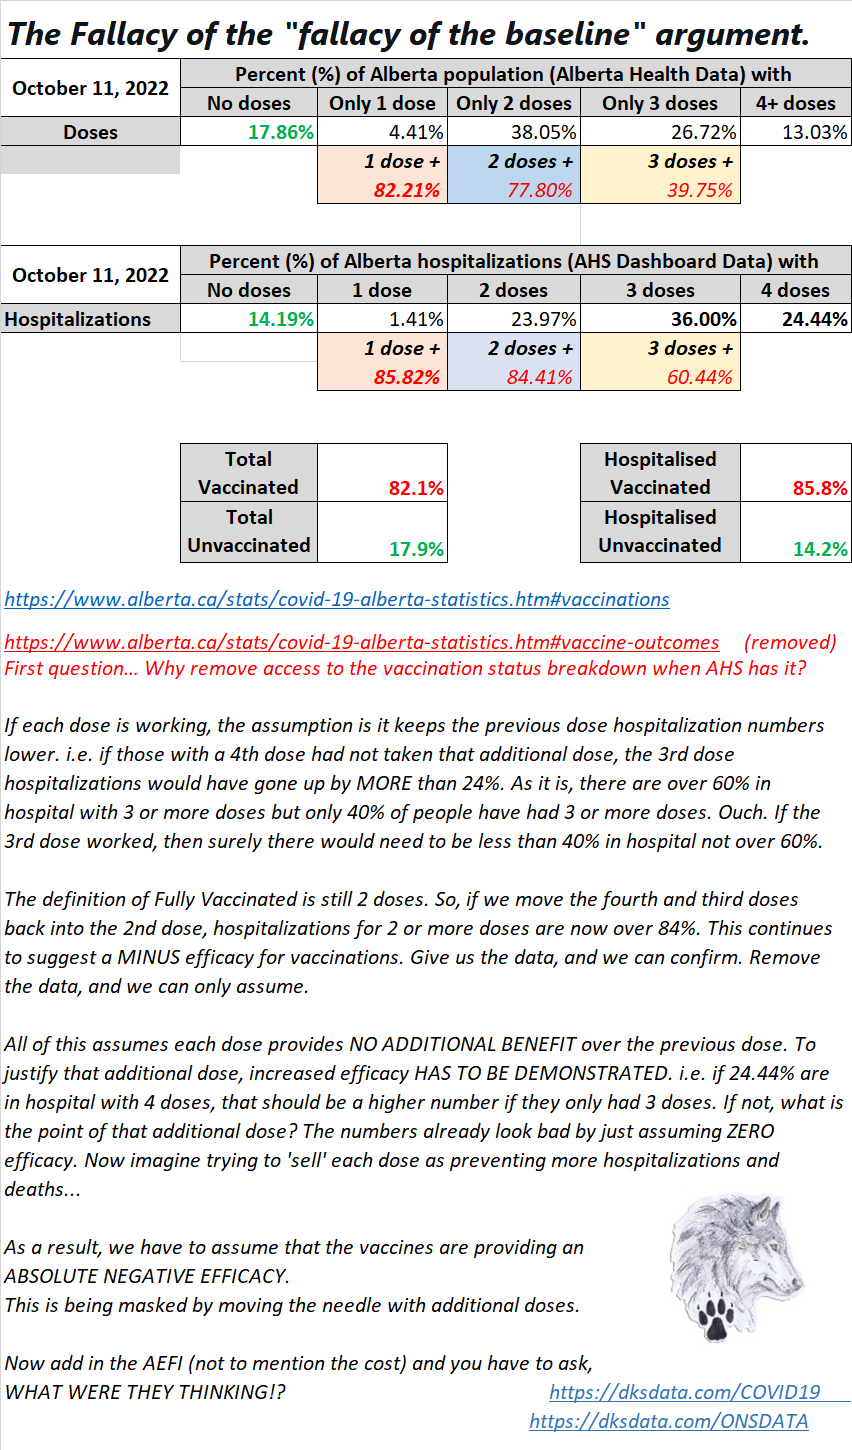
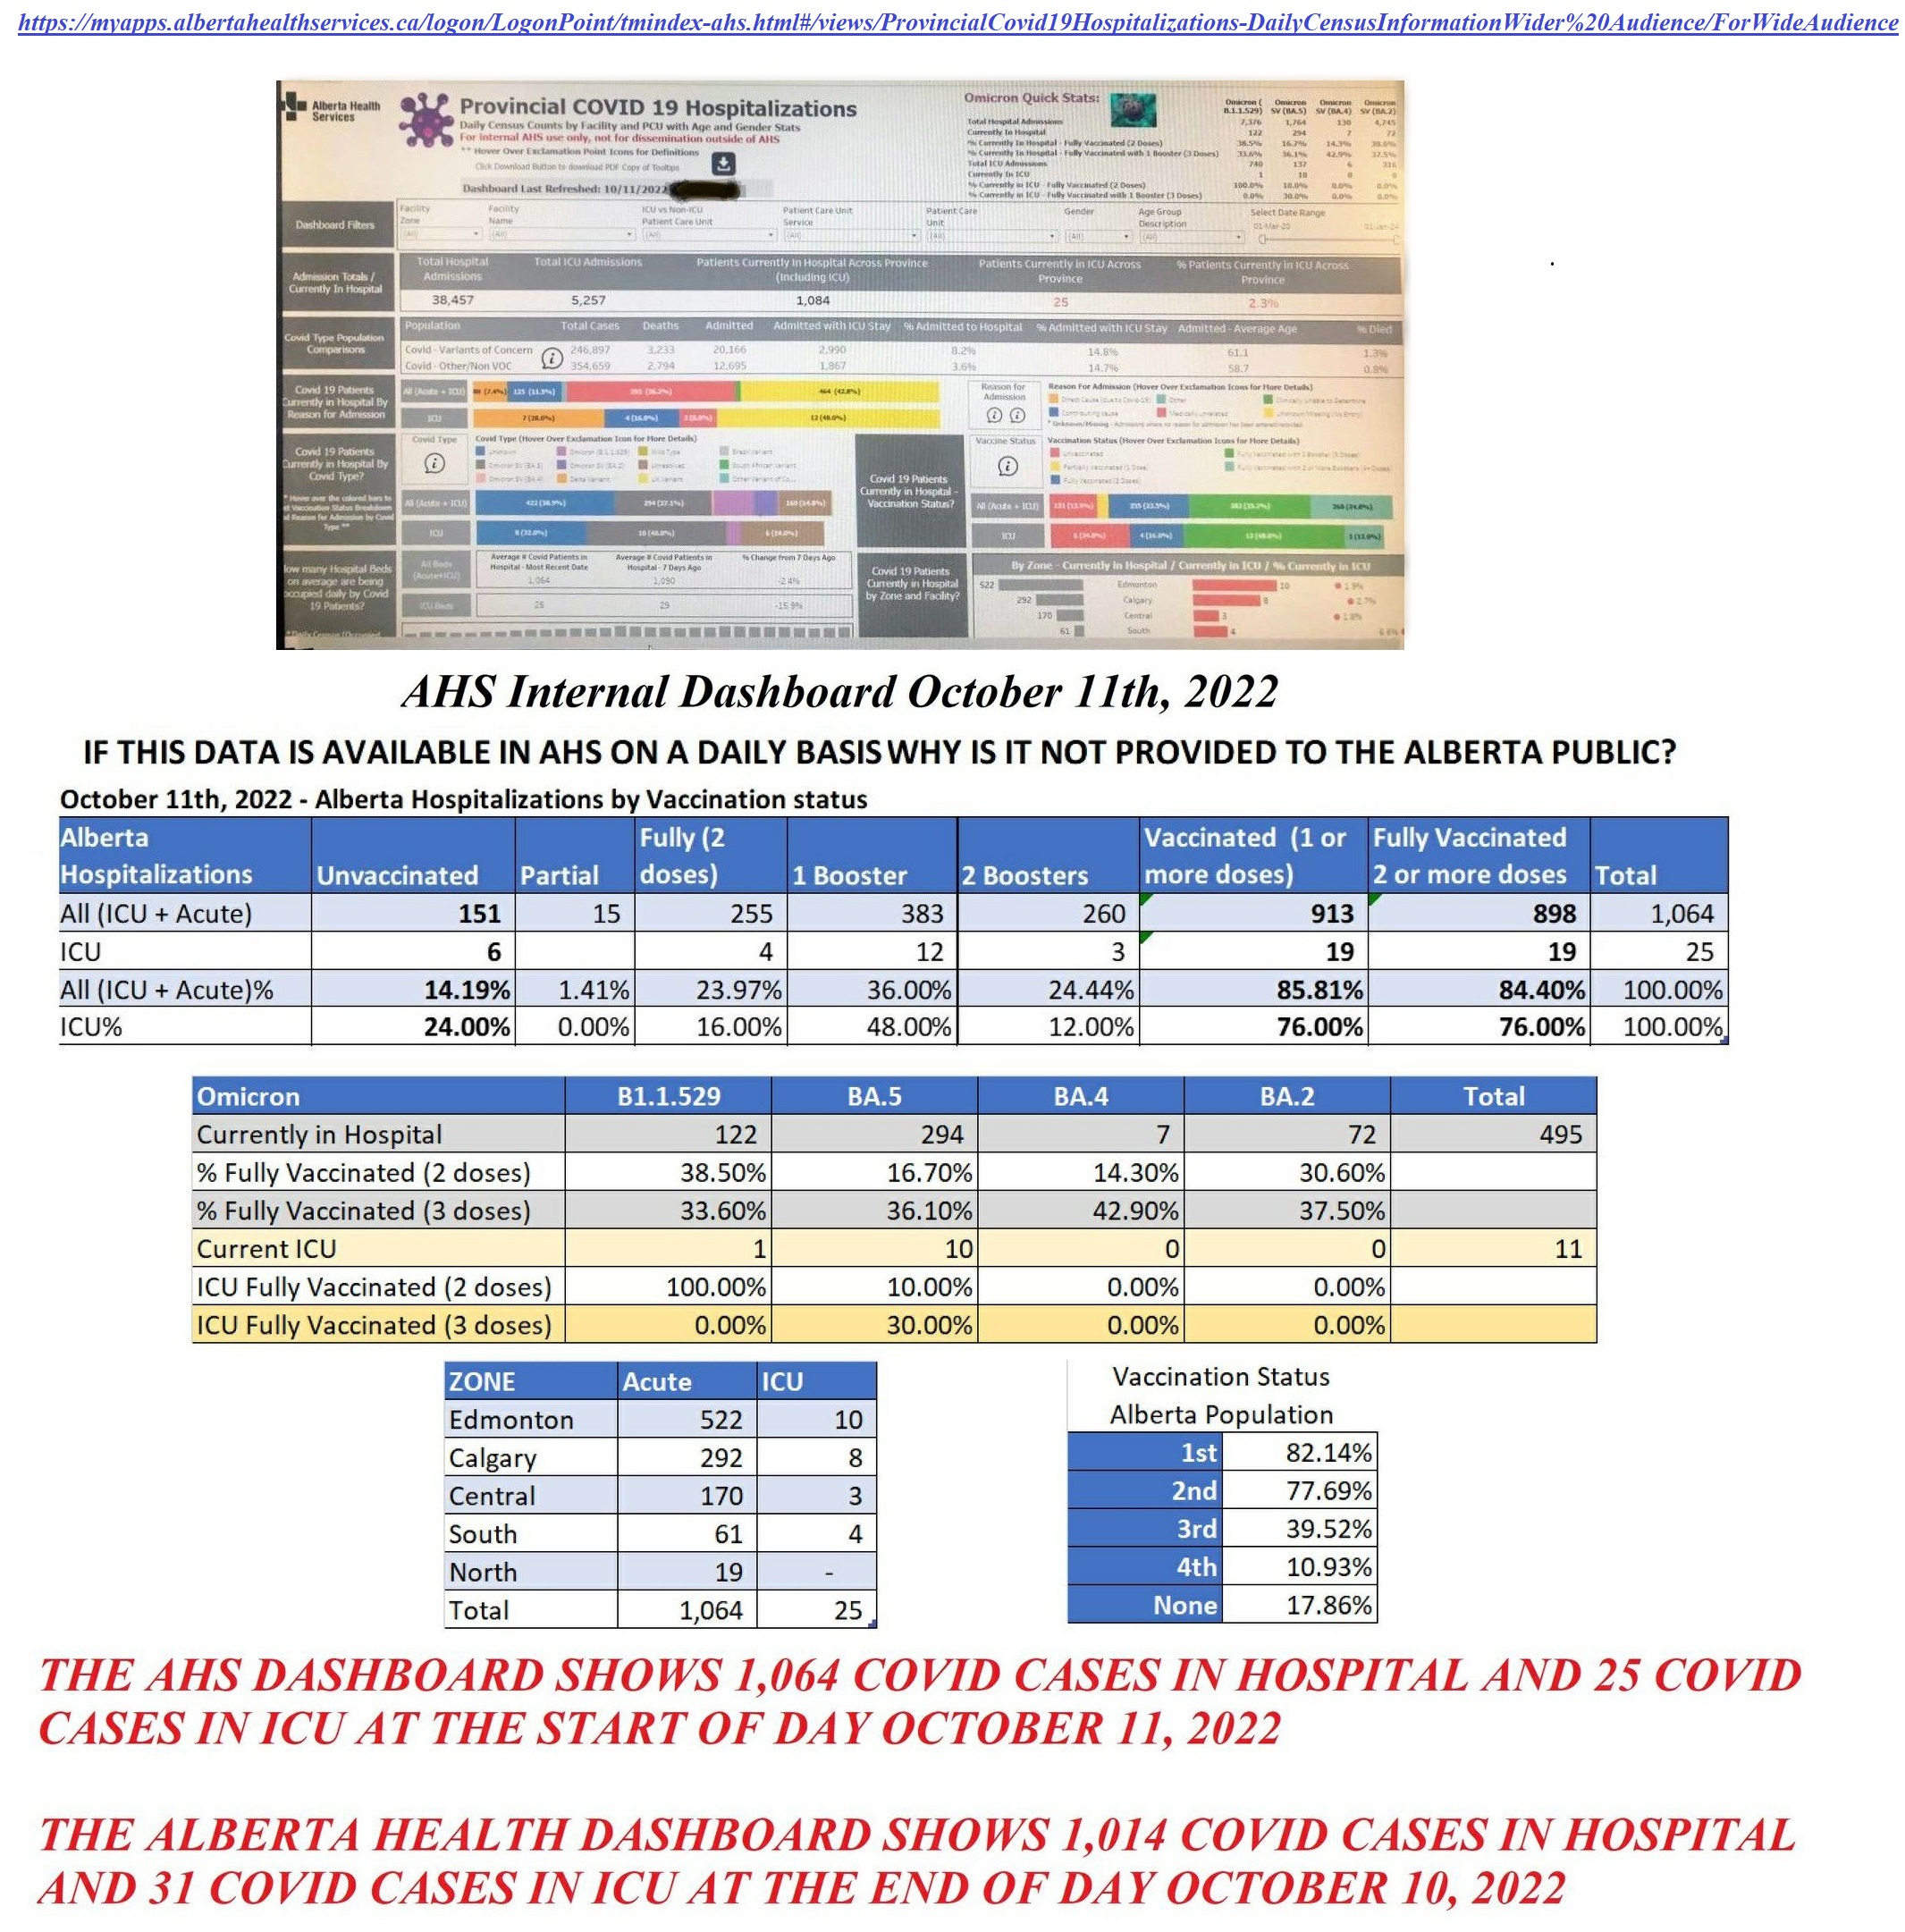
The Fallacy of the Baseline Fallacy argument (that NEVER held water).
If each dose is working, the assumption is it keeps the previous dose hospitalization numbers lower. i.e. if those with a 4th dose had not taken that additional dose, the 3rd dose hospitalizations would have gone up by MORE than 24%. As it is, there are over 60% in hospital with 3 or more doses but only 40% of people have had 3 or more doses. Ouch. If the 3rd dose worked, then surely there would need to be less than 40% in hospital not over 60%.
The definition of Fully Vaccinated is still 2 doses. So, if we move the fourth and third doses back into the 2nd dose, hospitalizations for 2 or more doses are now over 84%. This continues to suggest a MINUS efficacy for vaccinations. Give us the data, and we can confirm. Remove the data, and we can only assume.
All of this assumes each dose provides NO ADDITIONAL BENEFIT over the previous dose. To justify that additional dose, increased efficacy HAS TO BE DEMONSTRATED. i.e. if 24.44% are in hospital with 4 doses, that should be a higher number if they only had 3 doses. If not, what is the point of that additional dose? The numbers already look bad by just assuming ZERO efficacy. Now imagine trying to 'sell' each dose as preventing more hospitalizations and deaths...
As a result, we have to assume that the vaccines are providing an ABSOLUTE NEGATIVE EFFICACY.
This is being masked by moving the needle with additional doses.
Now add in the AEFI (not to mention the cost) and you have to ask, WHAT WERE THEY THINKING!?
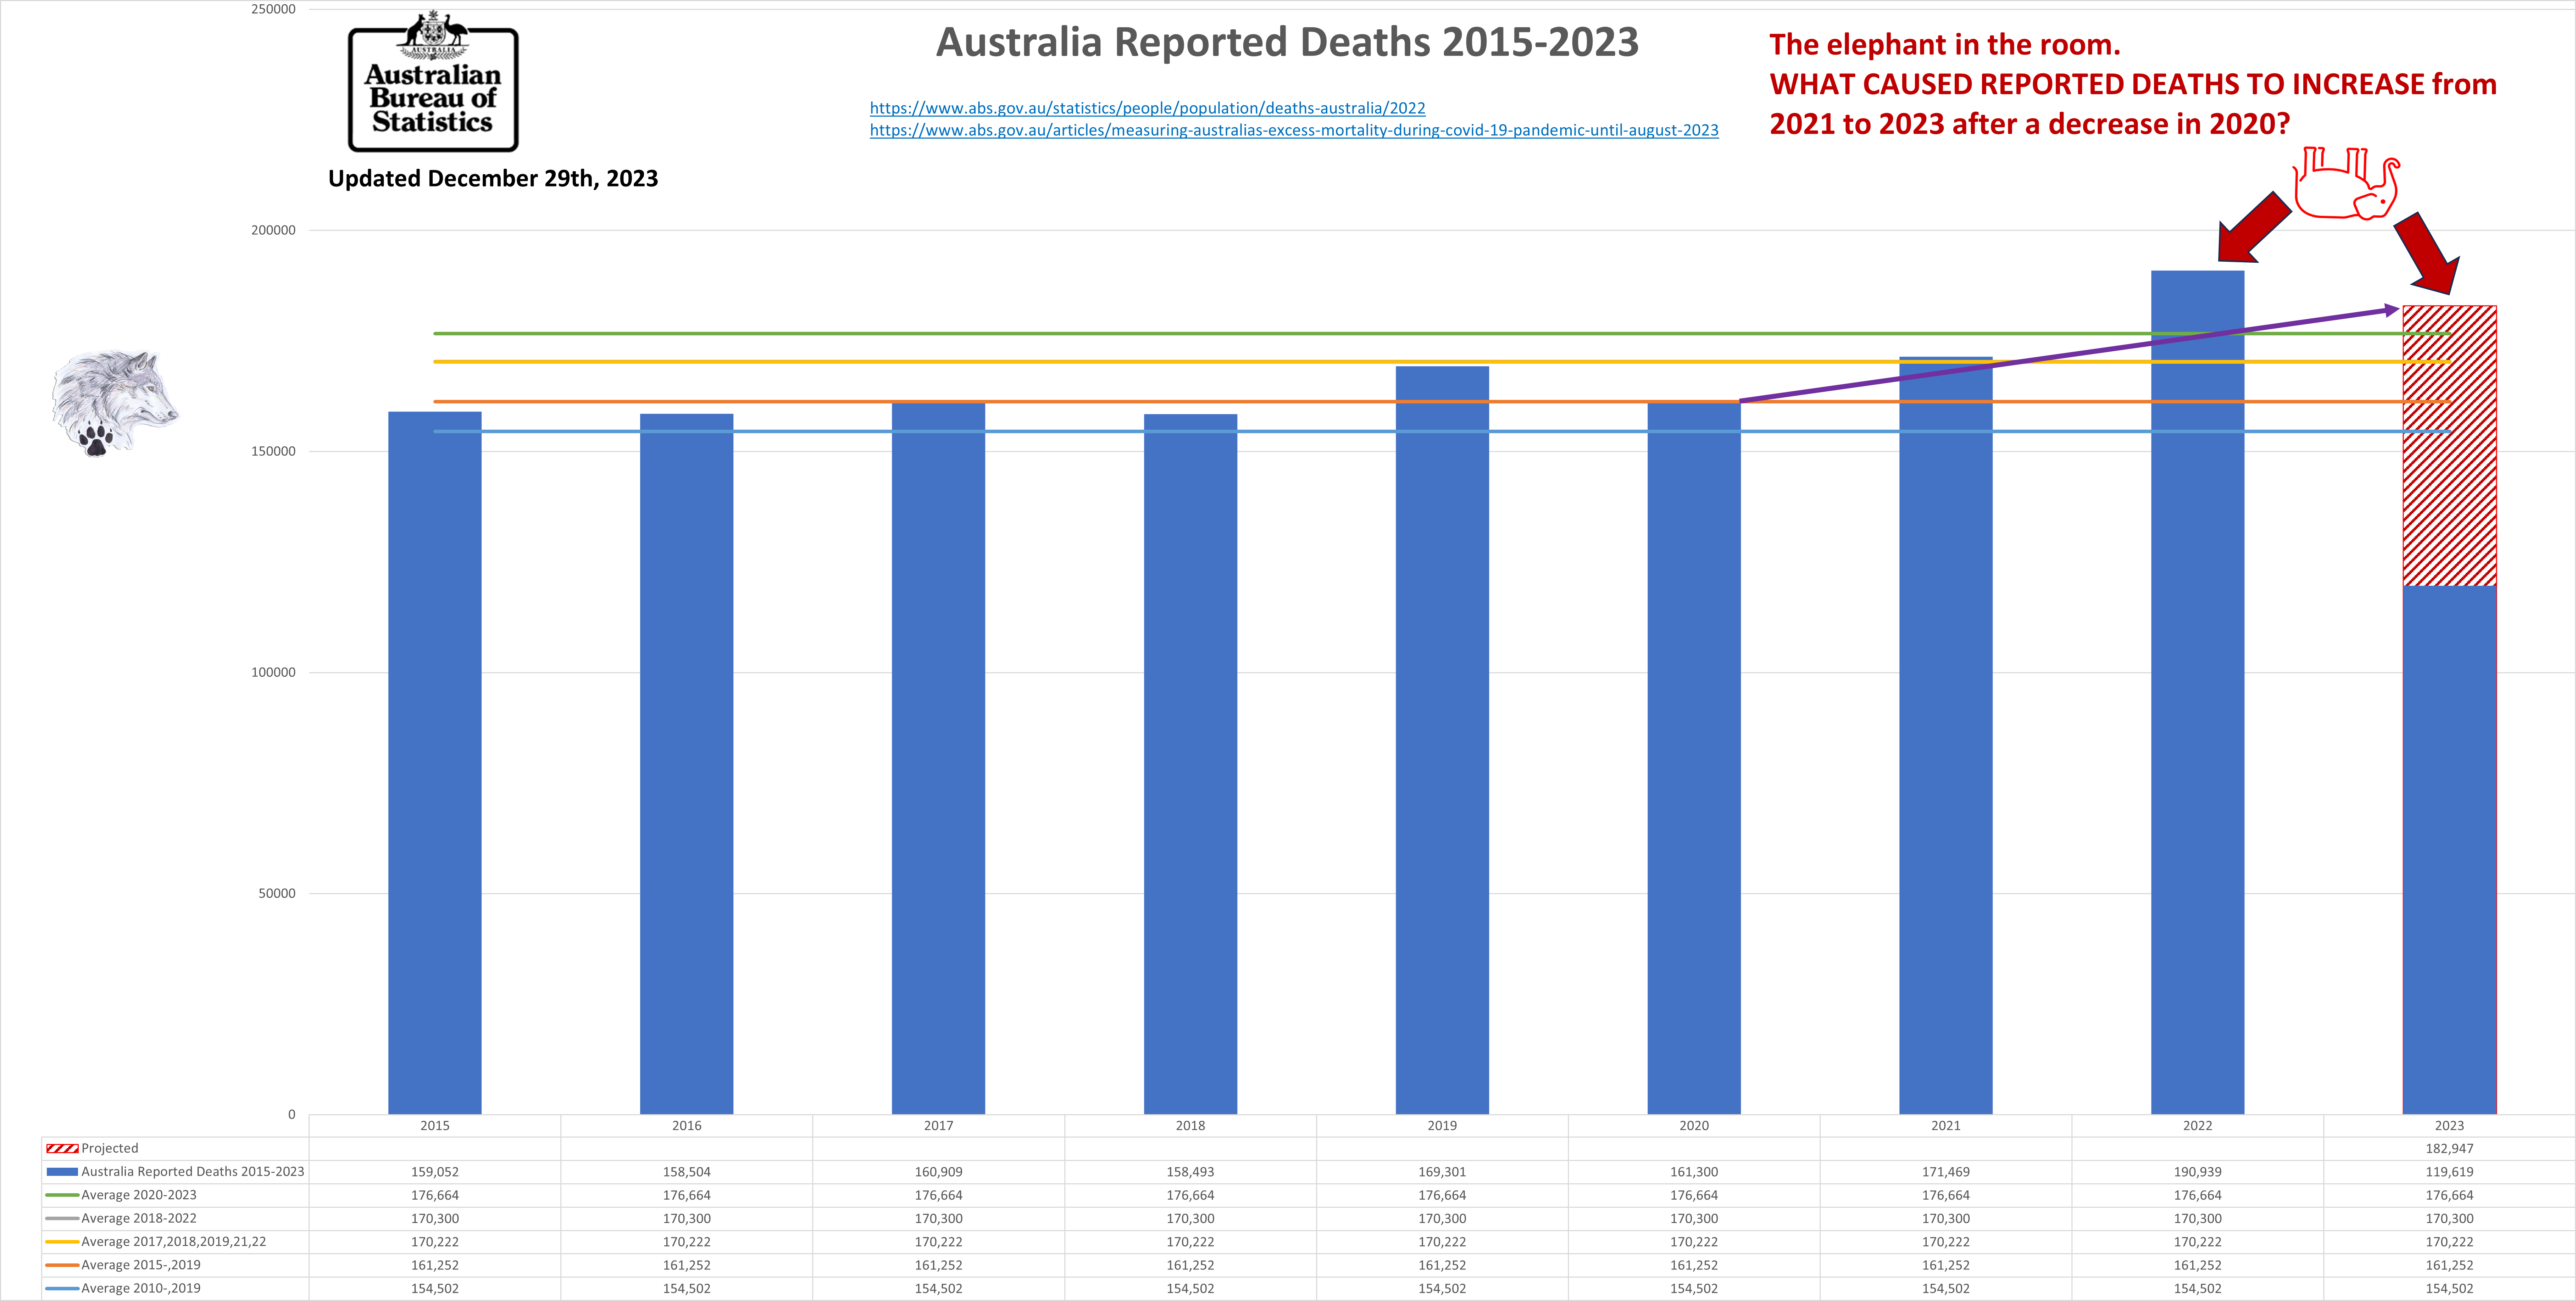
AUSTRALIA ALL-CAUSE MORTALITY - December 18th, 2023
After an unexpected drop in reported deaths in 2020, what has cause the spike in All Cause deaths in Australia, specifically in 2022 and 2023?
No matter what standard you base Excess Deaths on (5 year/10 year pre pandemic or rolling averages), excess deaths are climbing when they should be declining.
 https://www.abs.gov.au/statistics/people/population/deaths-australia/2022
https://www.abs.gov.au/articles/measuring-australias-excess-mortality-during-covid-19-pandemic-until-august-2023
https://www.abs.gov.au/statistics/people/population/deaths-australia/2022
https://www.abs.gov.au/articles/measuring-australias-excess-mortality-during-covid-19-pandemic-until-august-2023
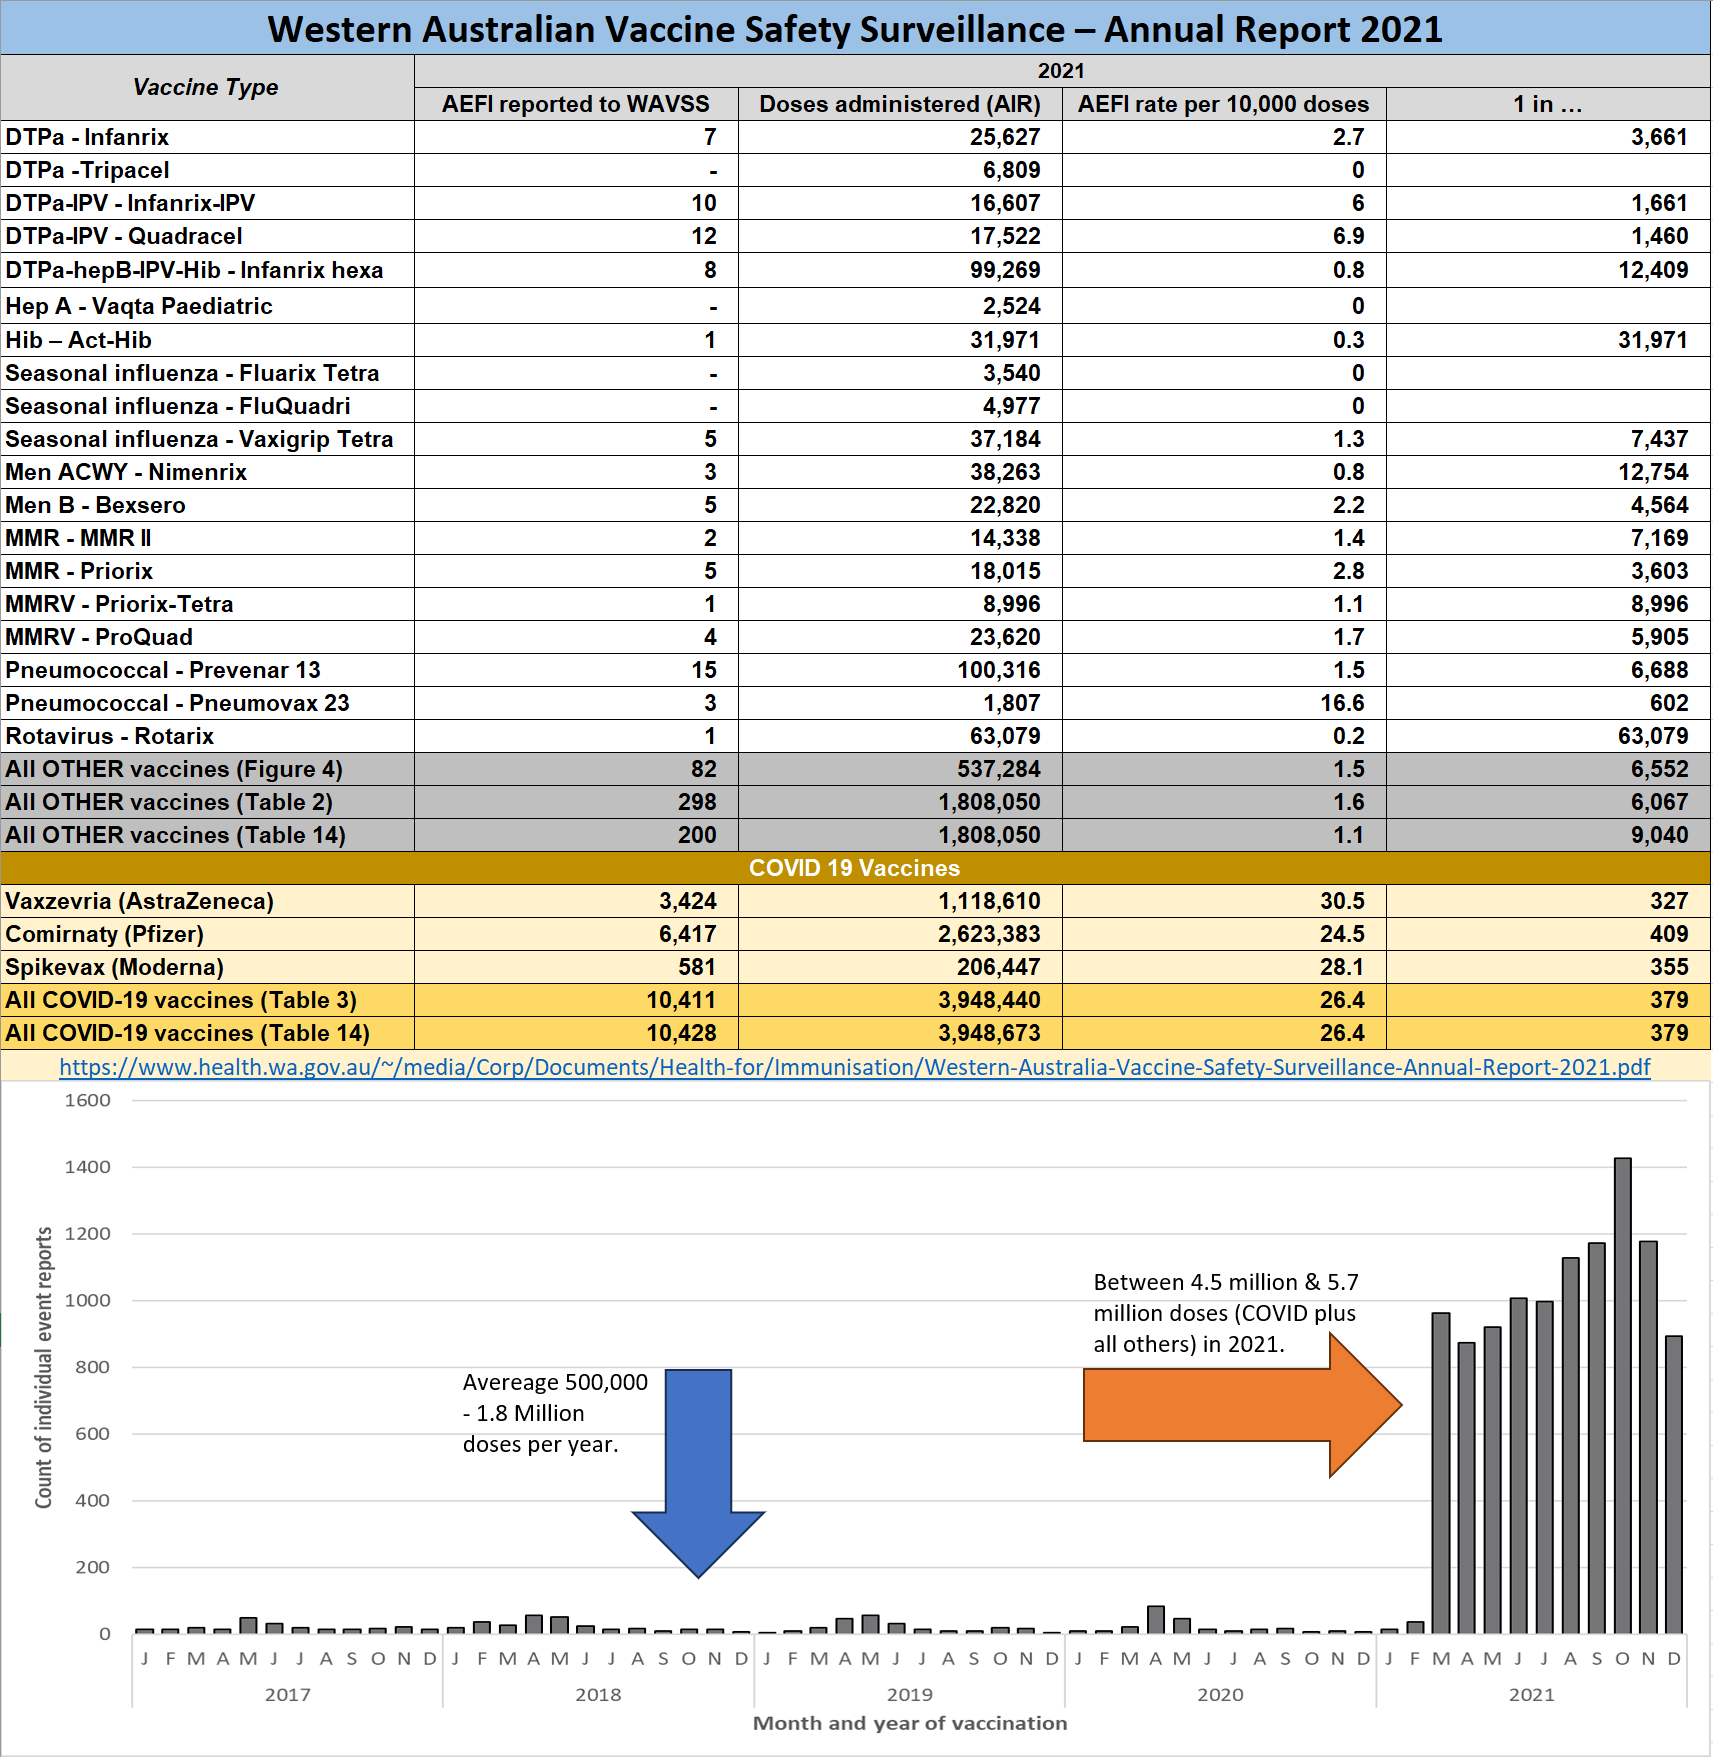
Western Australia Report 2021 data) is not what it appears, if you take a deeper look.
I took a deeper look at the Western Australia report and it may not be the gift it appears. Although the overall AEFI numbers look bad for COVID, the Pneumococcal rates are high too. There are quite a few anomalies in the report and a few “gotcha’s”, which may be deliberate.
Beware of Australian Governments bearing gifts.
AEFI Western Australia Report - may not be the bombshell it appears.
That may be by design, to deflect from much more SERIOUS AEFI numbers that have been published by other governments such as the UK and Canada for over 2 years.
https://health.wa.gov.au/~/media/Corp/Documents/Health-for/Immunisation/Western-Australia-Vaccine-Safety-Surveillance-Annual-Report-2021.pdf
In fact, this report may have been produced now as a Trojan Horse based on the numbers published. It has one chart (Figure 2) that appears to show an enormous increase in 2021, but that chart is missing the context of the number of vaccines given. Doses of all other vaccines in 2021 = between 537,284 and 1,808,050. Add to that doses of COVID vaccine in 2021 = 3,948,673. Total vaccines given in 2021 are between 4.5 million and 5.7 million, which is a significant increase over previous years. This gives reported non-COVID AEFI rates between 1 in 6,552 and 1 in 9,040 vs. 1 in 379 for COVID.
There are disparities throughout the report including the AEFI totals. 298 AEFI for all other vaccines and 10,068 COVID AEFI are listed in Figure 4. Elsewhere the totals are as low as 82 (non-COVID) and as high as 10,428 (COVID).
In addition, the Australian report seems to have been deliberately written to catch out the average reader. Regular (non-COVID) AEFI reporting is in a table with rates of AEFI per 10,000 doses (Table 4). COVID AEFI is reported at rates of 1 in 100,000 doses (Table 3).
Total rates of AEFI are higher in COVID, but not as great as is seen in other countries like the UK and Canada. This is likely to change once the 2022 data is published, which may be another reason to publish this report now.
This report also suggests this area in Australia has a more sensitive AEFI reporting system with rates in the pneumococcal vaccine in 2021 at 1 in 602, compared to the COVID AEFI average reporting of 1 in 379 for all ages (Tables 3 and 4).
In fact, the pneumococcal vaccine for the oldest age group has a higher rate of AEFI than Pfizer or Moderna in this area of Australia. In addition, all AEFI rates are under the typical cut-off for safety signals of 1 in 100,000 with rates between 1 in 602 to 1 in 63,079 for each of the non-COVID vaccines in 2021.
Compare those numbers to 1 in 93 SERIOUS AEFI in England and Wales. Or Canada which went from an average SERIOUS AEFI of 135 per year for all vaccines to nearly 11,000 for COVID alone with minimal differences in vaccination rates year on year.
Detailed government AEFI data analysis for Canada, US and UK can be found in the following linked page.
http://dksdata.com/ONSDATA
 back to top of page
And yet no one will acknowledge this. Why?
Full list of communications
Ingram - Now Scott/Ingram Case
https://dksdata.com/Court/Ingram/Ingram-Nowandthen.pdf
Sakamoto Case
https://dksdata.com/Court/Eva.pdf
GWS/TDF
https://www.thedemocracyfund.ca/reviewing_details_of_invoices_by_legal_counsel
https://www.thedemocracyfund.ca/reviewing_details_of_invoices_by_legal_counsel (Wayback)
https://dksdata.com/TDF/
Government Communications
https://dksdata.com/Court/ToInfrastructureMinister2025-05-05.pdf
https://dksdata.com/Court/Premier-RPGA-2025-3-28.pdf
https://dksdata.com/Court/PremierSmith-GaryDavidsonReport-Jan30-2025.pdf
https://dksdata.com/CareHomes/AHS-TRUST-CareHomes-January23-2025.pdf
https://dksdata.com/CareHomes/ShaneGetson2024-01-31.pdf
https://dksdata.com/Court/PremierSmith-GaryDavidsonReport-Jan28-2025.pdf
https://dksdata.com/CareHomes/MinisterNixonOctober18-2024Plus.pdf (with attachments)
https://dksdata.com/CareHomes/MinisterNixonOctober18-2024.pdf
https://dksdata.com/Court/ResponsefromHealthMinister-AHS-LicensedtoKill-2024-03-2024.pdf
https://dksdata.com/Court/NixonetalSept172024.pdf
https://dksdata.com/Court/CCDAug26-2024-Nixon_Redacted.pdf
https://dksdata.com/CareHomes/PremierSmithAugust22-2024.pdf
https://dksdata.com/Court/NotesForShaneGetsonMeeting_Redacted.pdf
https://dksdata.com/Court/MinisterWilsonJune2024.pdf
https://dksdata.com/ABCOVID/AIOT/ToPremierJune172024.pdf
https://dksdata.com/Court/FAOChief-EPS-Redacted.pdf
Communications sent to Danielle Smith 2020 regarding Care Home crimes and more.
https://dksdata.com/ABCOVID/CoppingtoLaGrange.pdf
https://dksdata.com/Court/PSEMinisterFeb20-2024-2_Redacted.pdf
https://dksdata.com/Court/PSESMinisterFeb13-2024_Redacted.pdf
https://dksdata.com/Court/DanielleSmithJCCFJerryDunham_Redacted.pdf
https://dksdata.com/Court/Eva.pdf
https://dksdata.com/Court/ChiefOfStaff_Redacted.pdf
https://dksdata.com/Court/PremierFeb72024.pdf
https://dksdata.com/Court/DataManipulation.pdf
https://dksdata.com/Court/ToPremierMLASMediaJanuary192024.pdf
https://dksdata.com/Court/Jan32024_Redacted.pdf
https://dksdata.com/CareHomes/OutbreakCCD_redacted.pdf
https://dksdata.com/CareHomes/ToMinistersandmlaS12-12-2023_Redacted.pdf
https://dksdata.com/CareHomes/CapitalCareCEONov2723.pdf
https://dksdata.com/CareHomes/CapitalCareCEONov2223.pdf
https://www.dksdata.com/CareHomes/CapitalCareJusticeHealthMinistersNov152023-redacted.pdf
https://www.dksdata.com//CareHomes/CapitalCareJusticeHealthMinistersNov142023-redacted.pdf
https://www.dksdata.com/Court/AllMinistersMLAsandMediaNov22023.pdf
https://www.dksdata.com/CareHomes/ToCapitalCare-Justice-MLA-October20-2023.pdf
https://dksdata.com/CareHomes/image2023-10-19-133728_Redacted.pdf
https://dksdata.com/Court/ToMinistersand%20MediaSeptember72023_Redacted.pdf
https://dksdata.com/Court/ToDevonMLAandMinistersSeptember62023_Redacted.pdf
https://dksdata.com/Court/ToDevonMLAandMinistersAugust252023_Redacted.pdf
https://dksdata.com/Court/ToDevonMLAandMinistersAugust222023_Redacted.pdf
https://dksdata.com/Court/ToDevonMLAAugust212023.pdf
https://dksdata.com/Court/ToAlbertaPremierJuly272023.pdf
https://dksdata.com/Court/LettertoOAGandOmbudsnamOfficeJuly182023.pdf
https://dksdata.com/Court/LettertoOAGandOmbudsnamOfficeJuly112023.pdf
https://dksdata.com/Court/LettertoMLAsMediaandmore2023-06-28.pdf
https://dksdata.com/Court/ToAlbertaPoliticians2023-06-23.pdf
https://dksdata.com/Court/ToAlbertaPoliticians2023-06-22.pdf
https://dksdata.com/Court/ToAlbertaPoliticians2023-06-21.pdf
https://dksdata.com/Court/ToAlbertaPoliticians2023-06-15.pdf
https://dksdata.com/Court/ToAlbertaPoliticians2023-06-13.pdf
https://dksdata.com/Court/ToAlbertaPremier2023-06-09.pdf
https://dksdata.com/Court/ToAlbertaHealthMinisterandJusticeMinister2023-06-09.pdf
https://dksdata.com/Court/ToAlbertaPremier2023-06-08.pdf
https://dksdata.com/Court/ToAlbertaPremier2023-06-07.pdf
https://dksdata.com/Court/ToAlbertaPremierandMedia2023-06-05.pdf
https://dksdata.com/Court/ToAlberterPremier2023-06-04.pdf
https://dksdata.com/Court/ToAlbertaPremier2023-05-31_Redacted.pdf
https://dksdata.com/Court/ToAlbertaPremierMay262023_Redacted.pdf
https://dksdata.com/Court/AlbertaHealthMinisterApril282023.pdf
https://dksdata.com/Court/CapitalCareandRAH-Masks.pdf
https://dksdata.com/Court/CapitalCare.pdf
https://dksdata.com/Court/ToAlbertaPremierMarch302023_Redacted.pdf
https://dksdata.com/Court/ToMLA-MarkSmith.pdf
https://dksdata.com/Court/ToAlbertaPremierMarch072023.pdf
https://dksdata.com/Court/ToAlbertaPremierFebruary282023.pdf
https://dksdata.com/Court/ToAlbertaPremierJanuary292023.pdf
Communications with Patient Relations
https://dksdata.com/PatientRelations/Letter-RAH-DI_Redacted.pdf
https://dksdata.com/PatientRelations/PatientRealtionsResponsesMay92023.pdf
https://dksdata.com/PatientRelations/letter-Kaye_Redacted%20ops.pdf
https://dksdata.com/PatientRelations/letter-PS_Redacted.pdf
https://dksdata.com/PatientRelations/letter-RAHPhy_Redacted.pdf
https://dksdata.com/PatientRelations/letter-kaye%20phy_Redacted.pdf
https://dksdata.com/PatientRelations/Dickson-RAH-Redacted.pdf
https://dksdata.com/PatientRelations/DicksonPS-Redacted.pdf
https://dksdata.com/PatientRelations/DicksonKAYEclinic1-Redacted.pdf
https://dksdata.com/PatientRelations/AlbertaCareHome5thMay2023.pdf
https://dksdata.com/PatientRelations/CapitalCare%2014072020_Redacted.pdf
https://dksdata.com/PatientRelations/CapitalCare%2016072020_Redacted.pdf
CANADA COVID SOURCE DATA - Health Canada
COVID-19: Current situation
COVID-19 epidemiology update: Summary
Reported side effects following COVID-19 vaccination in Canada
CANADA DEATHS SOURCE DATA - Stats Canada
Provisional death counts and excess mortality, January 2020 to December 2022
Provisional weekly death counts, by age group and sex
Previous releases and revisions to provisional weekly death counts
Provisional weekly estimates of the number of deaths, expected number of deaths and excess mortality
Provisional weekly estimates of the number of deaths, expected number of deaths and excess mortality, by age group and sex
Provisional weekly death counts, by selected grouped causes of death
UK DEATHS SOURCE DATA
UK ONS Data Latest
UK ONS Data - 2010
UK ONS Data - 2011
UK ONS Data - 2012
UK ONS Data - 2013
UK ONS Data - 2014
UK ONS Data - 2015
UK ONS Data - 2016
UK ONS Data - 2017
UK ONS Data - 2018
UK ONS Data - 2019
UK ONS Data - 2020
UK ONS Data - 2021
UK ONS Data - 2022
UK ONS Data - Week 52 2023
UK ONS Data - 2024
UK ONS NEWSPEAK DATA
https://www.ons.gov.uk/peoplepopulationandcommunity/healthandsocialcare/causesofdeath/articles/estimatingexcessdeathsintheukmethodologychanges/february2024
NO SAFE DOSE
UK ONS Data - Deaths by Vaccine Status
***Note that the UK ONS has stated they will not be producing this data from this point on, so the true impact of the vaccines will continue to be hidden (outside of the climbing Excess Deaths and climbing AEFI).
SCOTLAND DEATHS SOURCE DATA
https://www.nrscotland.gov.uk/files//statistics/vital-events/weekly-deaths/weekly-deaths-23-week-51-52.xlsx
https://www.nrscotland.gov.uk/files//statistics/vital-events/weekly-deaths/weekly-deaths-23.xlss
https://www.nrscotland.gov.uk/statistics-and-data/statistics/statistics-by-theme/vital-events/general-publications/weekly-deaths-registered-in-scotland
https://www.nrscotland.gov.uk/files//statistics/weekly-monthly-births-deaths-data/2023/jan/weekly-january-23-tab-2.xlsx
https://webarchive.nrscotland.gov.uk/20210314053936mp_/https://www.nrscotland.gov.uk/files//statistics/vital-events-ref-tables/2019/vital-events-19-ref-tabs-5.xlsx
https://webarchive.nrscotland.gov.uk/20220315040951mp_/https://www.nrscotland.gov.uk/files//statistics/vital-events-ref-tables/2020/vital-events-20-ref-tabs-5.xlsx
https://www.nrscotland.gov.uk/files//statistics/vital-events-ref-tables/2021/vital-events-21-ref-tabs-5.xlsx
https://www.nrscotland.gov.uk/statistics-and-data/statistics/statistics-by-theme/vital-events/general-publications/weekly-deaths-registered-in-scotland
NORTHERN IRELAND DEATHS SOURCE DATA
https://www.nisra.gov.uk/publications/historical-weekly-deaths-data
https://www.nisra.gov.uk/publications/weekly-death-registrations-northern-ireland-2024
IRELAND DEATHS SOURCE DATA
https://www.cso.ie/en/statistics/birthsdeathsandmarriages/
SWEDEN DEATHS SOURCE DATA
Statistica Data - https://www.statista.com/statistics/525353/sweden-number-of-deaths/
SBS Data - https://www.scb.se/pressmeddelande/antalet-dodsfall-sjonk-under-2021/
SBS Data - https://www.statistikdatabasen.scb.se/pxweb/en/ssd/START__BE__BE0101__BE0101I/DodaVeckaRegion/table/tableViewLayout1/
SBS Data - https://www.scb.se/hitta-statistik/statistik-efter-amne/befolkning/befolkningens-sammansattning/befolkningsstatistik/pong/tabell-och-diagram/folkmangd-och-befolkningsforandringar---manad-kvartal-och-halvar/befolkningsstatistik-2023/
AUSTRALIA DEATHS SOURCE DATA
https://health.wa.gov.au/~/media/Corp/Documents/Health-for/Immunisation/Western-Australia-Vaccine-Safety-Surveillance-Annual-Report-2021.pdf
https://www.abs.gov.au/statistics/people/population/deaths-australia/2022
https://www.abs.gov.au/articles/measuring-australias-excess-mortality-during-covid-19-pandemic-until-august-2023