COVID 19 – Is the lock down working?
Published on April 3, 2020
Complete research here: The Best Laid Plans COVID-19
The Best Laid PlansDr. Mike Ryan, head of health emergencies at the World Health Organization (WHO).
“Due to lockdown, most of the transmission that’s actually happening in many countries now is happening in the household at family level,”.
“Now we need to go and look in families and find those people that may be sick and remove them and isolate them in a safe and dignified manner.”
Question: How is the rate of deaths and people with COVID 19 linked in ways that no-one is reporting?
Answer: Test kits (testing), test kits (positive), test kits (deaths).
We don’t have accurate (or reliable) information for China other than this started sometime in late 2019. What we do know is that from the first outbreak in China until the start of global lock down, many millions of people had moved in and out of that area of infection unhindered. Each of these people interacted with many others at airports, work, public places and at home. Each of these interactions most likely spread the virus even further.
As each country locked down, something else also happened. Each country, state or local government started to roll out exponentially growing testing. Unlike most other countries, Sweden did not follow the rigid lock down protocols implemented across the globe. However, Sweden did implement the same testing and their curve, in cases and deaths, aligns with that testing.
The lock down and its date are important only in that they trigger the testing. If we had not rigidly locked down, as Sweden didn't, we would see the same exponential curve and glowing red maps.
The current scientific consensus is that the virus can be spread as easily as breathing, hangs in the air for hours and on surfaces for many days.
Question: How then have we contained this virus?
The real question is, 'Have we contained the virus?'. The answer would appear to be NO!
Question: If we haven’t contained the virus and it has an incubation period of up to two weeks, why did we not see many deaths outside of China starting in December of 2019?
Answer: We were NOT tracking test kits.
Question: What is the connection between escalating deaths and reported cases?
Answer: We are NOW tracking test kits.
Question: If we haven't contained the virus and a lock down is not effective, then why are we not going back to work and following the normal practices of good hygiene to keep safe, clean and secure as we do every flu season?
Answer: We are ONLY tracking test kits.
Here are some of the facts from the CDC on initial cases, lock downs and deaths as of May 2nd, 2020.
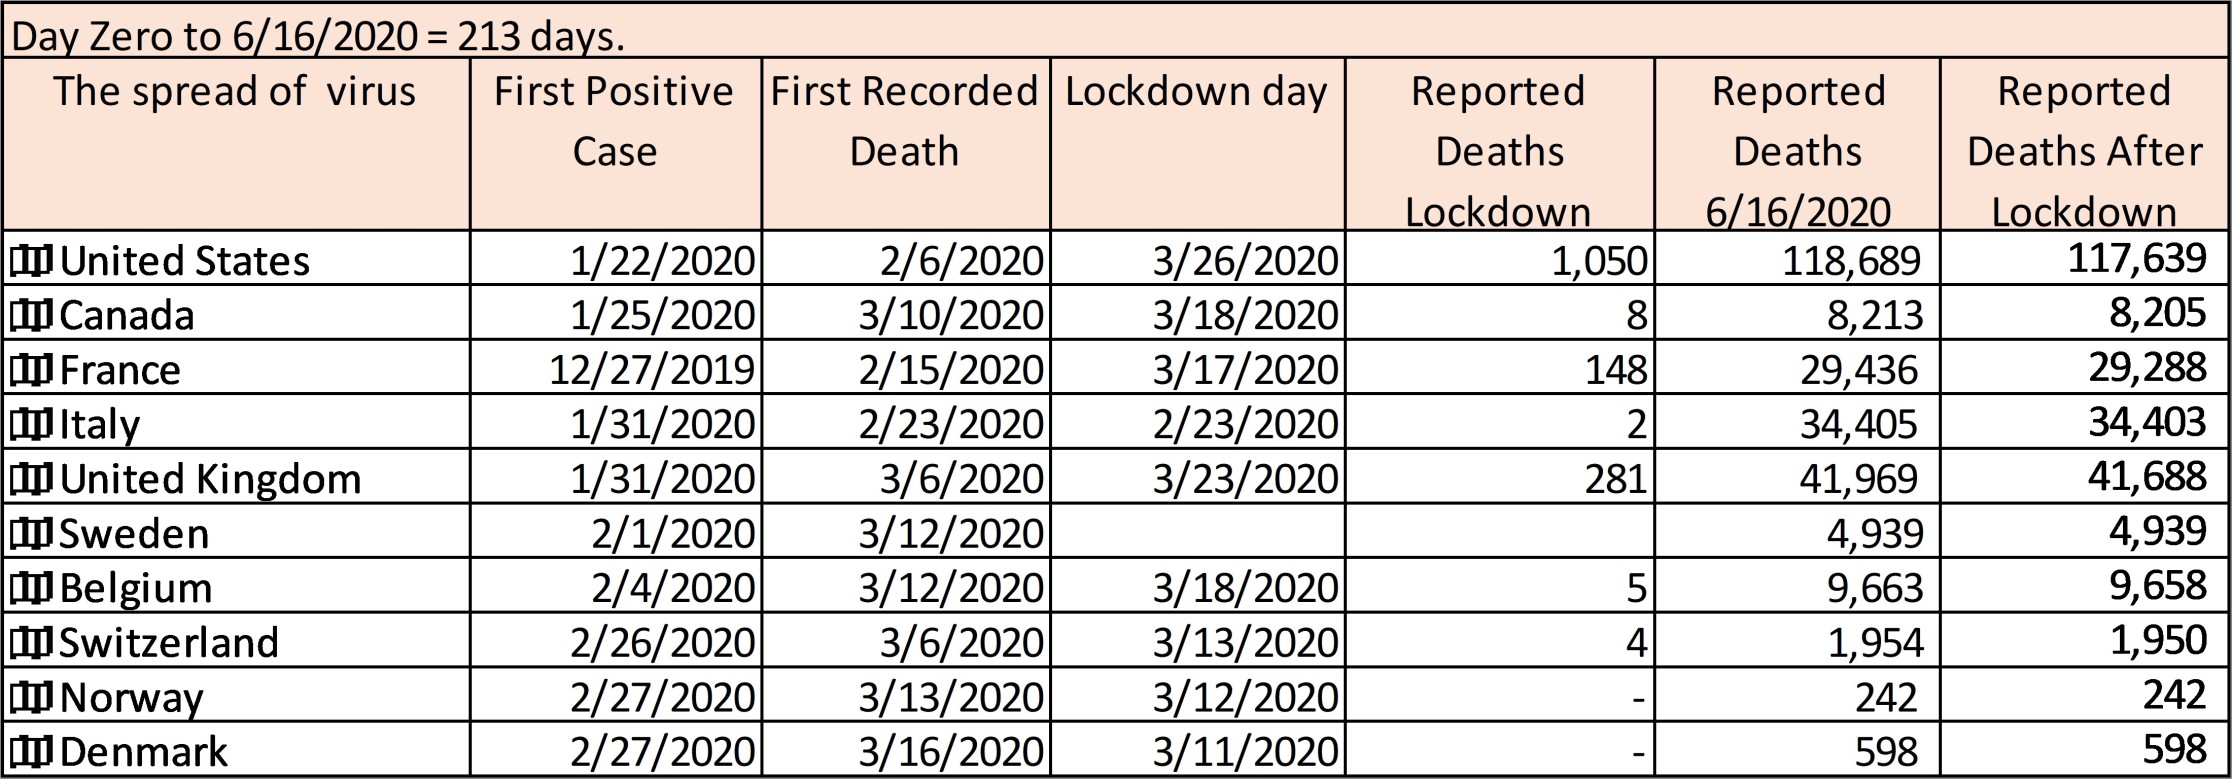
The first reported case of COVID 19 in China was December 1st (recently revised from December 31st). This puts the minimum earliest date of infection, in one of the most internationally traveled densely populated areas on the planet as November 16th, 2019. With an initial R0 of 3.4 (WHO), now increased to 5.7, how was the virus controlled when, at that rate, the virus infections would double every 3 days. The first confirmed US death, from community transfer i.e. not travel related, was on February 6th, 2020. This changes the date for the most likely first case in the US to before January 22nd, 2020.
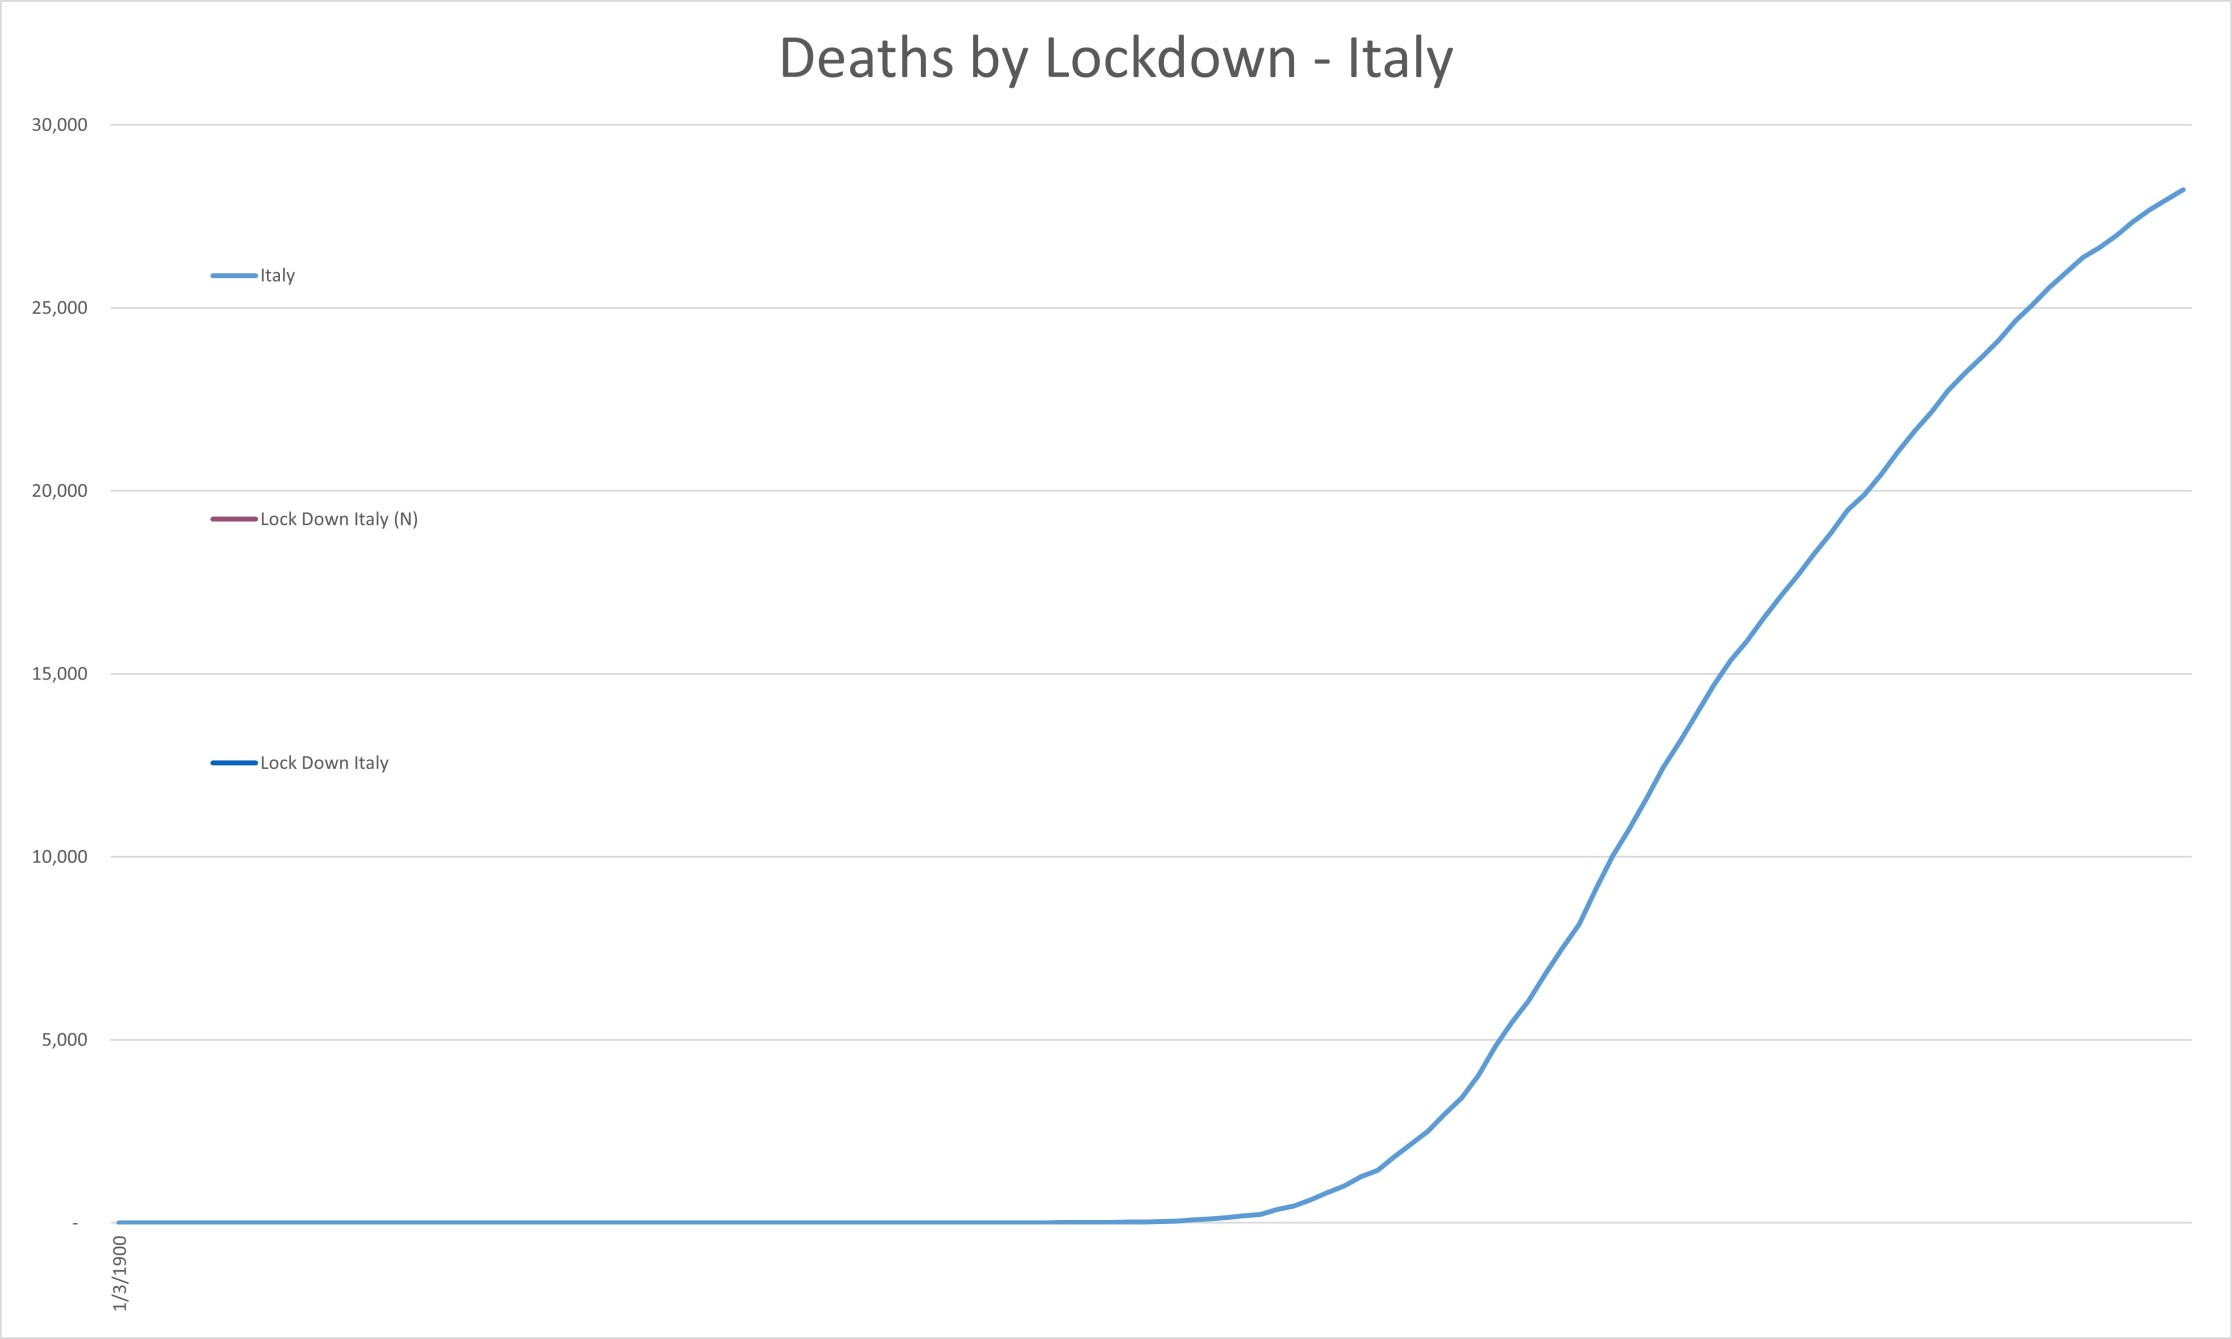
From the day of the first infection in China until the first lockdown in Northern Italy, a total of 99 days passed with only 2 recorded deaths. From that lockdown in northern Italy to May 2nd ,2020, a total of 69 days passed and reported deaths increased to 28,708. That meant that at the time of lockdown, there had been an average of 0.02 deaths per day in Italy from breakout to lockdown, but an average of 416 deaths per day since the lockdown. Did the virus suddenly get more deadly after the lockdown? If not, then there should have been up to 41,000 COVID 19 deaths in Italy between November 16th, 2019 to the date of the first lockdown on February 23rd, 2020. Where are all the bodies? After all, overall mortality in Italy has not really changed, COVID 19 apparently has a unique presentation unlike flu and COVID 19 is highly infectious and very deadly.
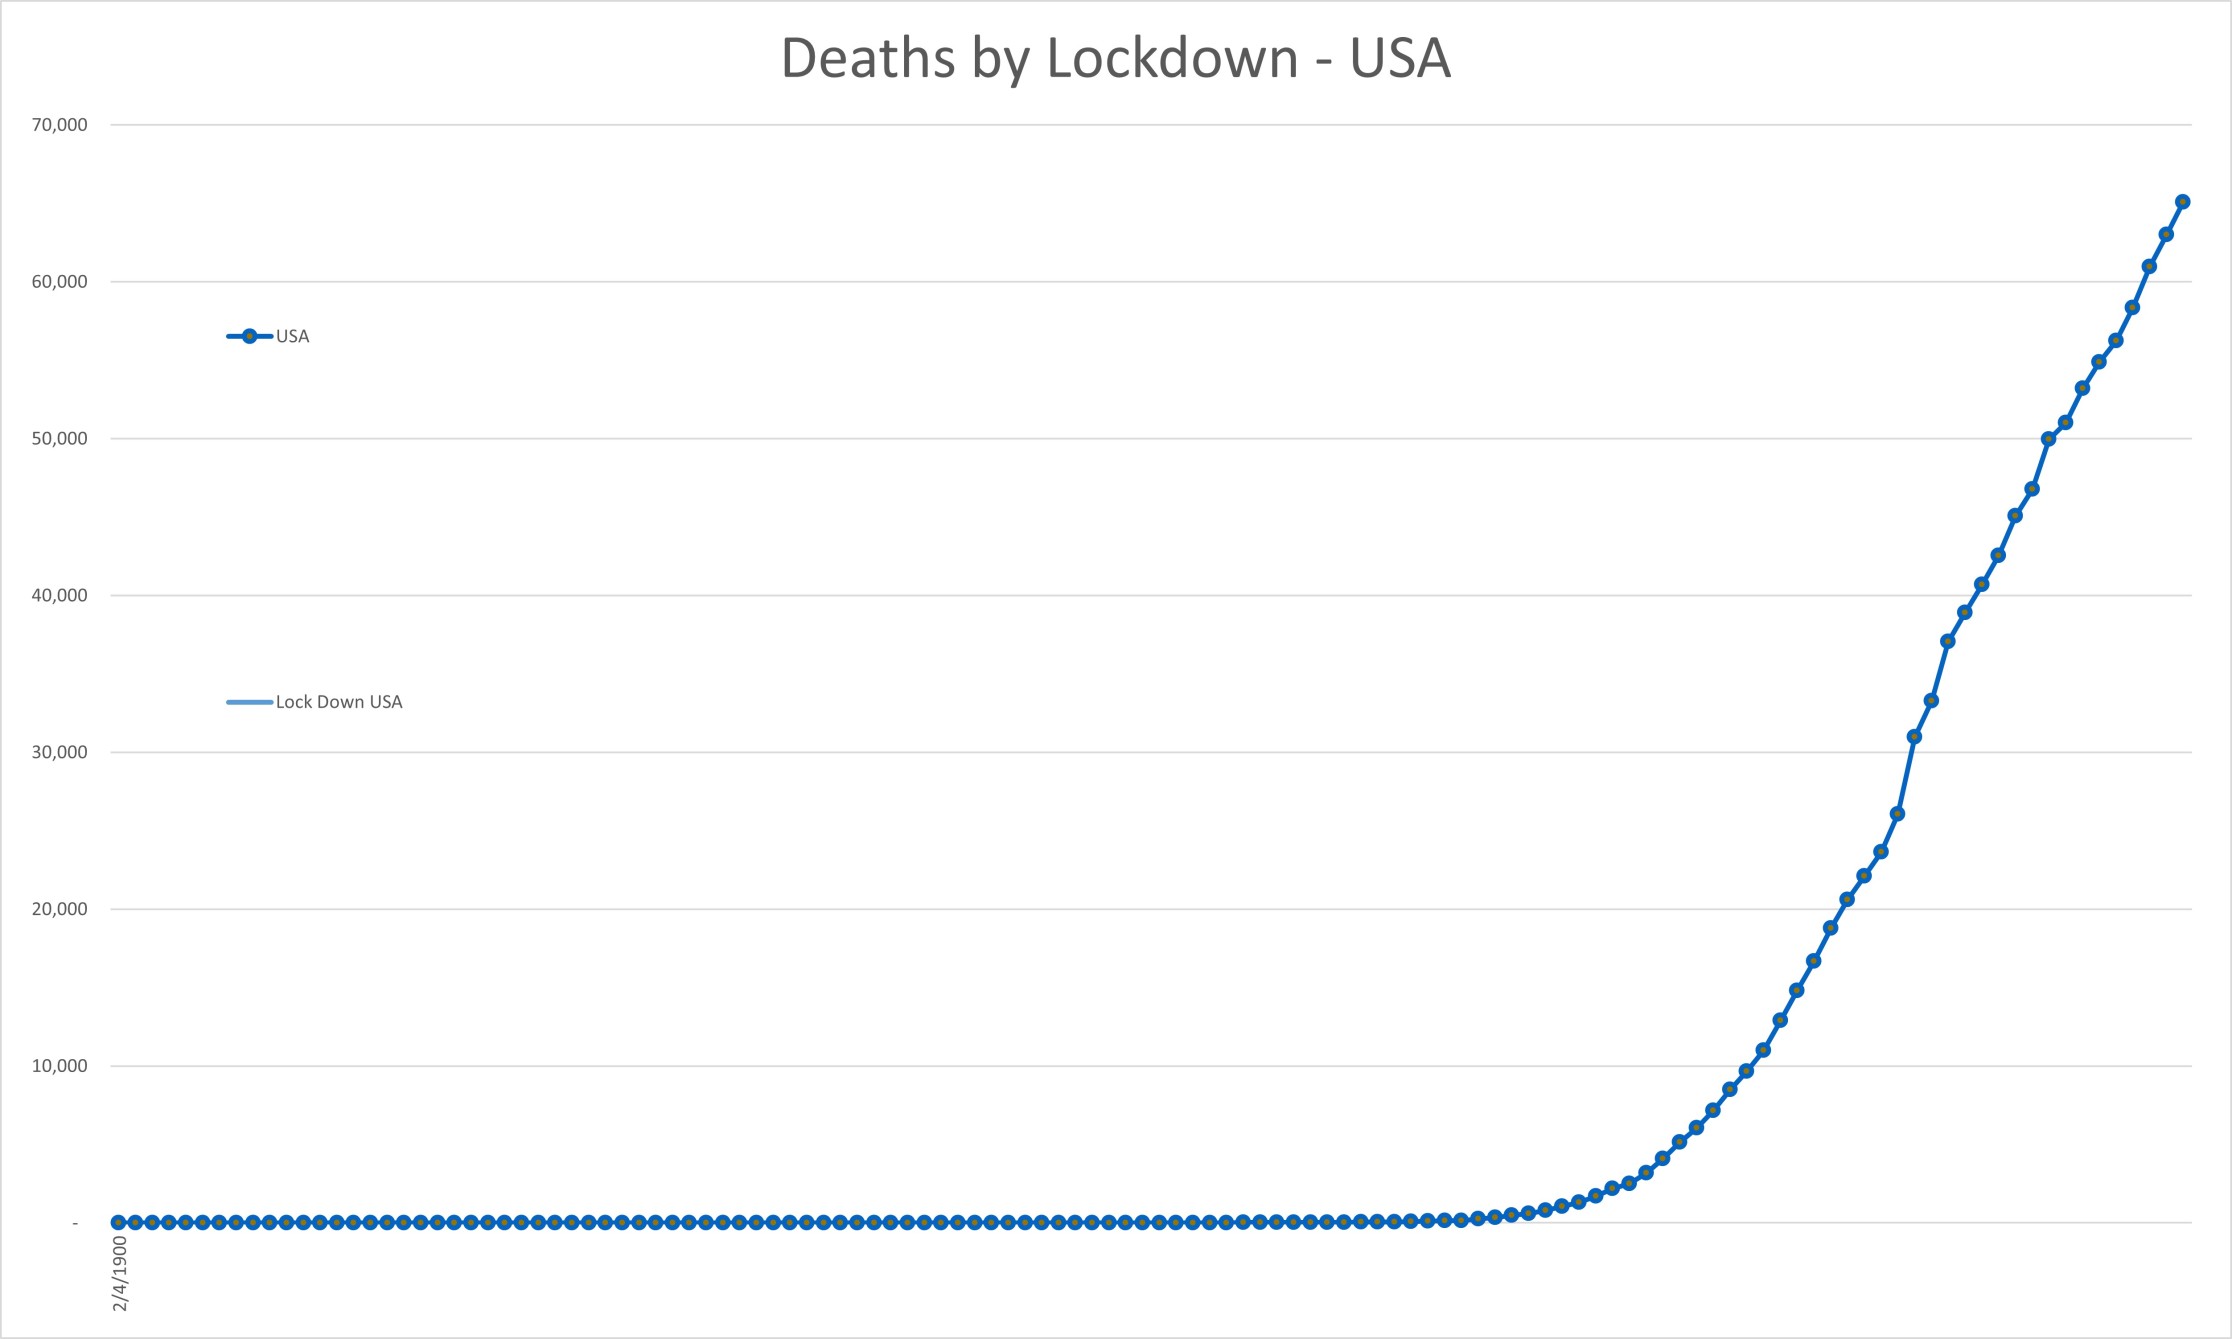
For the US, in the first 132 uncontrolled days a total of 1,050 deaths were reported. From that lockdown to May 2nd, 2020, a total of 37 days, reported deaths increased to 65,570. That meant that at the time of lockdown, there had been an average of 7.95 deaths per day in the USA from breakout to lockdown, but an average of 1,772 deaths per day since the lockdown. Again, did the virus suddenly get more deadly after the lockdown? Now we know that the virus was spreading exponentially so it is not this simple. However, in the US we know that the virus had been spreading since the beginning of January 2019 (based on the first confirmed US, non-travel/community infection death). Since testing started in the US the test to positive case ratio has maintained a steady level of 20%. Based on this there could have been up to 234,000 COVID 19 deaths in the US from November 16th, 2019 to the date of the first lockdown on March 26th, 2020. Where are all the bodies?
We know these numbers are excessively large and unsupportable, but then again, so are the reported deaths of COVID 19. The figures above are based on the same calculations and base numbers used to justify the lockdowns, so why do they look so strange, but the numbers reported everyday don’t?
If the reporting of deaths from (as opposed to with or possibly with) COVID 19 and COVID 19 infection spread has been accurate since the lockdown, where are all the excess bodies?
The reality is there are no excess bodies. The infection is widespread, and the mortality rate is not as high (or even close) to what is being reported. The vast majority of reported COVID 19 deaths have been due to significant co-morbidities, not COVID 19. So, what is the real reason for these scary red maps and excessively large numbers? Dr. Artin Massihi and Dr. Dan Erickson might have the answer [Video Link]. [Article Link].
If you don’t read another word, just watch this video all the way through. They don’t have all the answers, but the answers are out there if you know where to look. At the end I guarantee you will come back and you will want to know more.
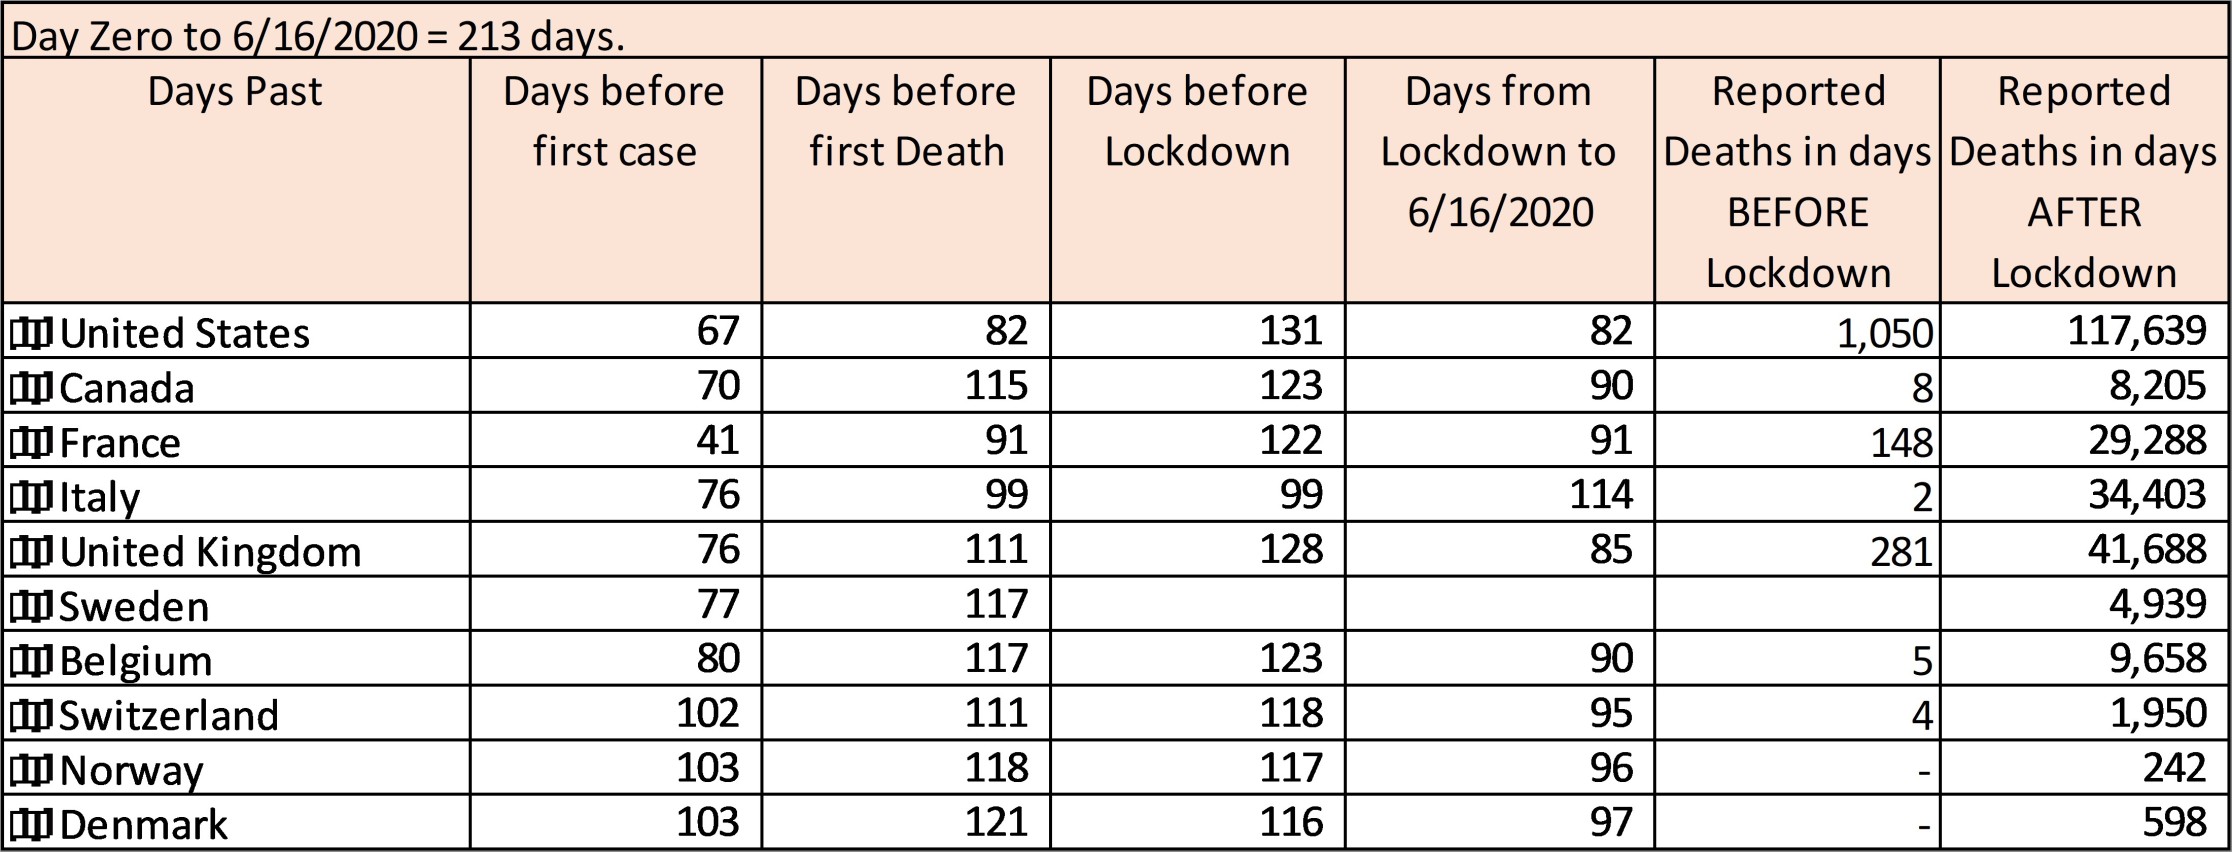
You can wash and repeat for the numbers for each in the charts above (or any country, outside of China).
As you can see. Based on the reported deaths, allegedly minimized by the lockdown, there should have been an order of magnitude of deaths in the prior 131 days before lockdown in the US. Yet overall mortality in every country remains fairly static.
The spread of a virus.
We have all seen the ever glowing red maps of reported cases and death exponentially predicting an almost ‘end of days’ scenario. But what are the facts behind these images?
We have all been told we have to lock down and isolate to get this under control.
However, what if this is based on a false assumption of the spread rather than a true tracking of the virus?
Question: Are we really tracking the spread of the virus?
Answer: No, we are tracking test kits.
Positive Cases
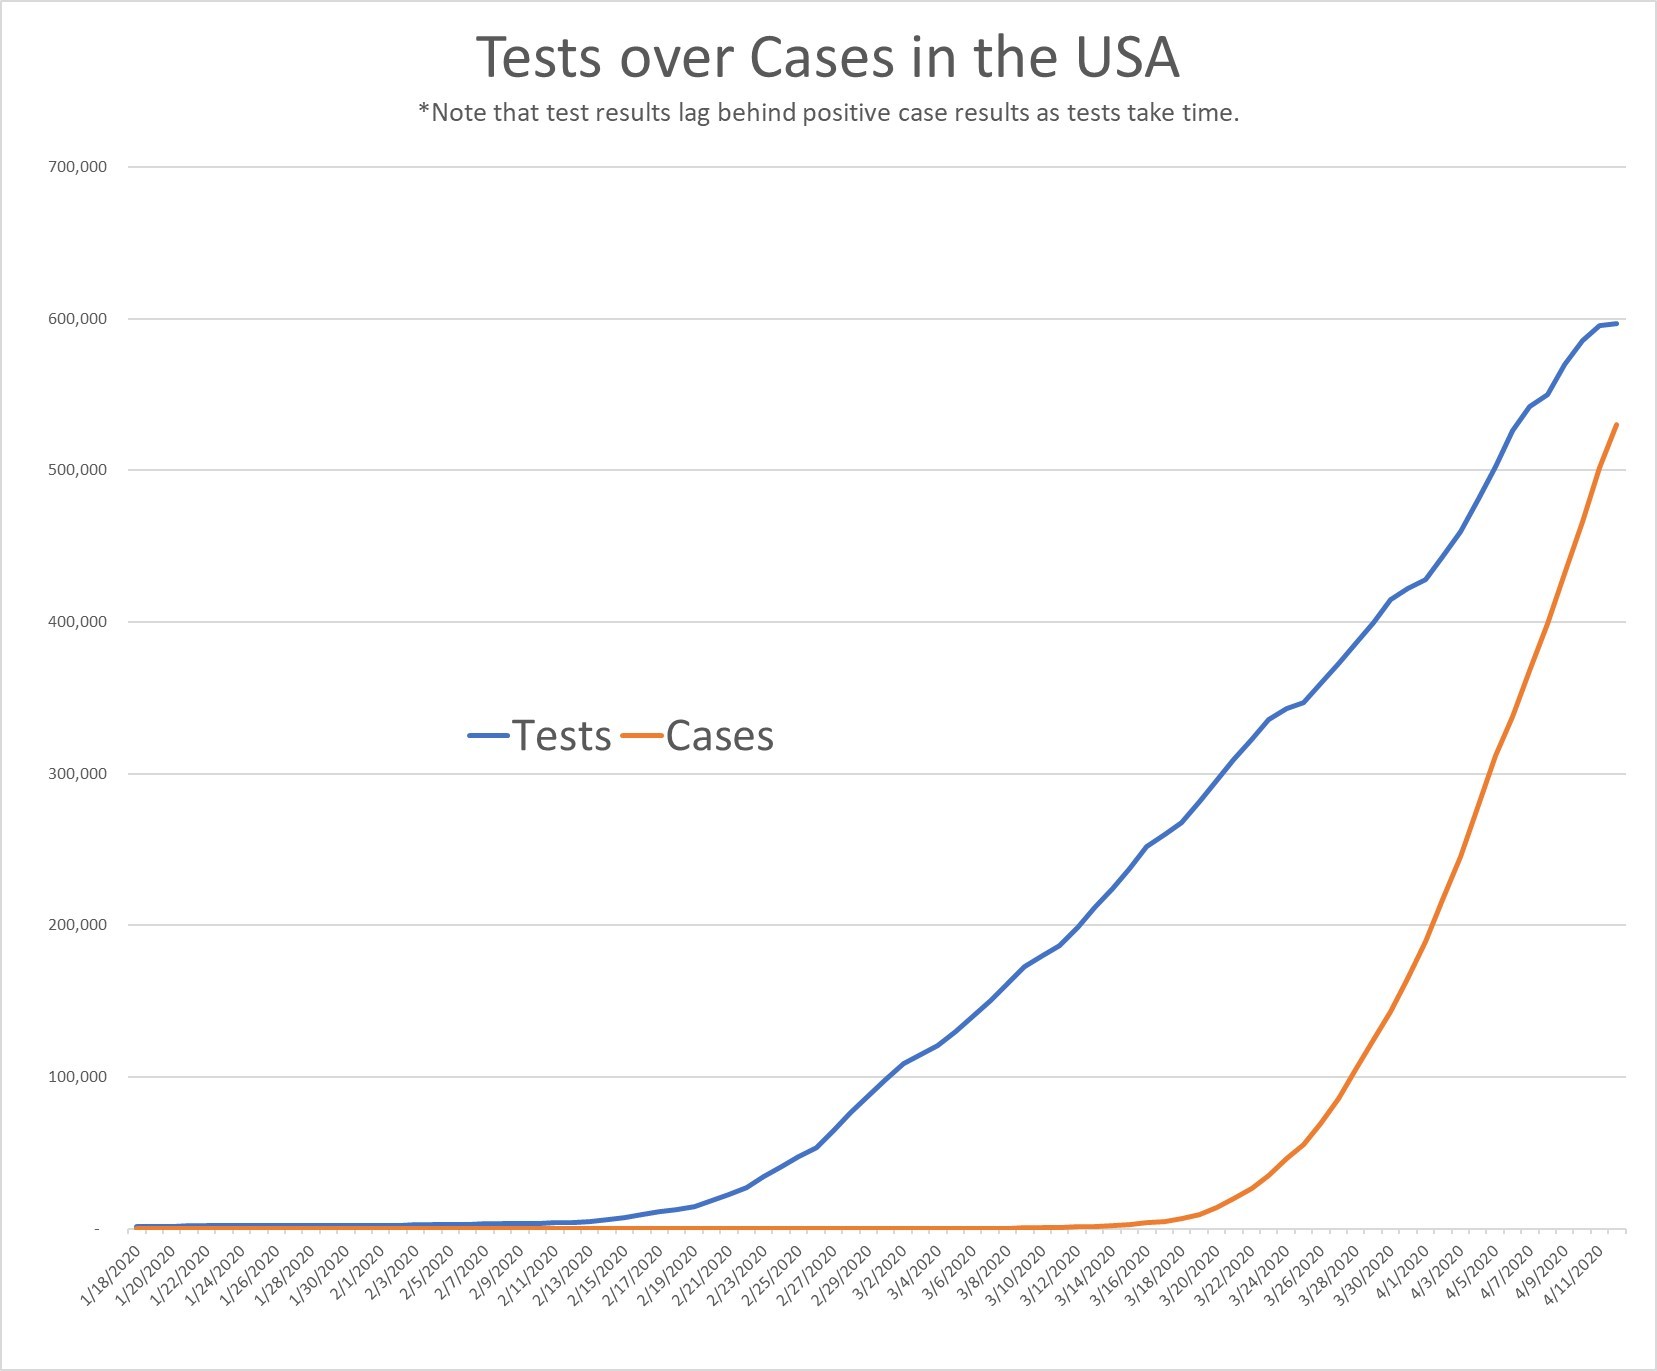
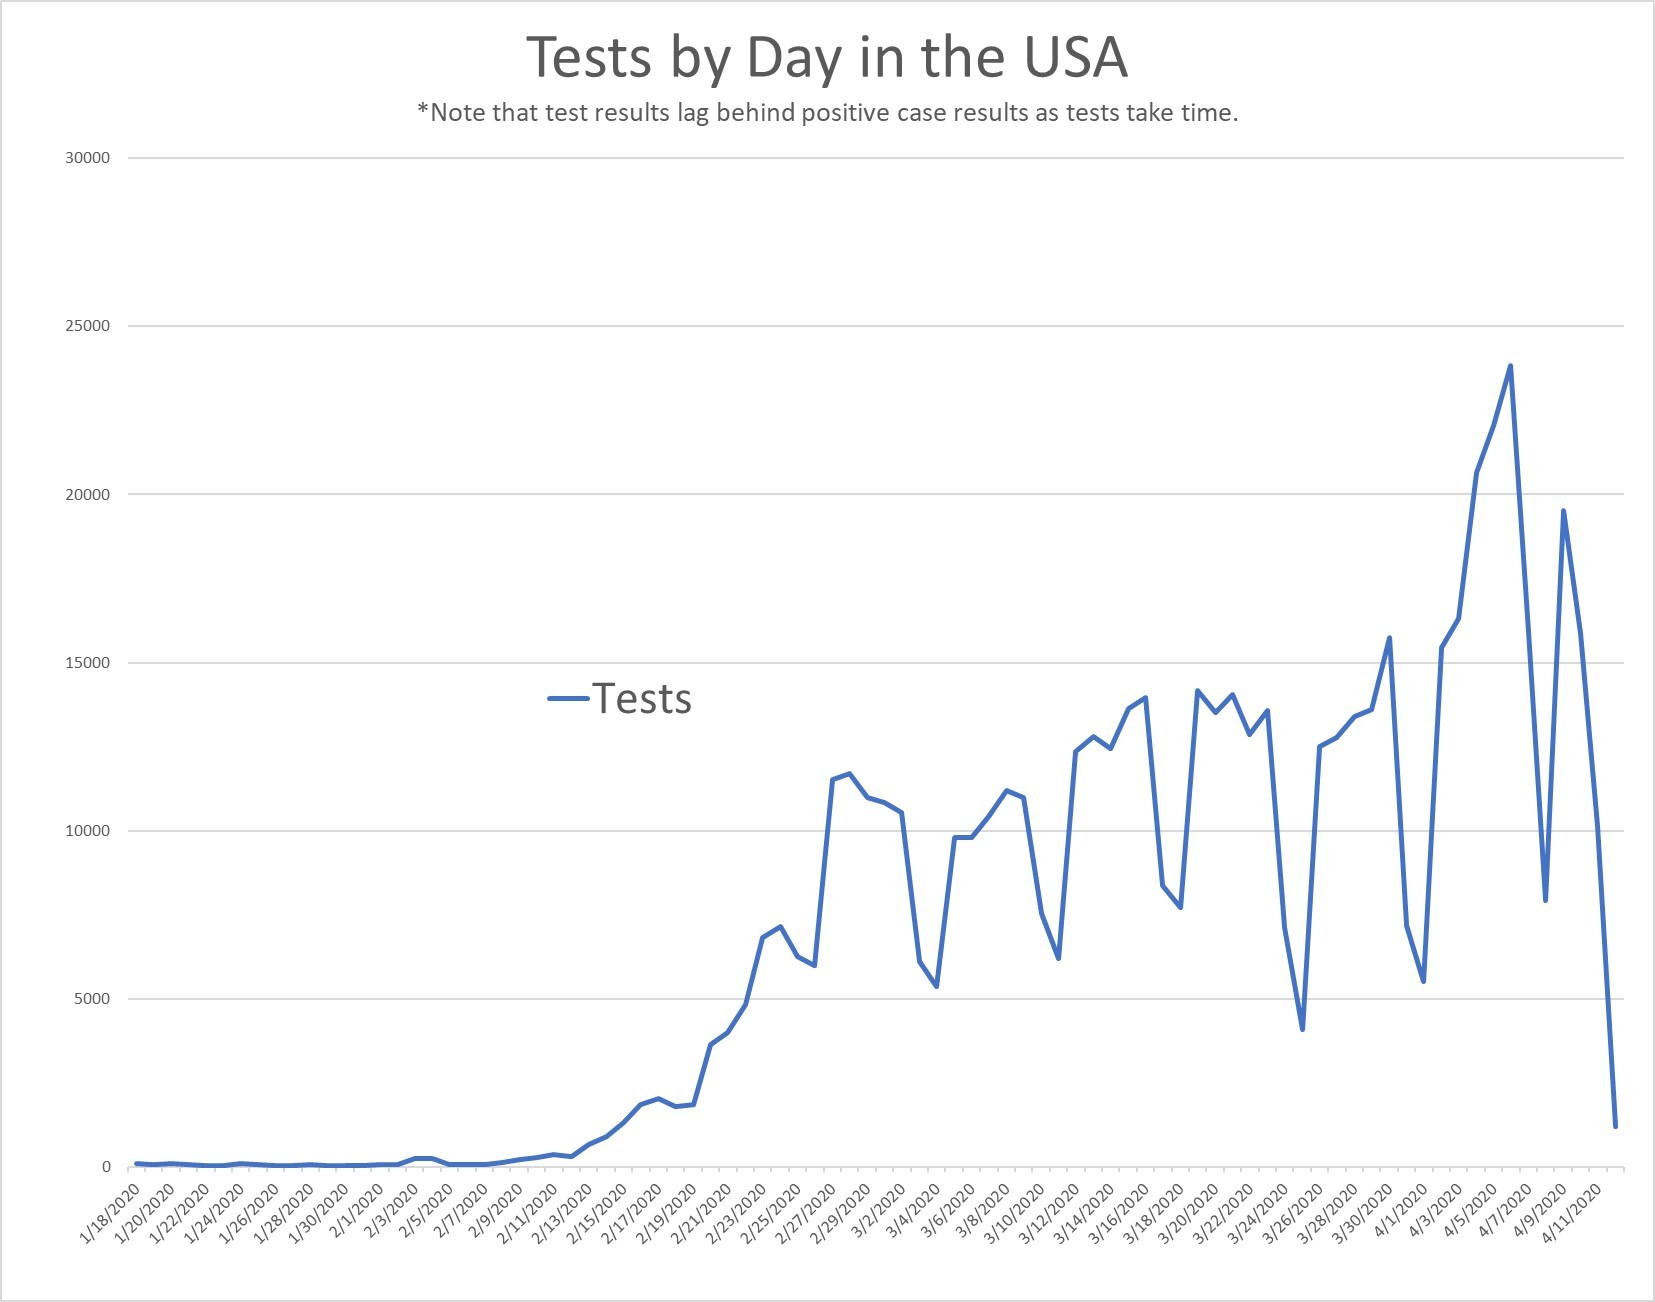
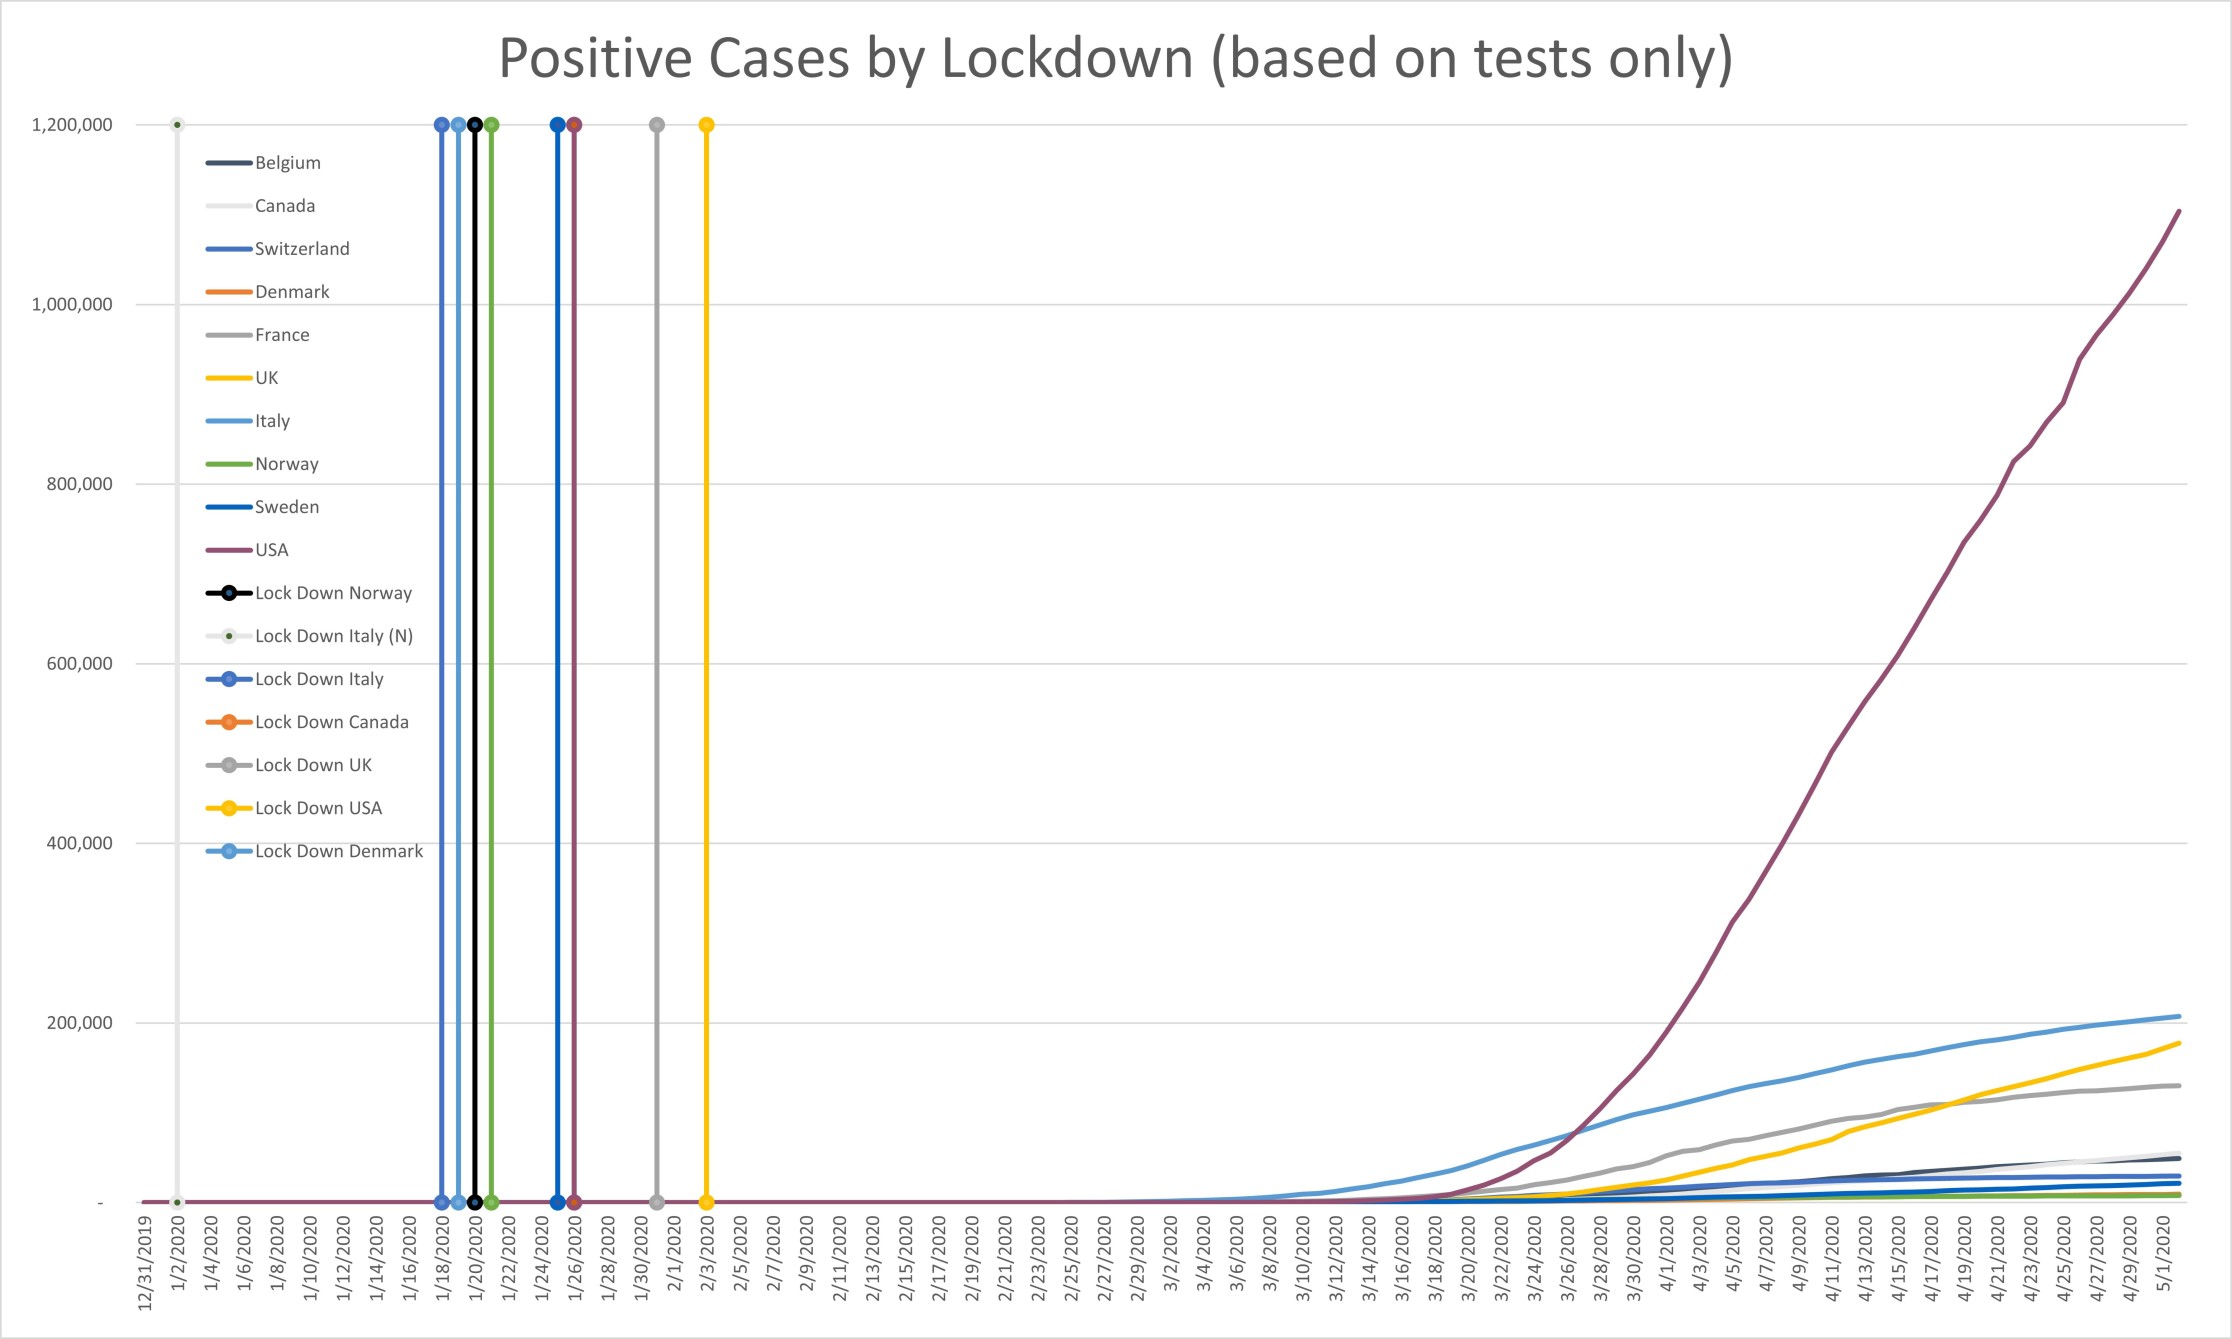
The chart below shows the trend of ‘Positive Cases’ climbing in line with tests performed. Note that as the tests takes time to be confirmed, there is some lag from one to the other.
Notice something else... as tests are increased, positive numbers increase. So why are we using Positive Cases as an indication of exponential growth of the spread of the virus?
Current numbers show that 20% of the people tested in the USA have been positive for COVID 19. This has been a relatively steady percentage as testing became widespread.
If 20% of the population of the USA (331,002,651) already had the virus, we would see the same results. That would also put the estimates of those already infected to over 67 million people. That is beyond that of seasonal flu. Yet seasonal flu has already killed up to 62,000 people in the USA with less than 56 million infections this flu season alone.
With most of the world now in full lockdown, how is this working to stop the reported virus spread?
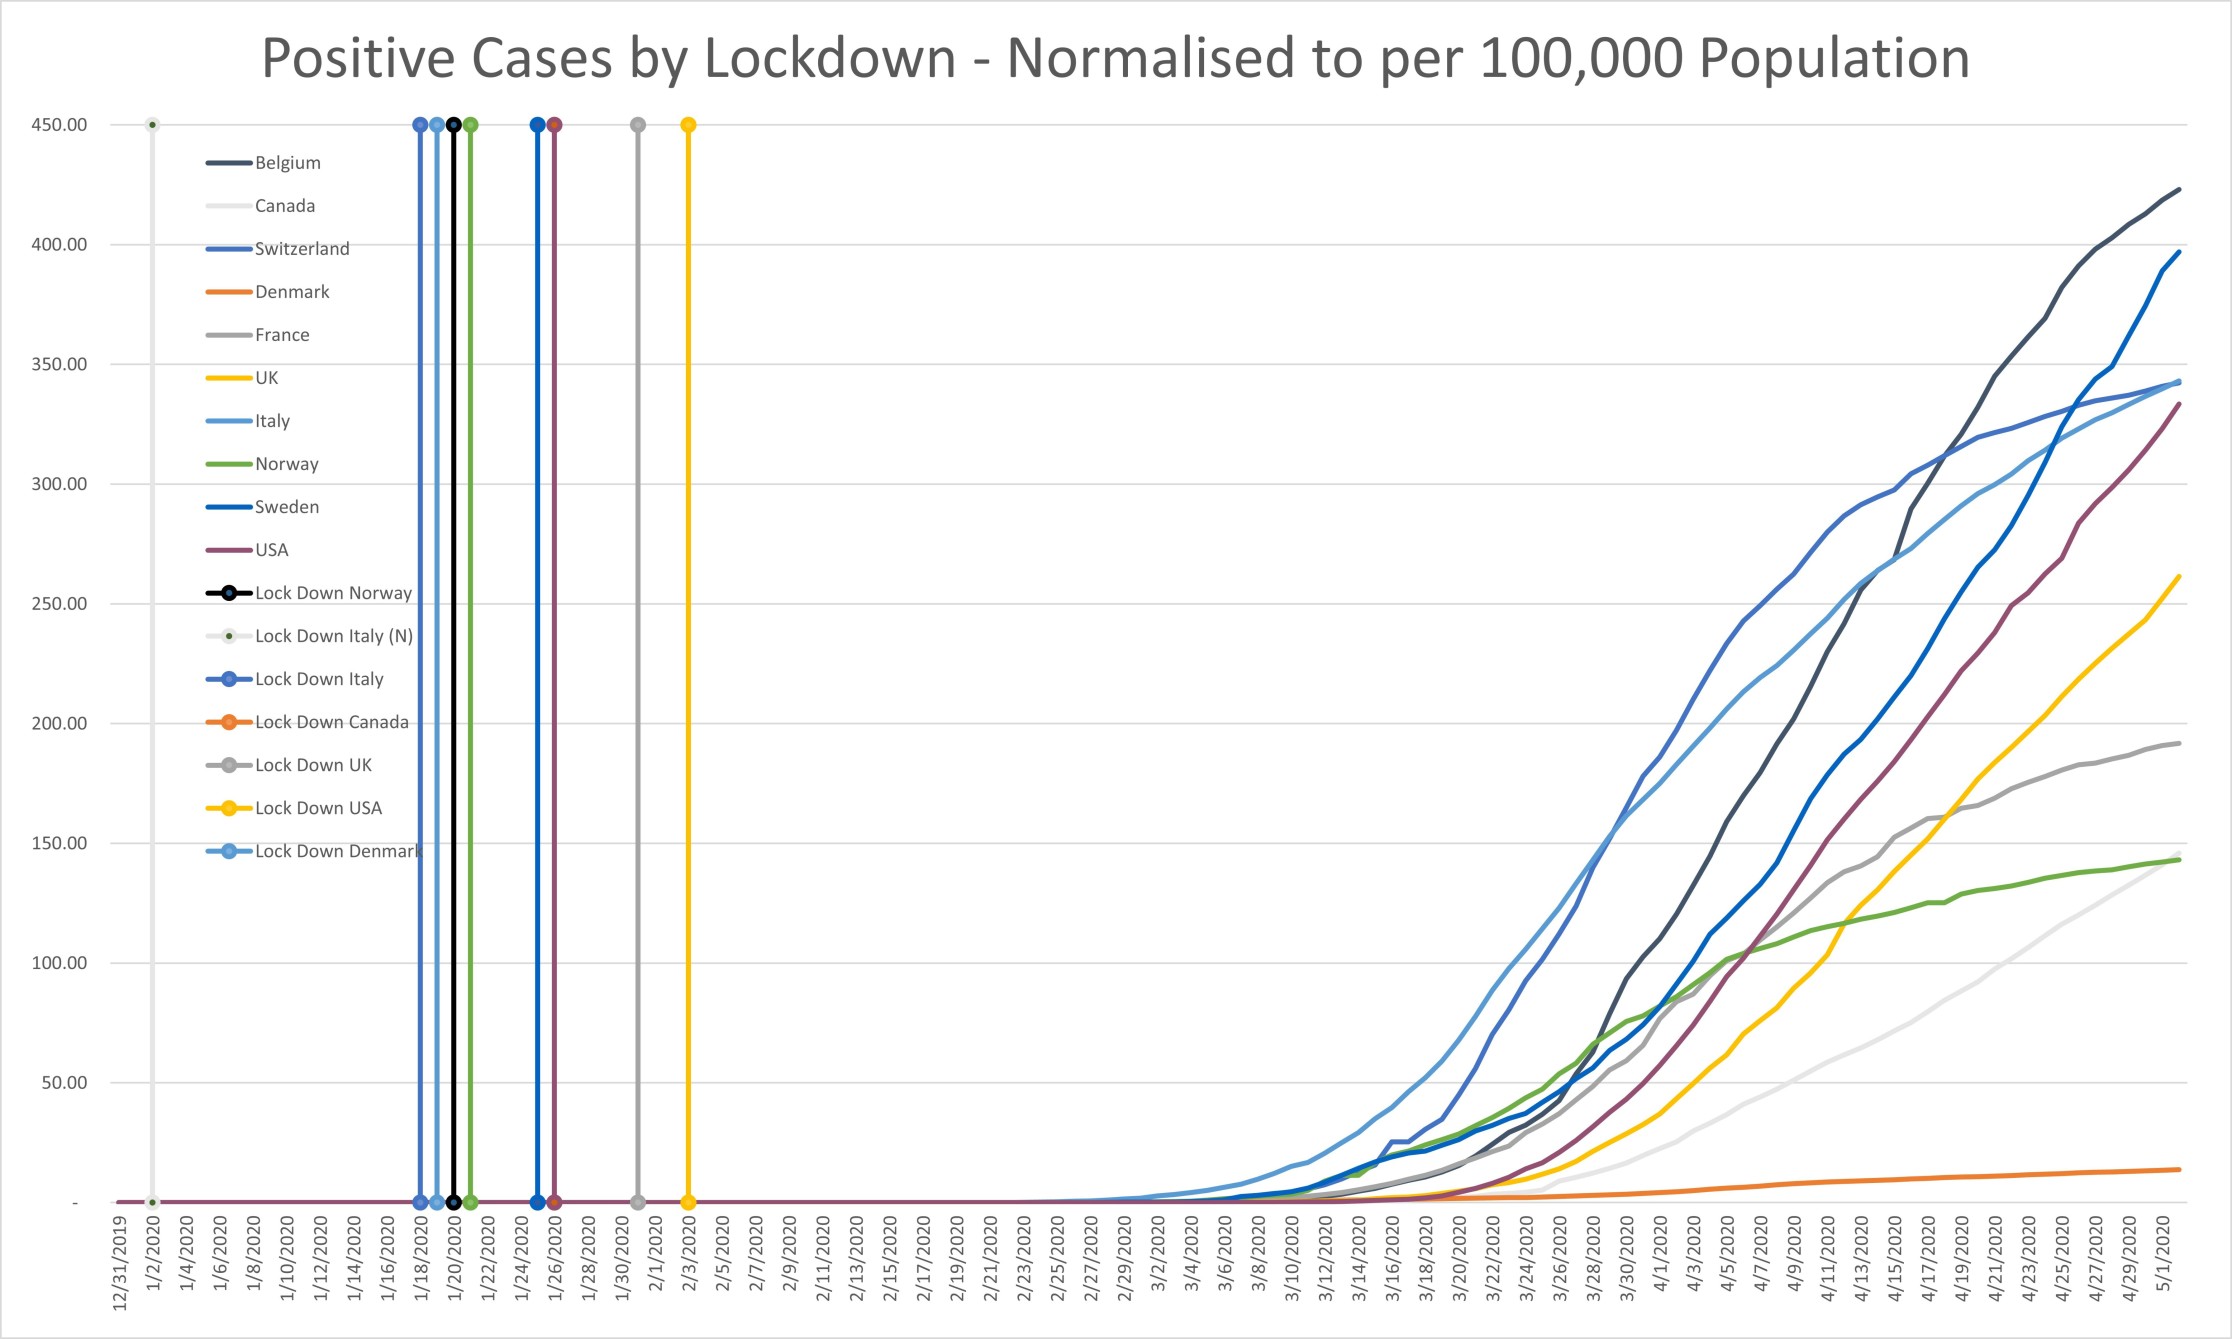
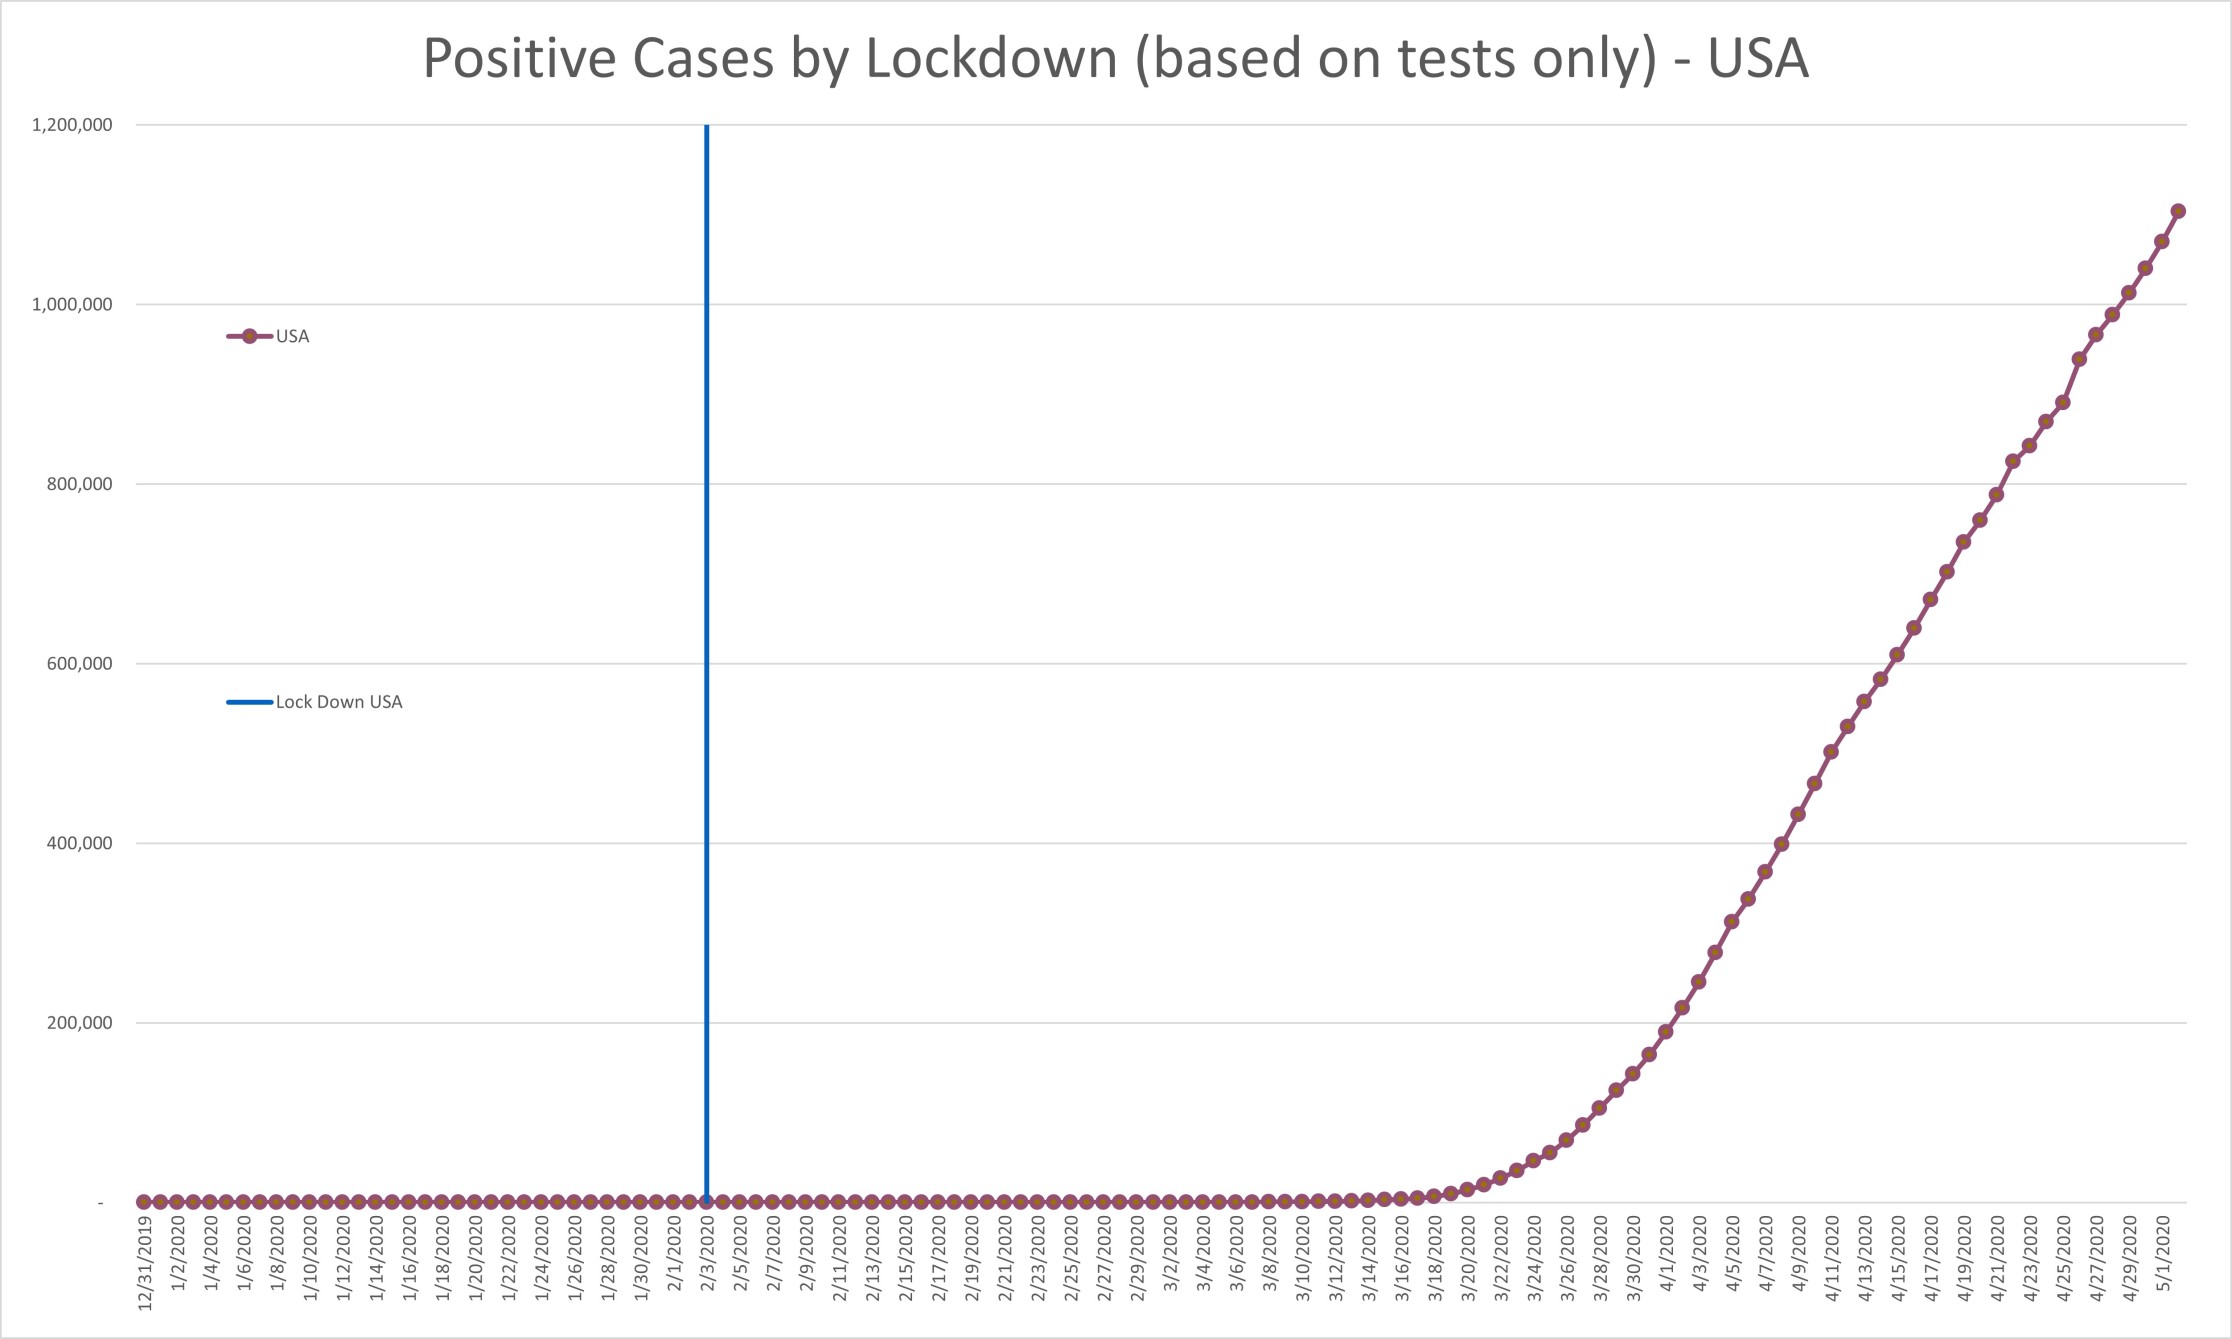
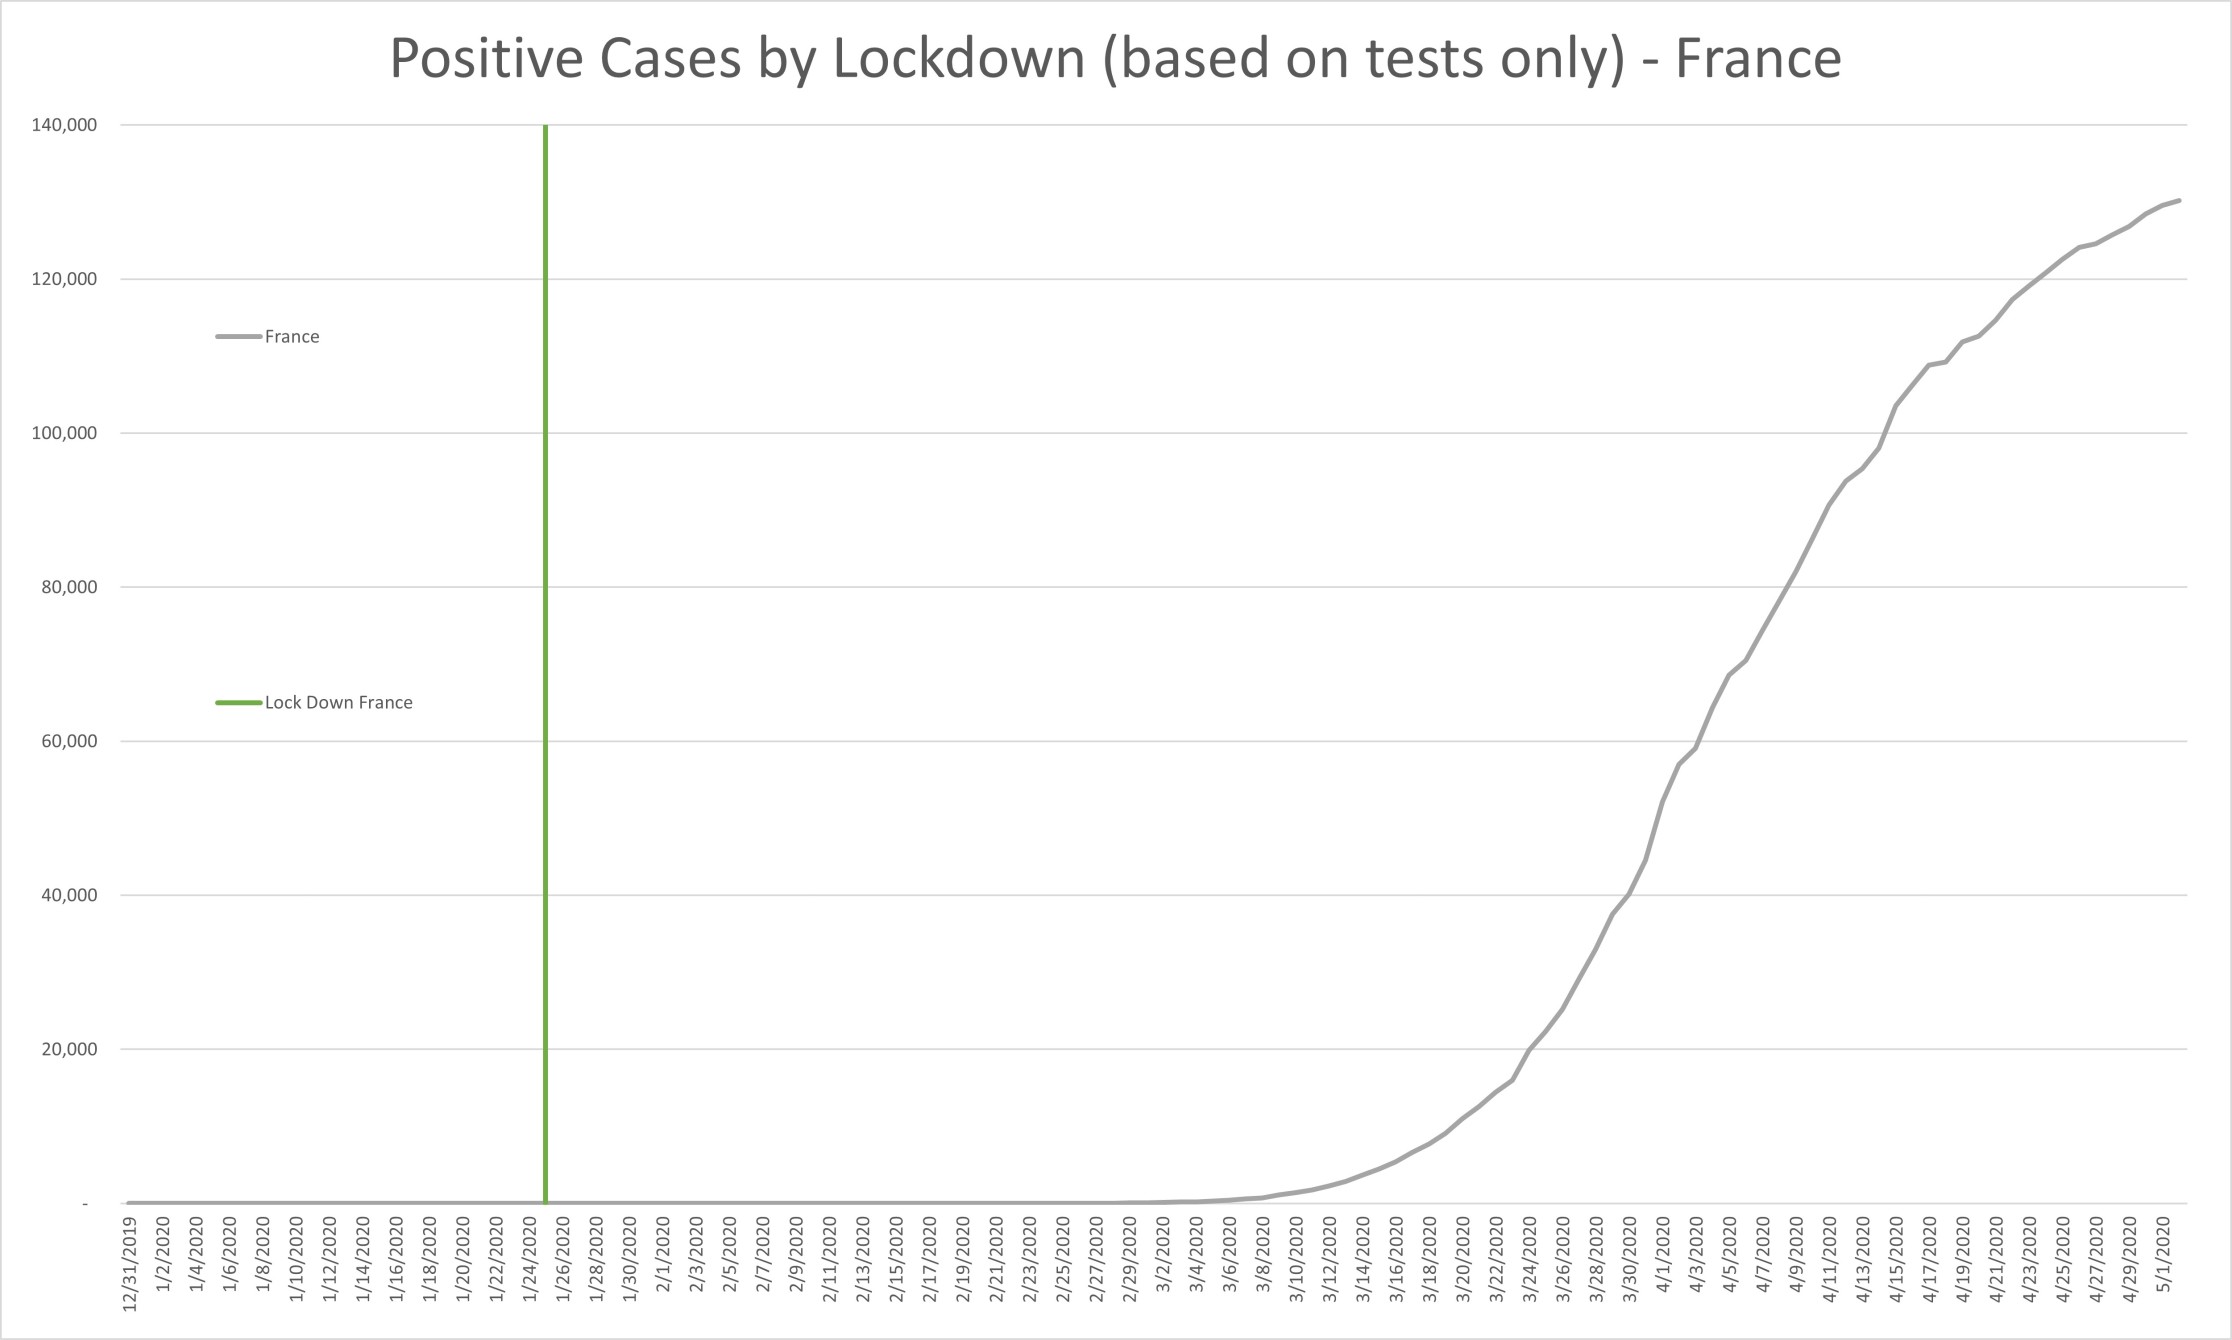
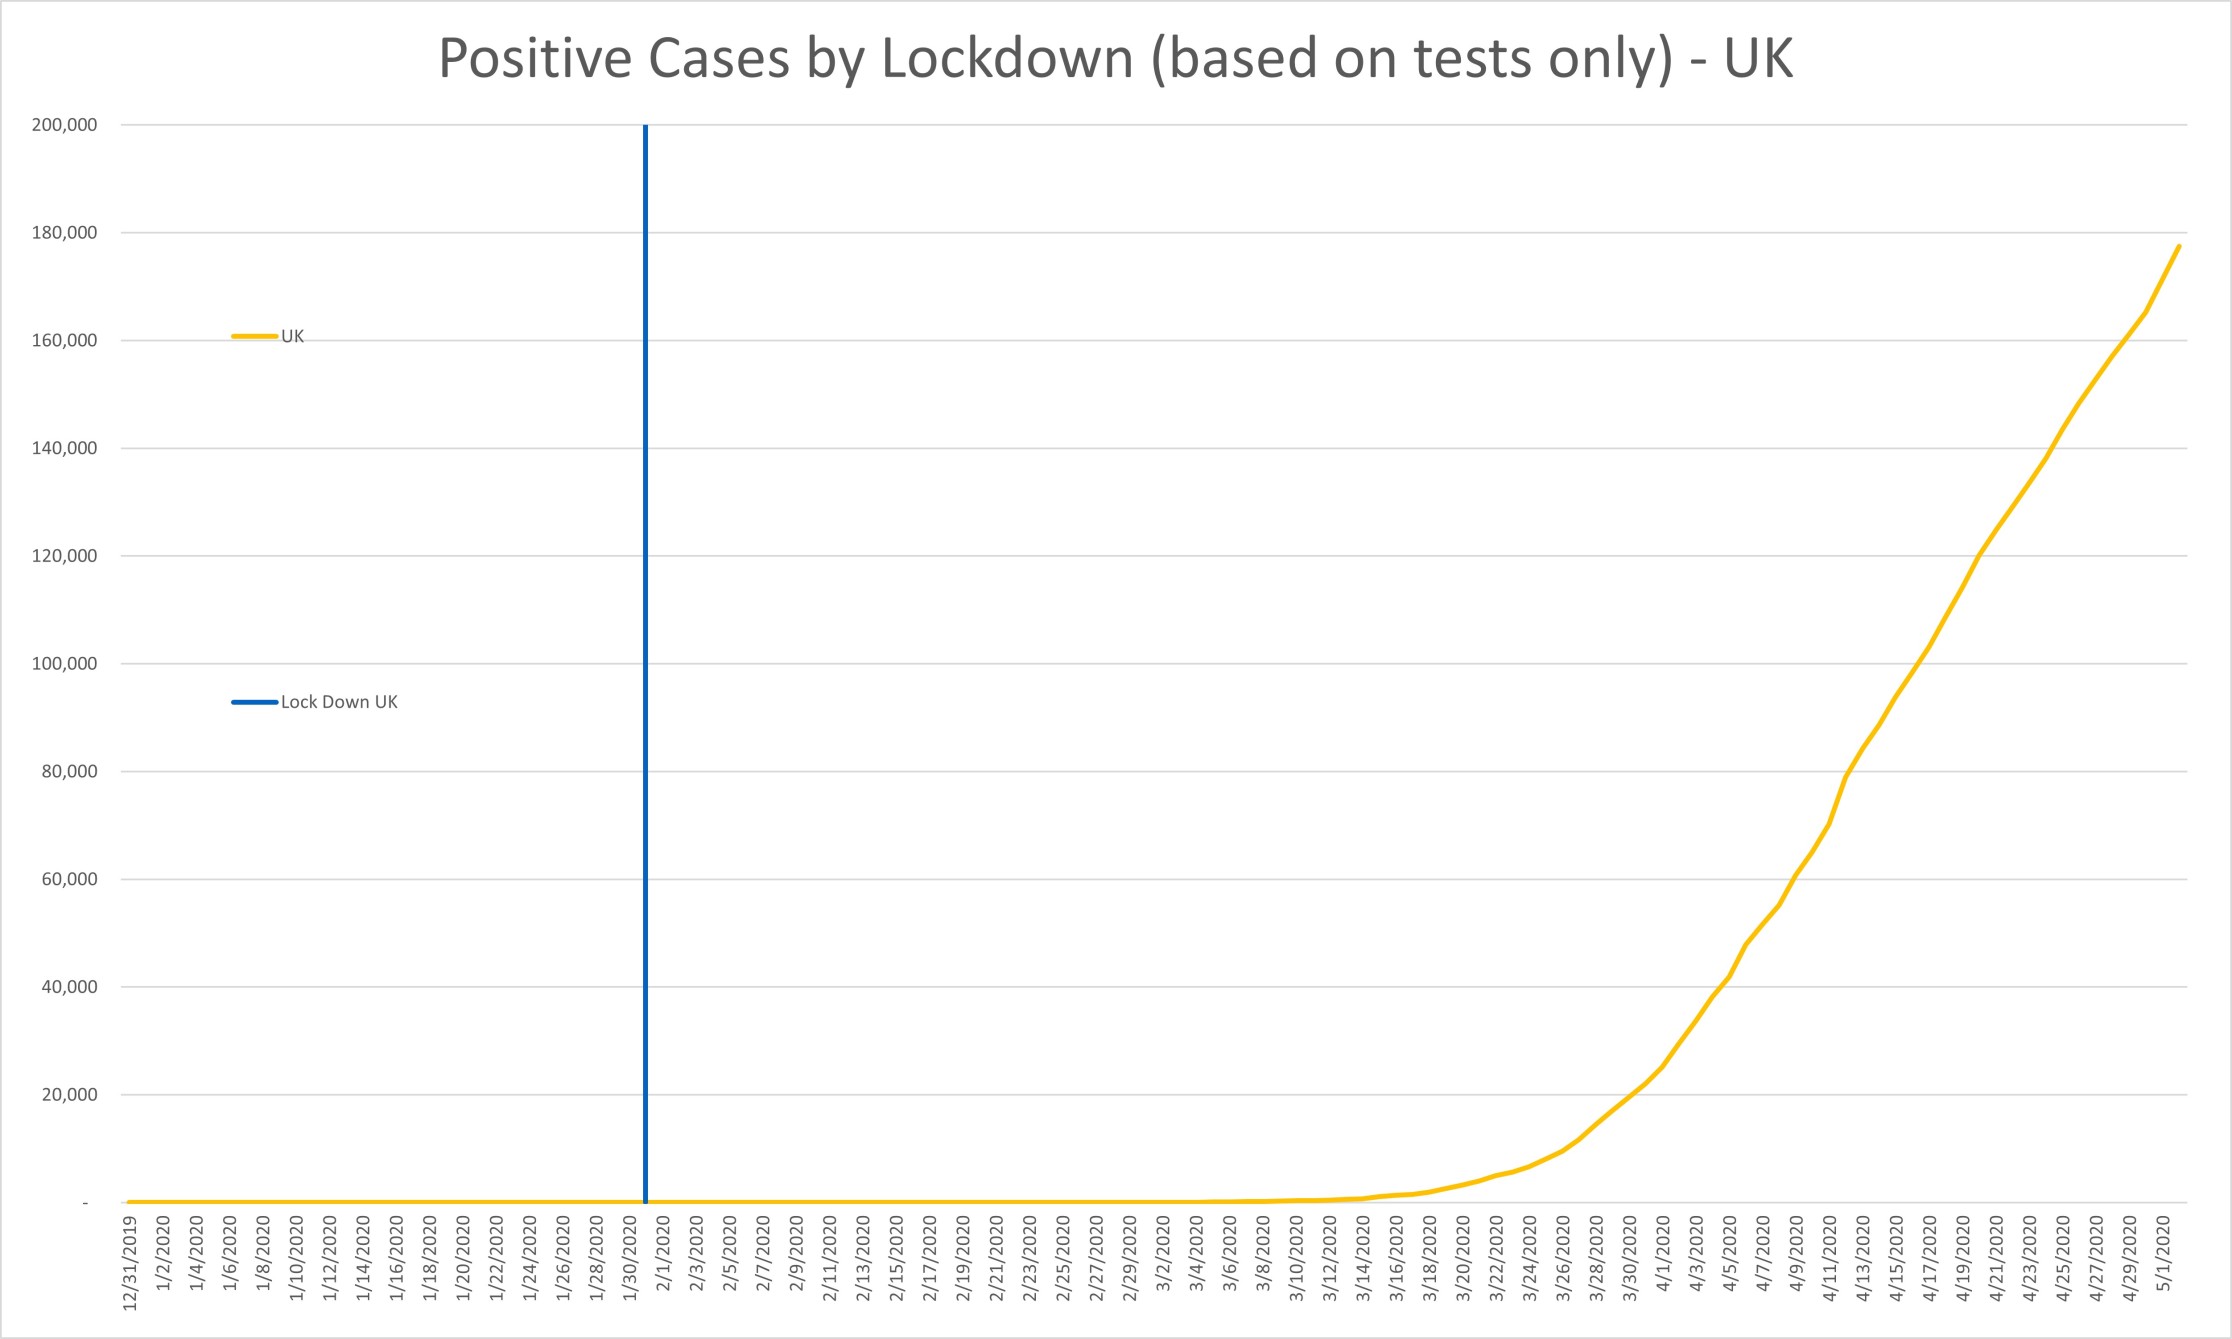
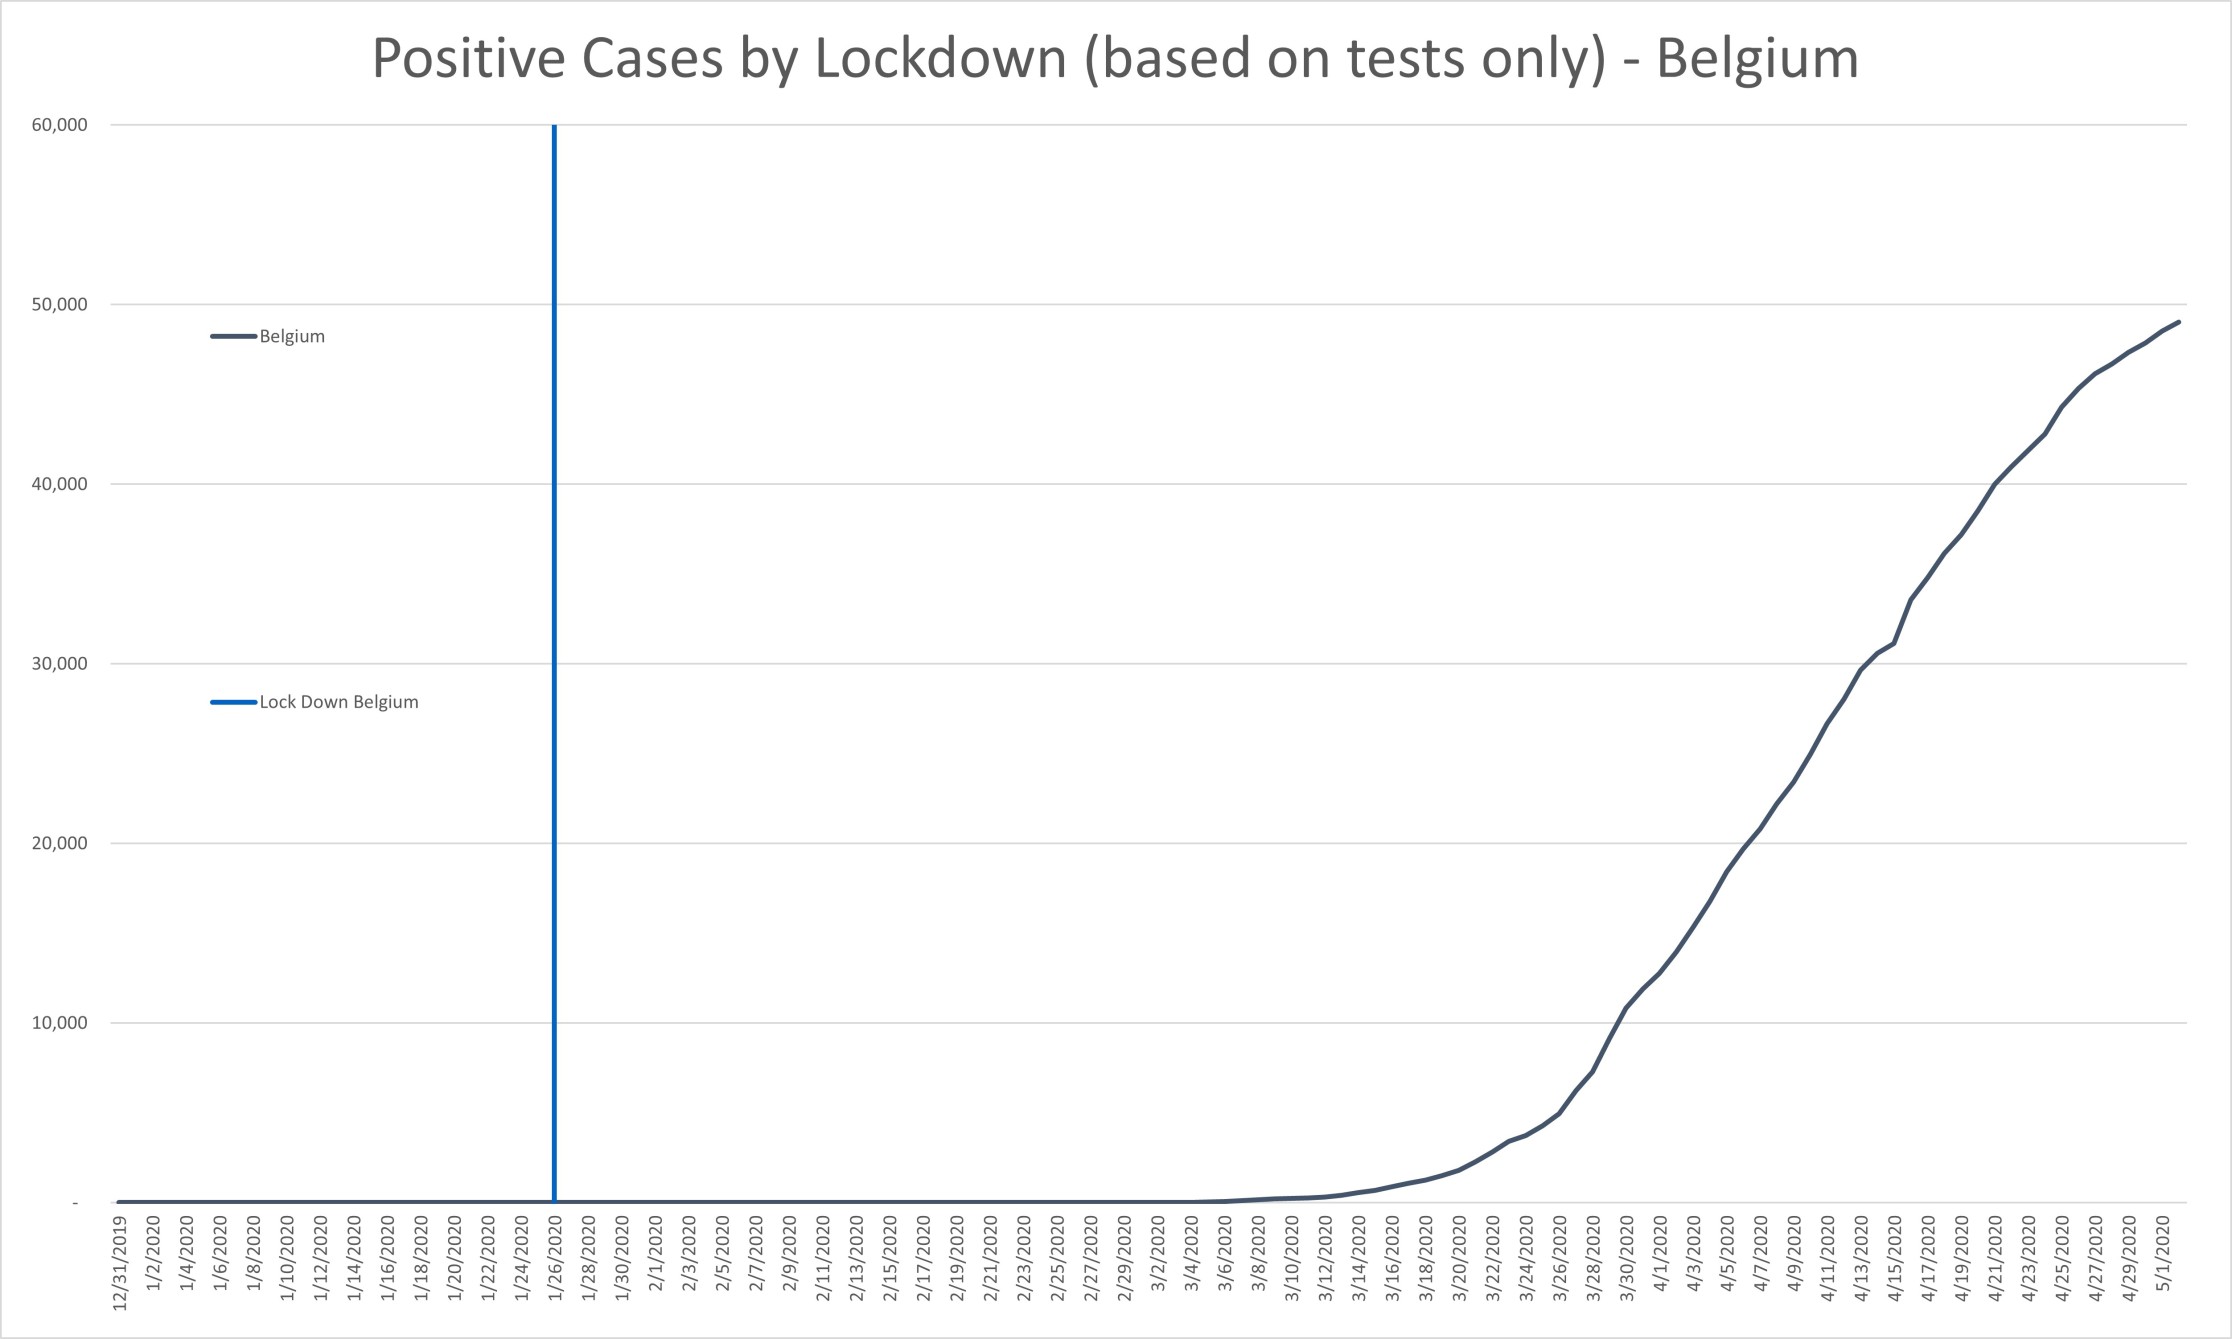
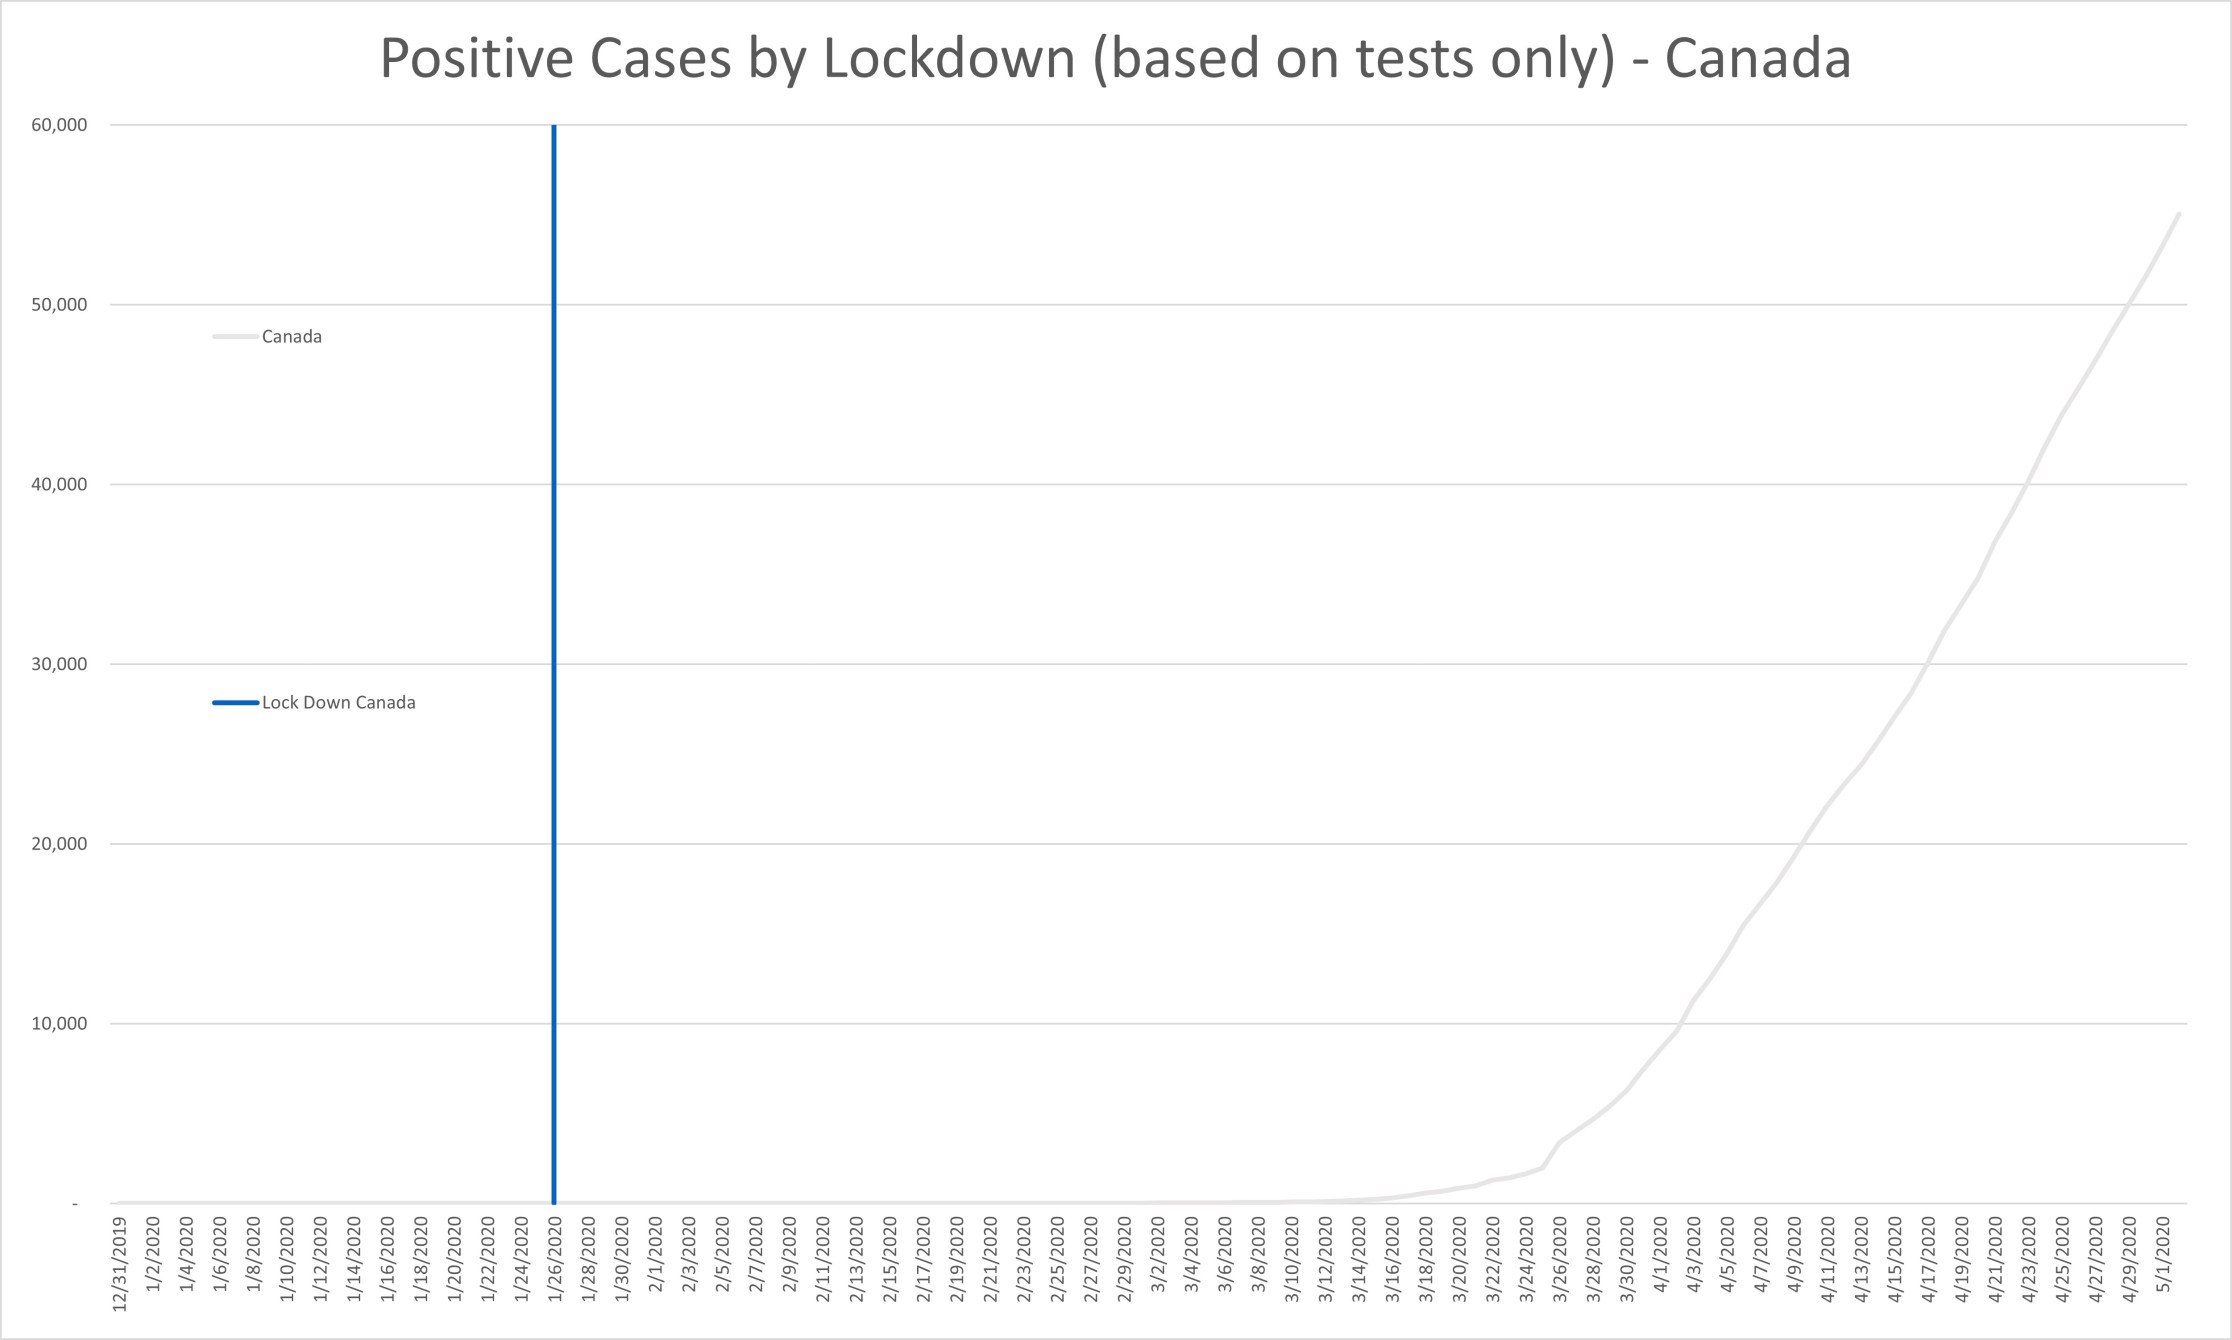
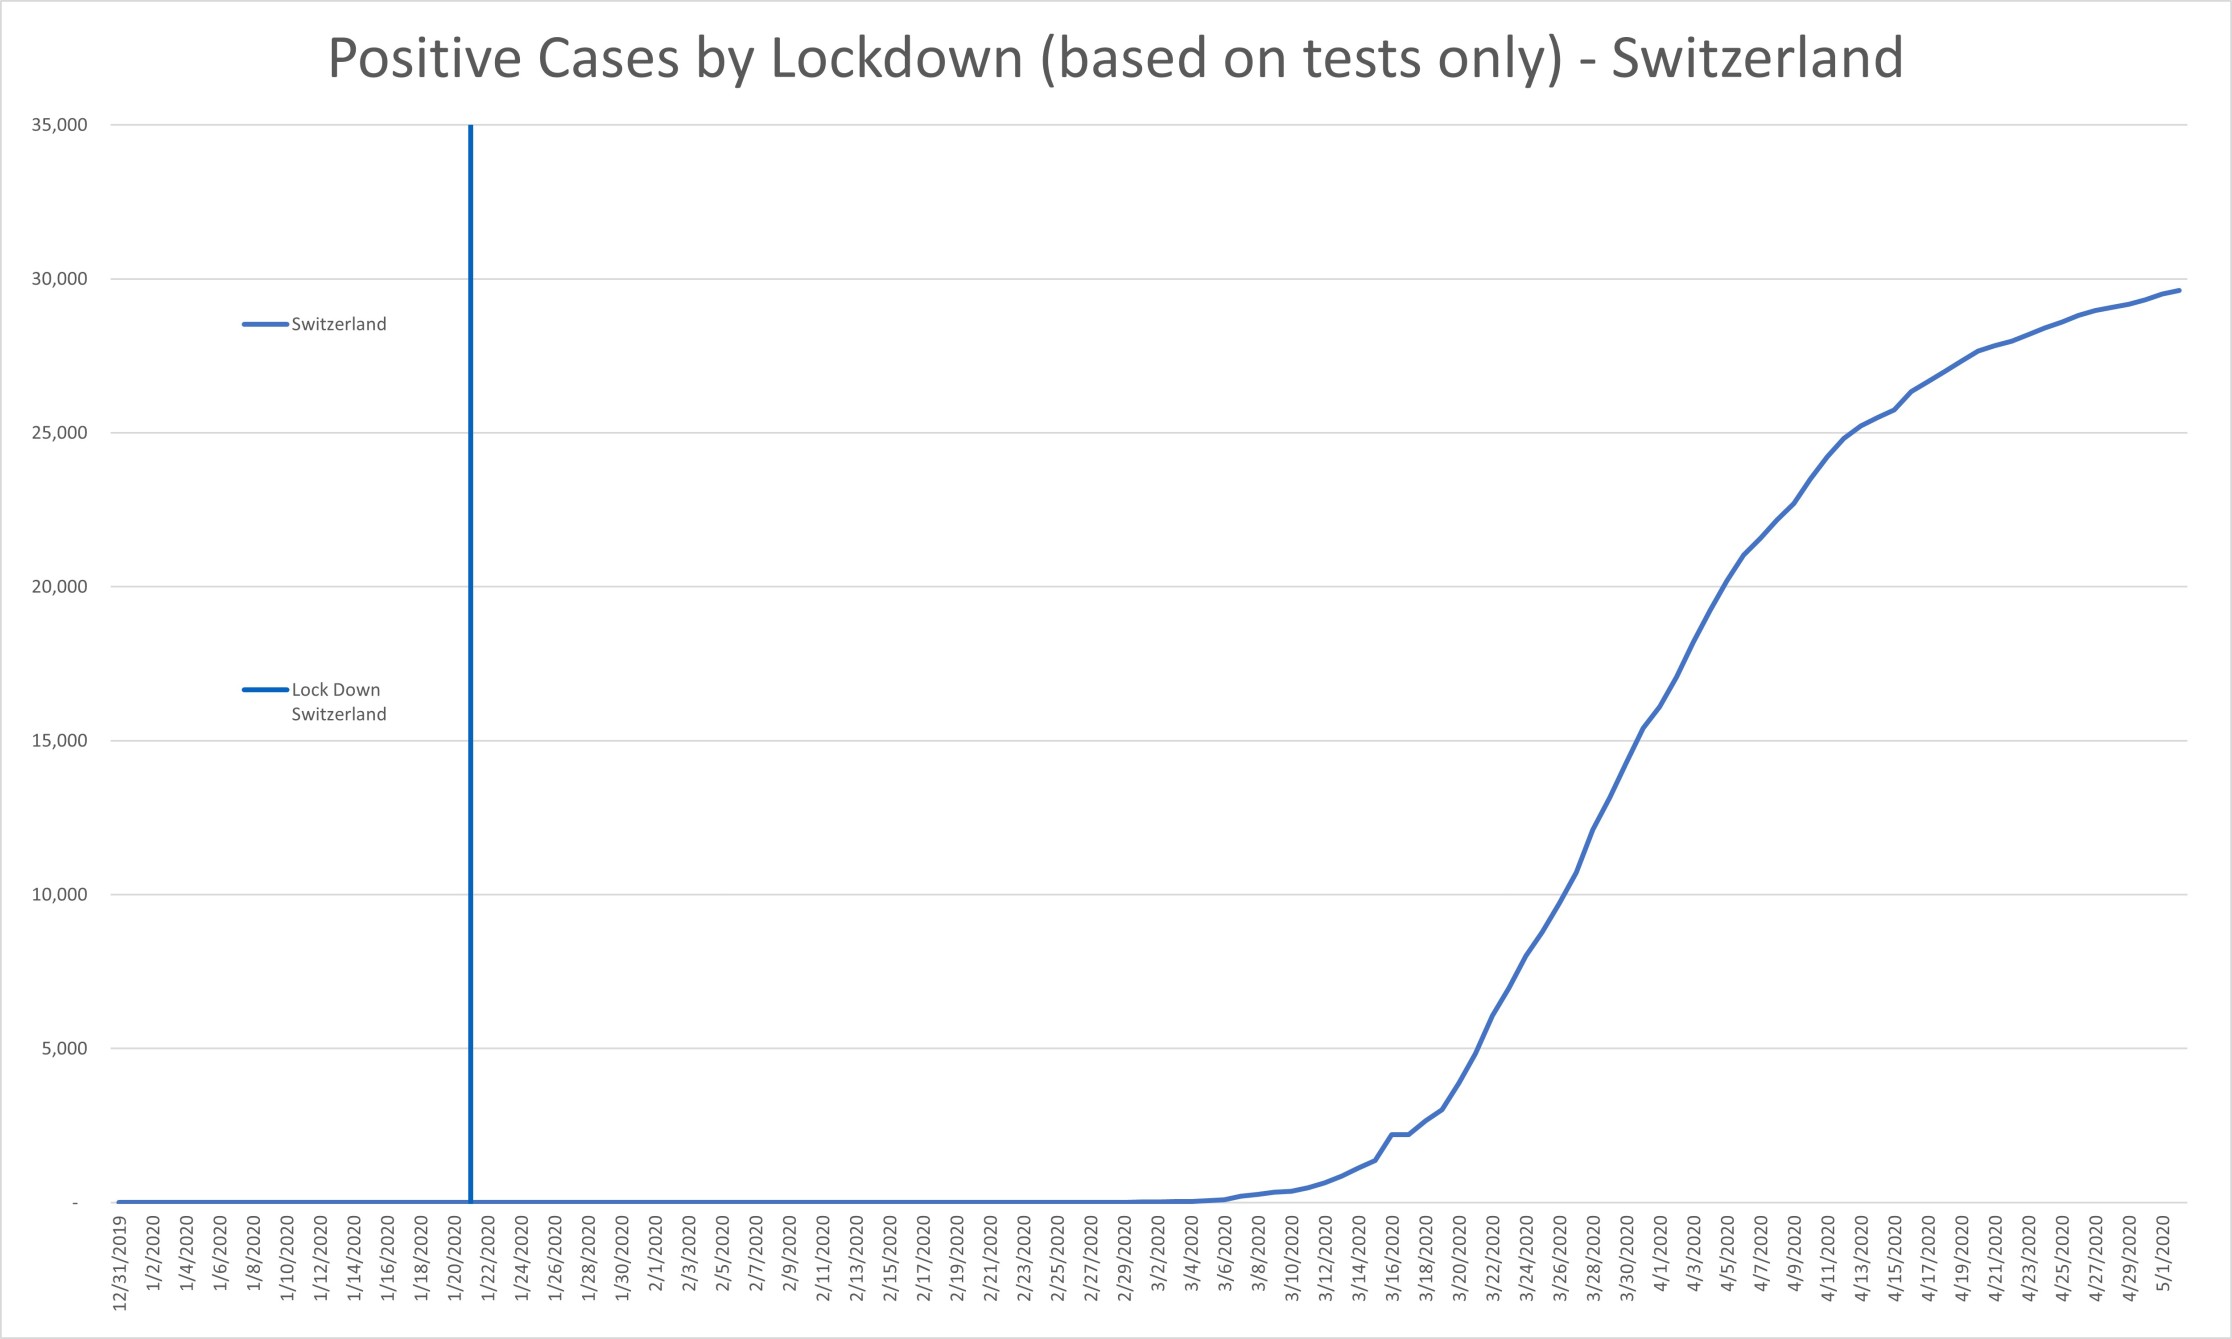
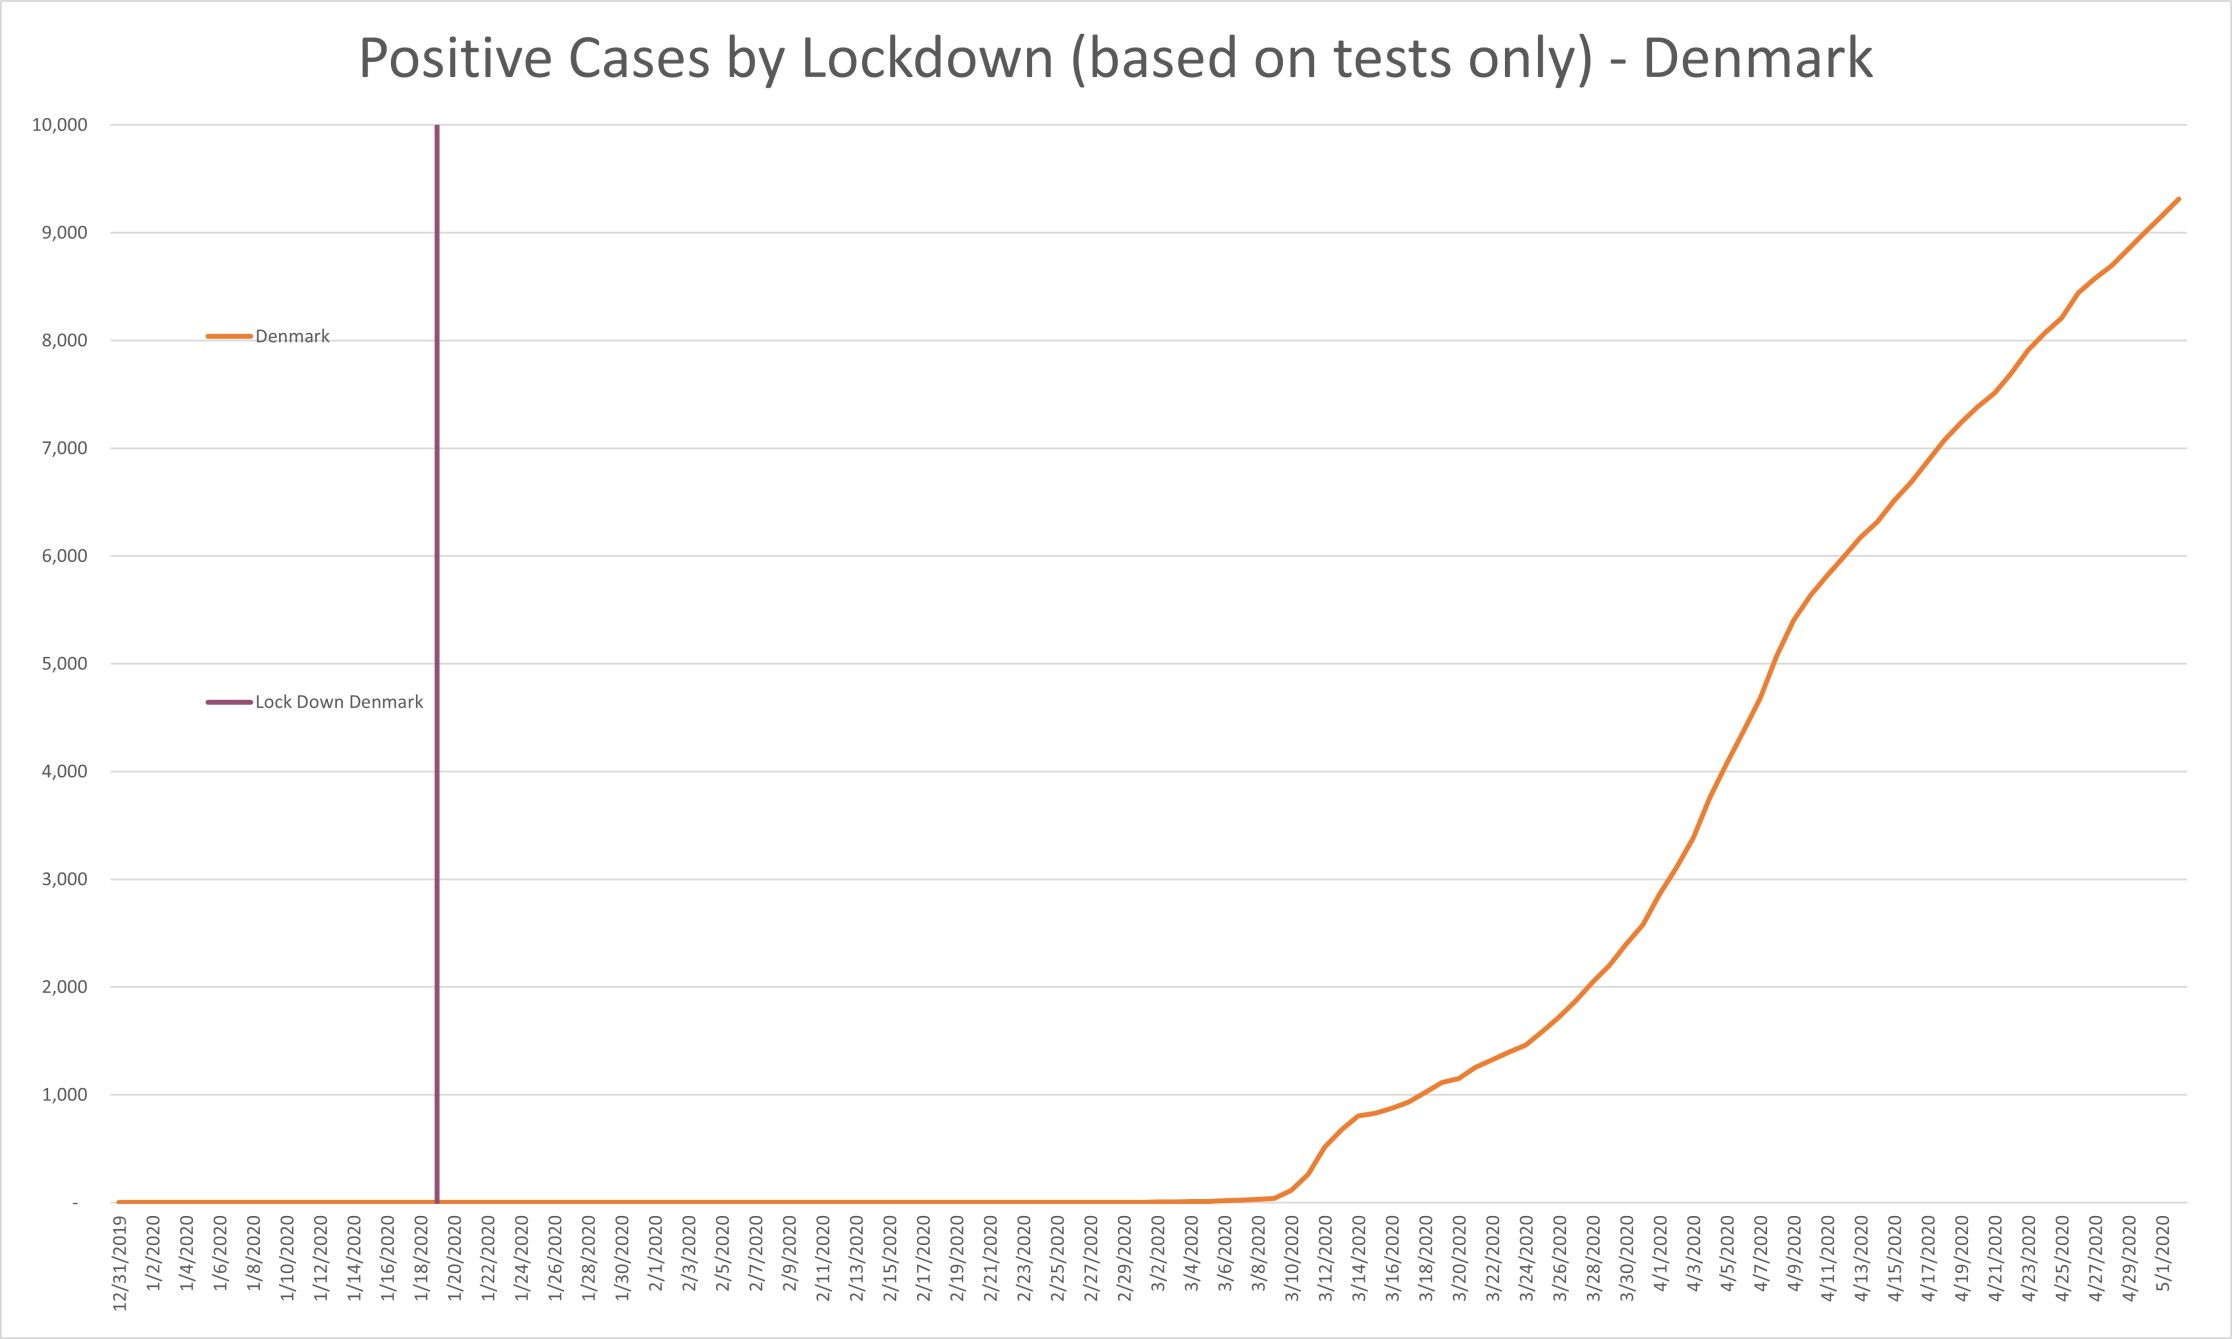
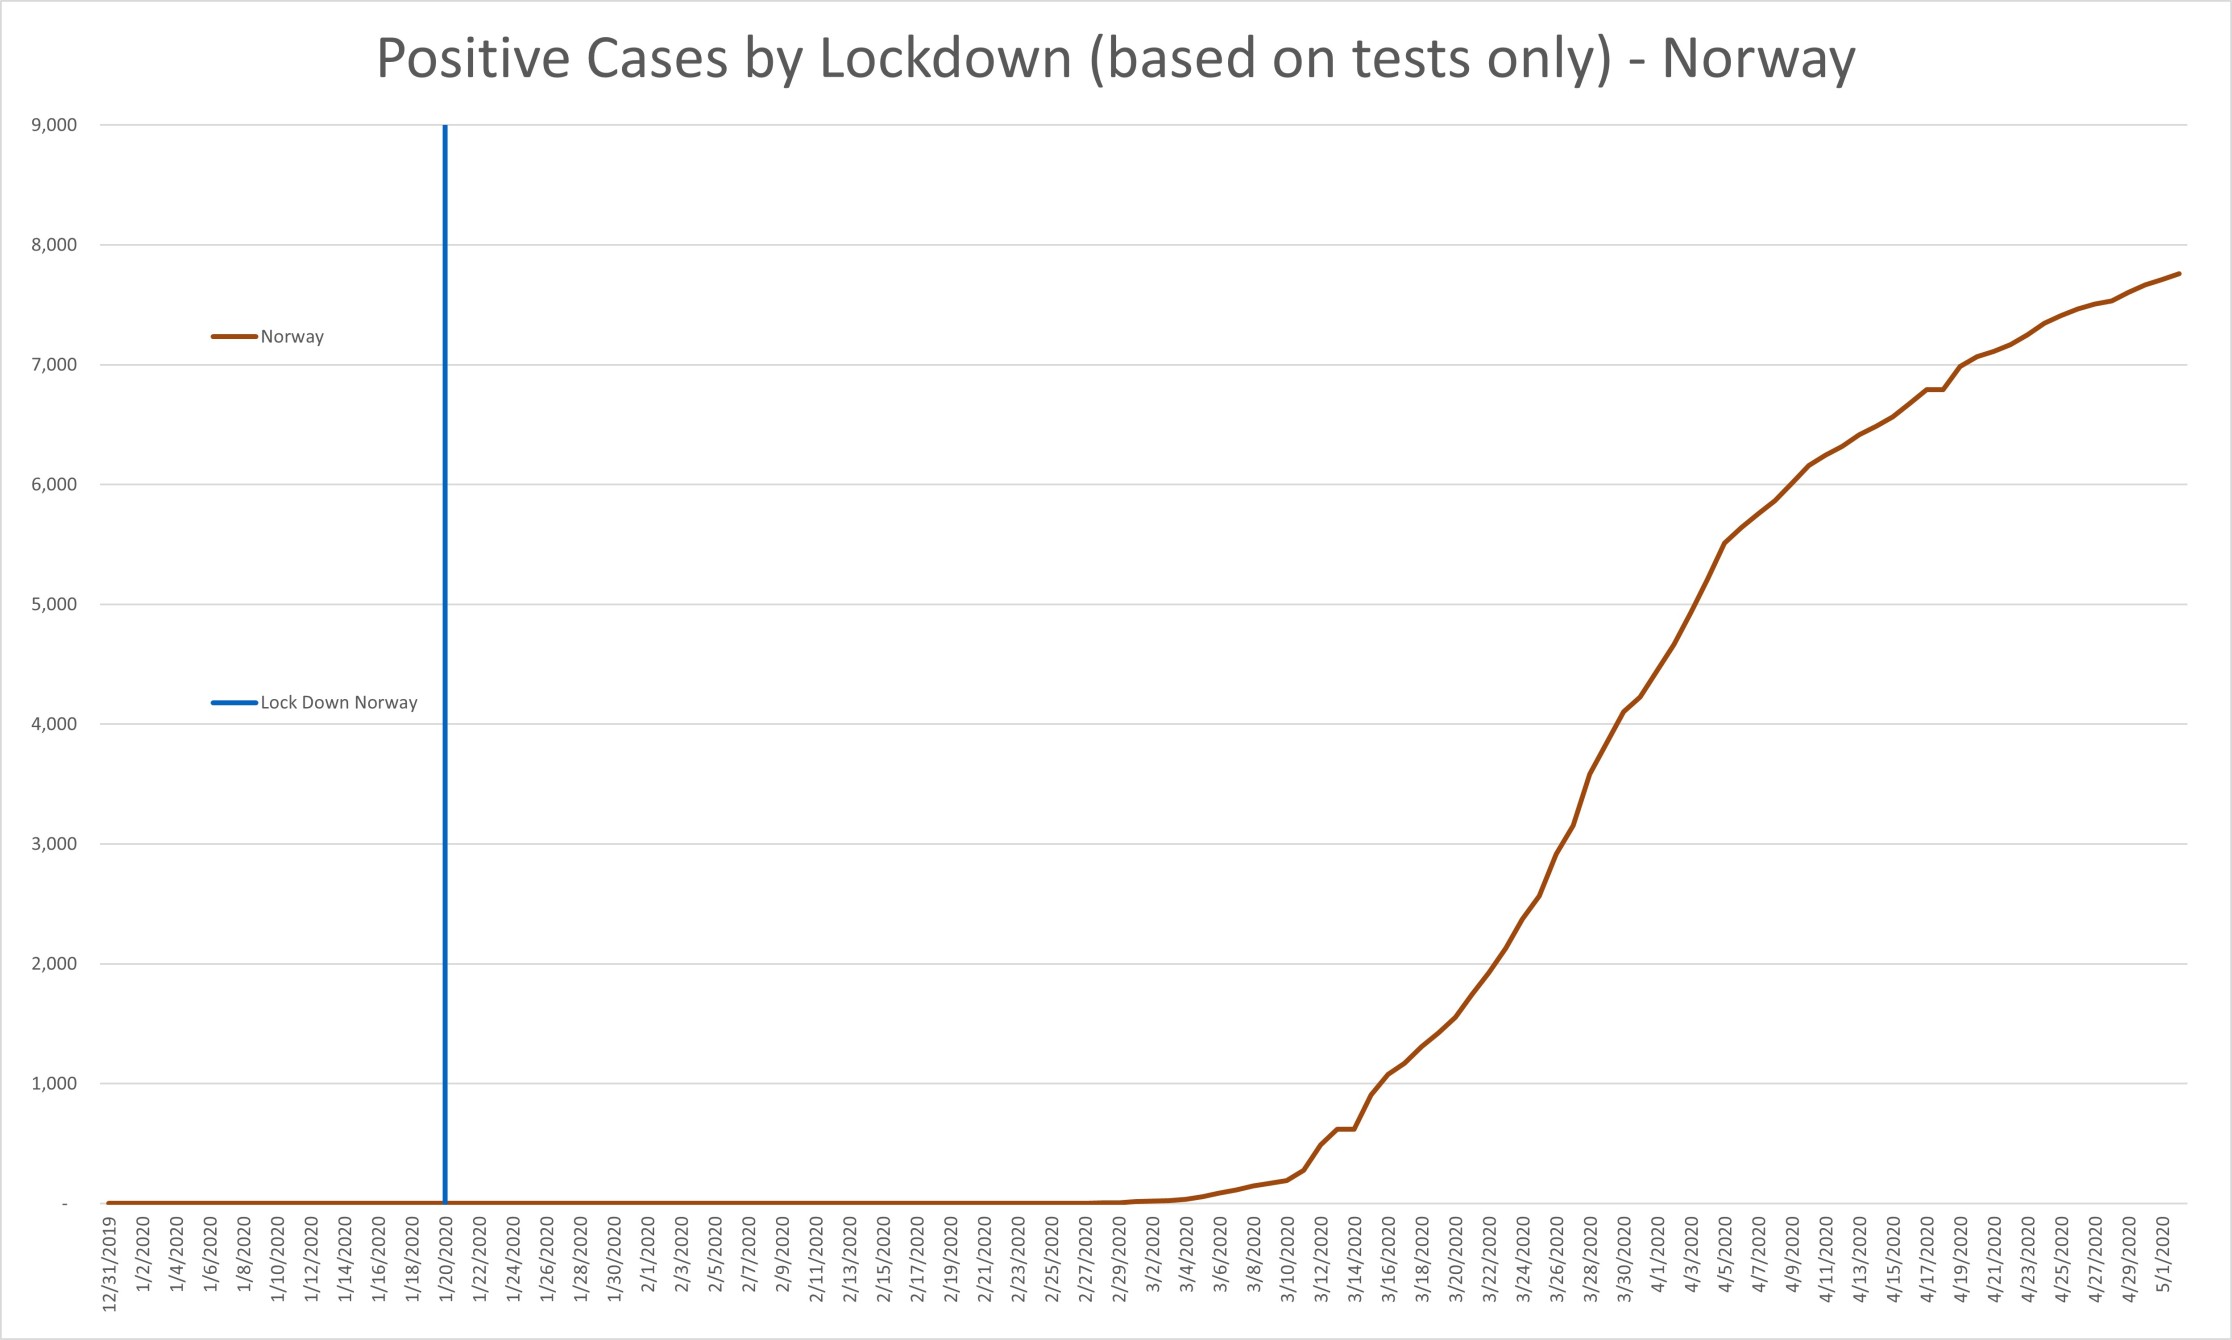
This chart shows what happened to the number of ‘Positive Cases’ before and after the lock down in each country.
As you look at the charts, ask yourself what else happened as we locked down countries?
Question: Did we increase the spread of the virus or increase the testing in every single case?
Answer: Test kits only spread misinformation without context
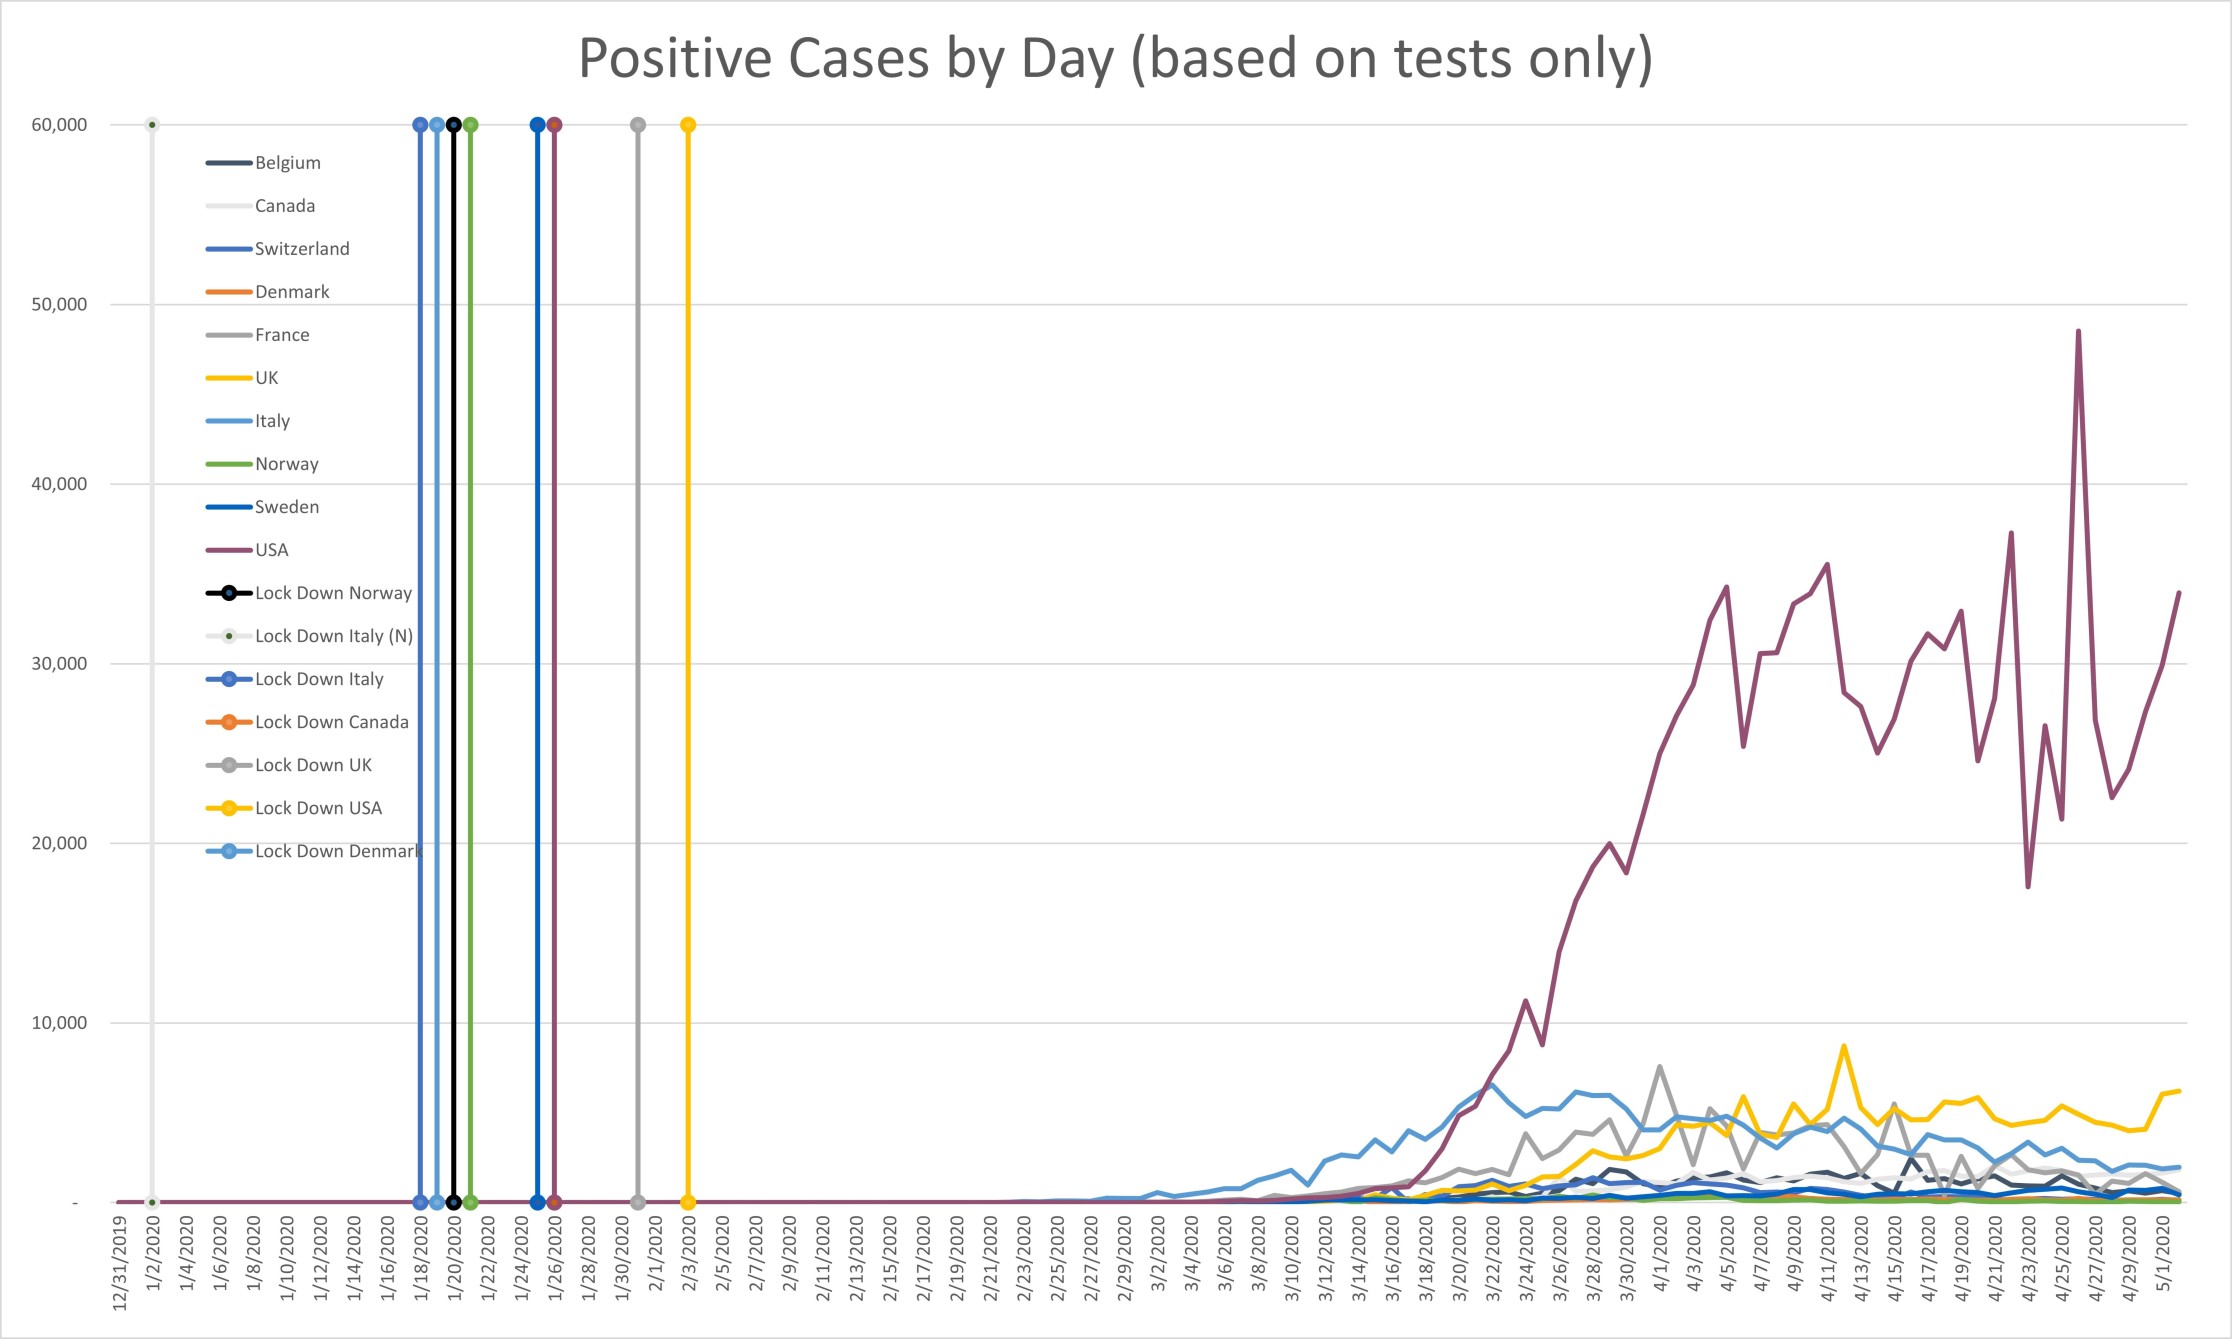
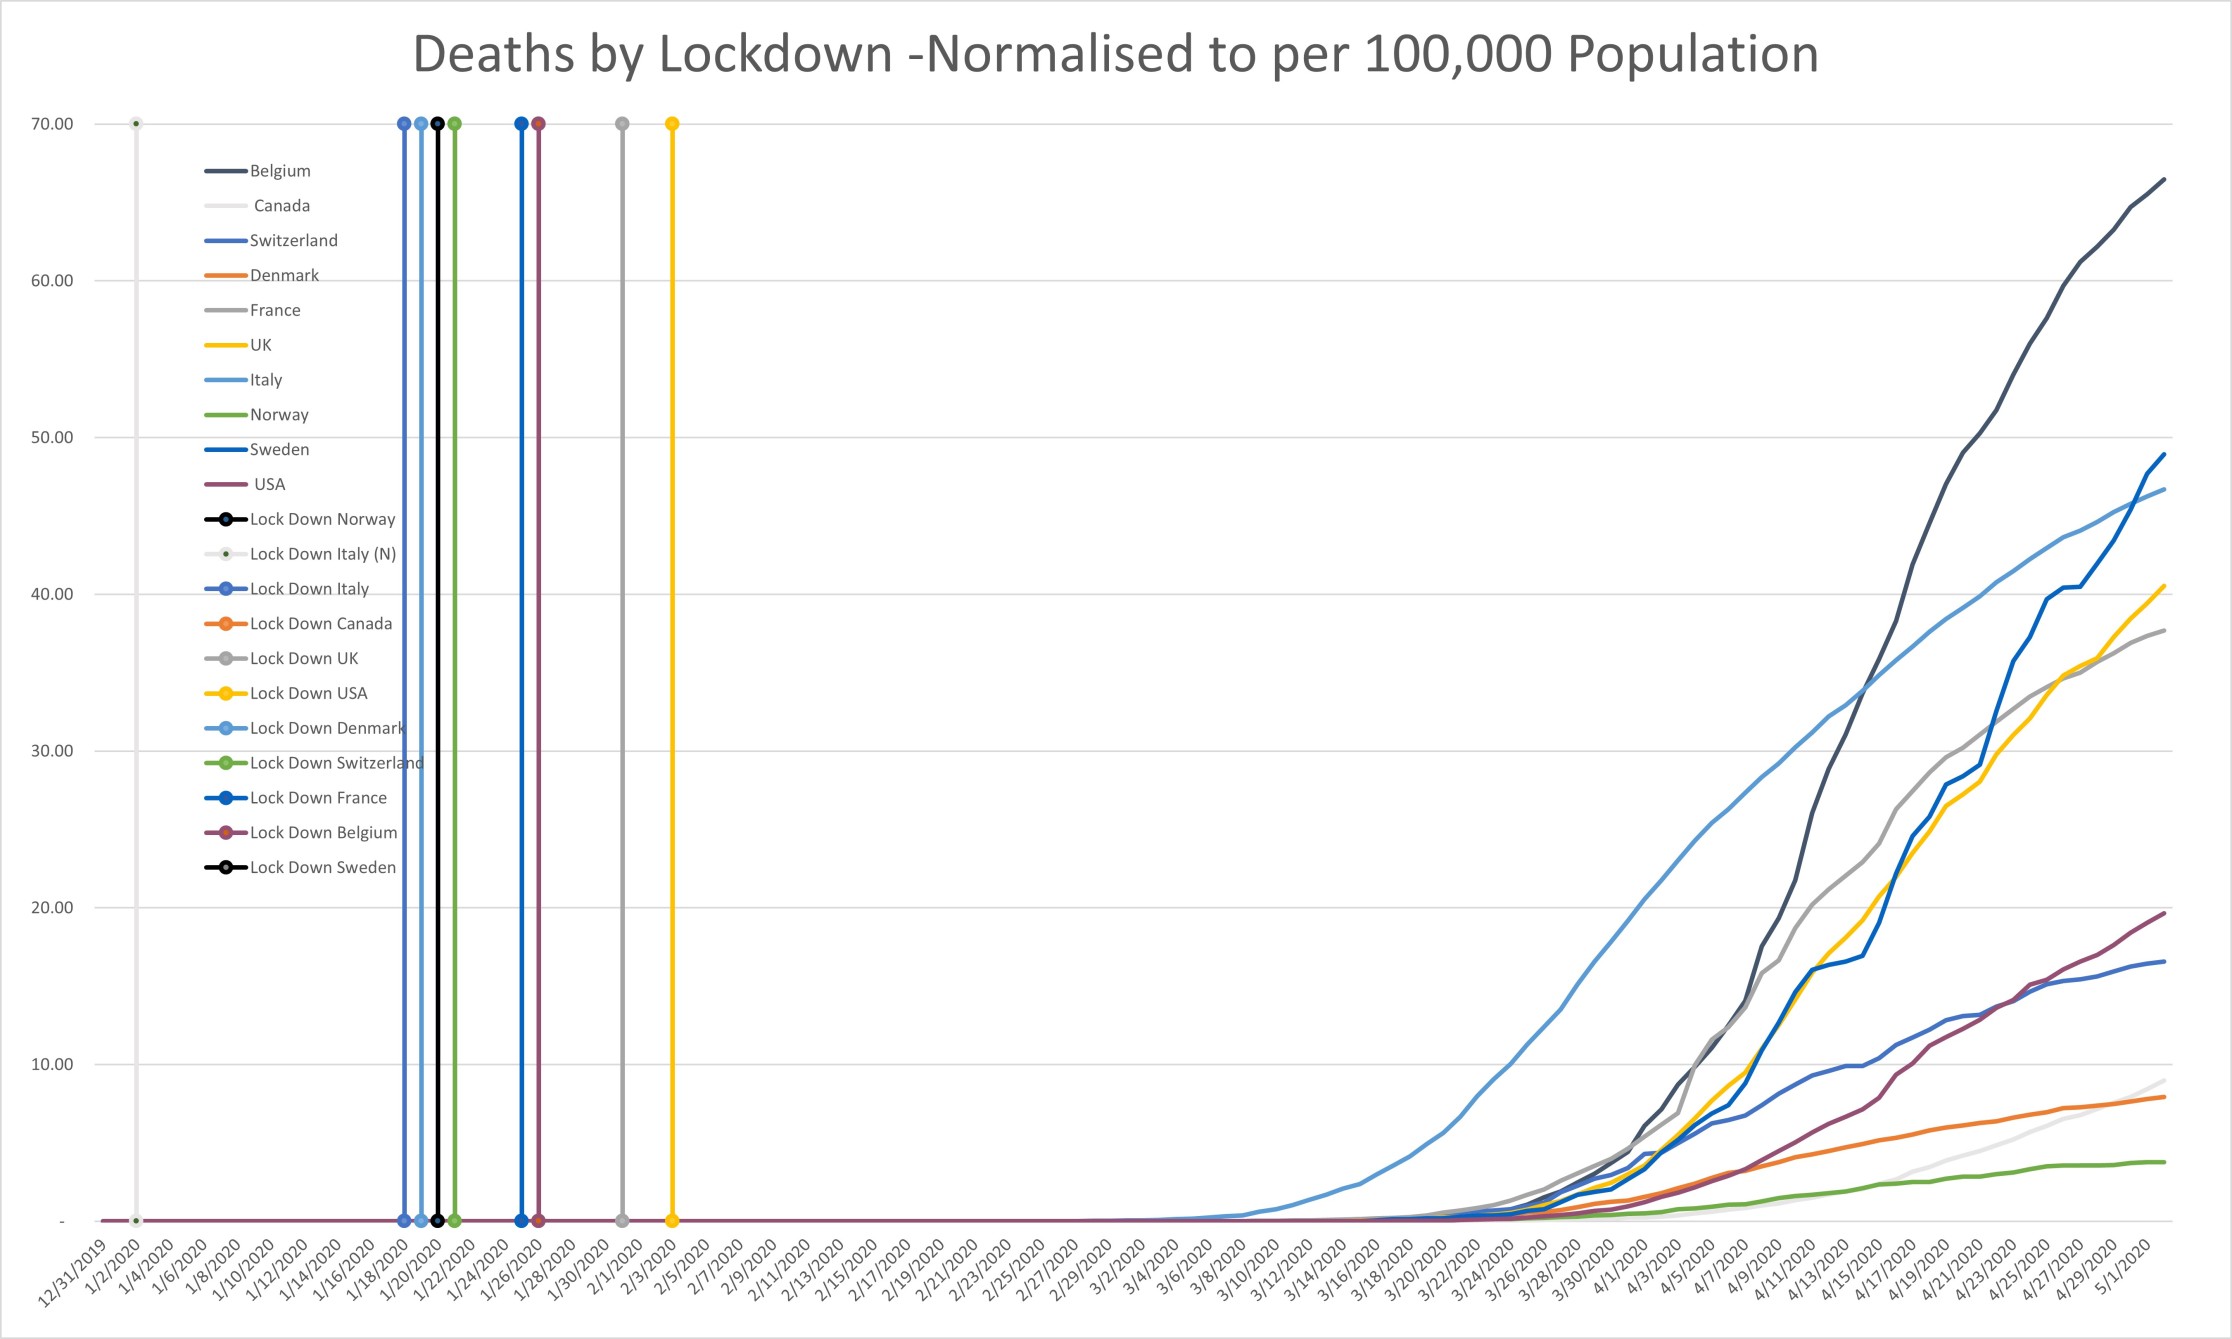
To further clarify this ‘curve’, look at each of these curves and compare them to the testing and positive cases. Is it really likely that death would continue on this same exact curve, worldwide, for all three factors, regardless of population, environment, health care and more.
Question: What is the only common factor in all these locations?
Answer: Test kits, all the way down the line.
Question: Other than testing, is there anything else that could be following the exact same curve in all instances?
Answer: All we are tracking is test kits.
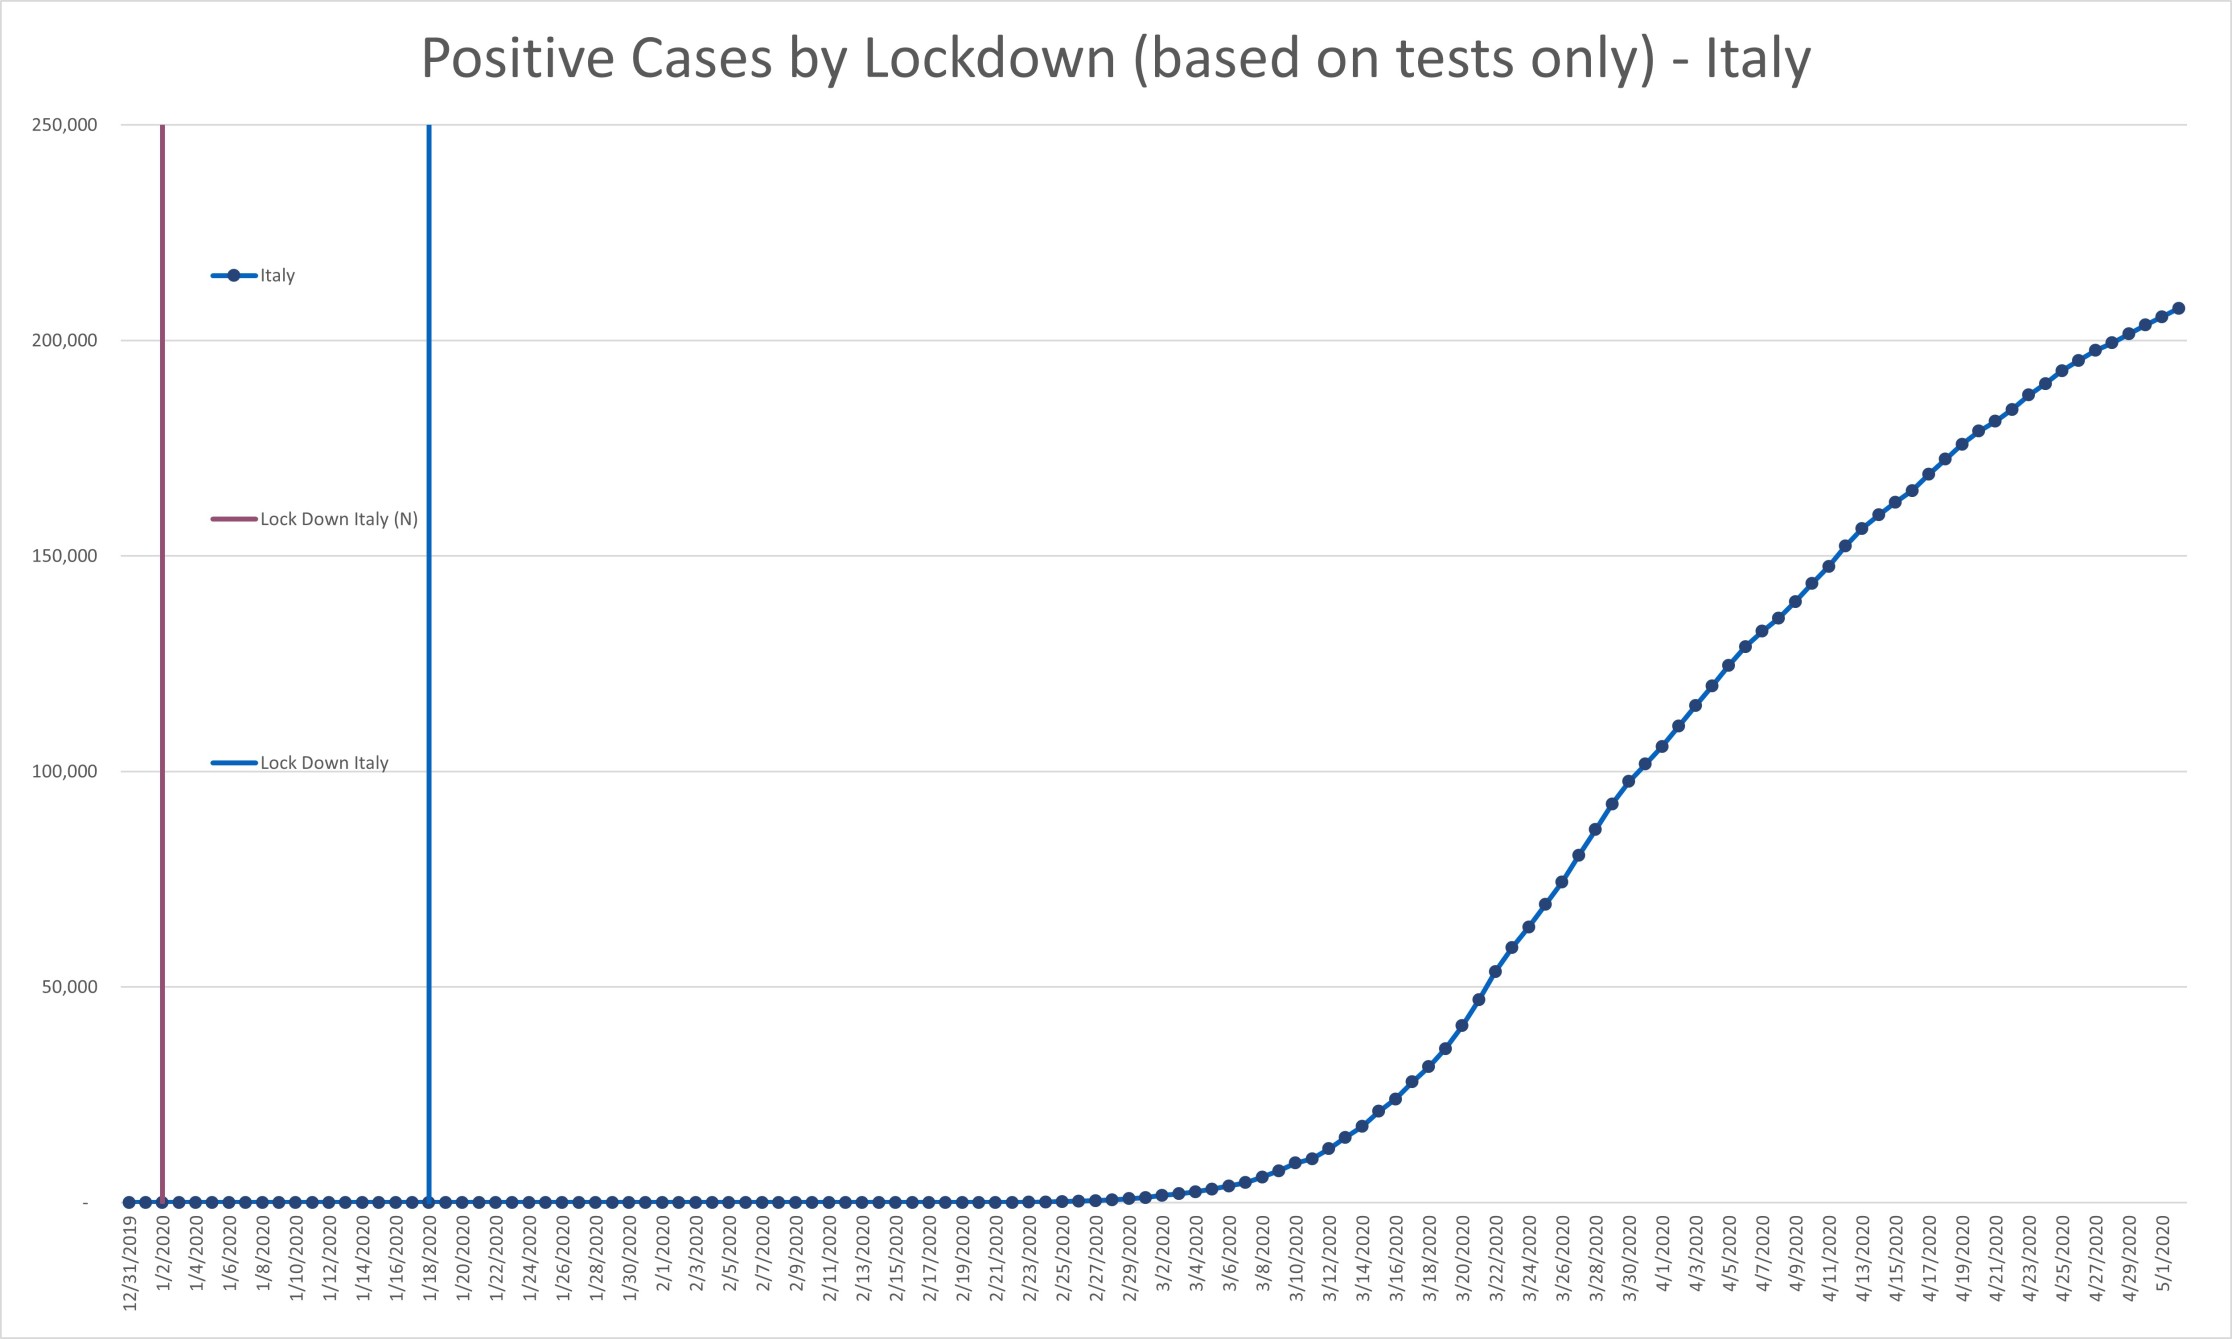
Take a look at each country’s lock down impact on the reported spread of the virus (Positive Cases). Note that Italy locked down in two phases, northern Italy and then all of Italy.
Note that the early testing took weeks to provide results to report. Hence, there is a lag from the lock down to the spike in some early adopters of testing.
All these countries saw an apparent spike immediately (based on test turn around) after the lock down that has grown exponentially since.
Question: Is the lock down helping or hurting?
That is the right question.
Question: Is it having any impact at all other than the tracking of how many tests we are performing?
Answer: Tracking test kits, without context is driving the panic.
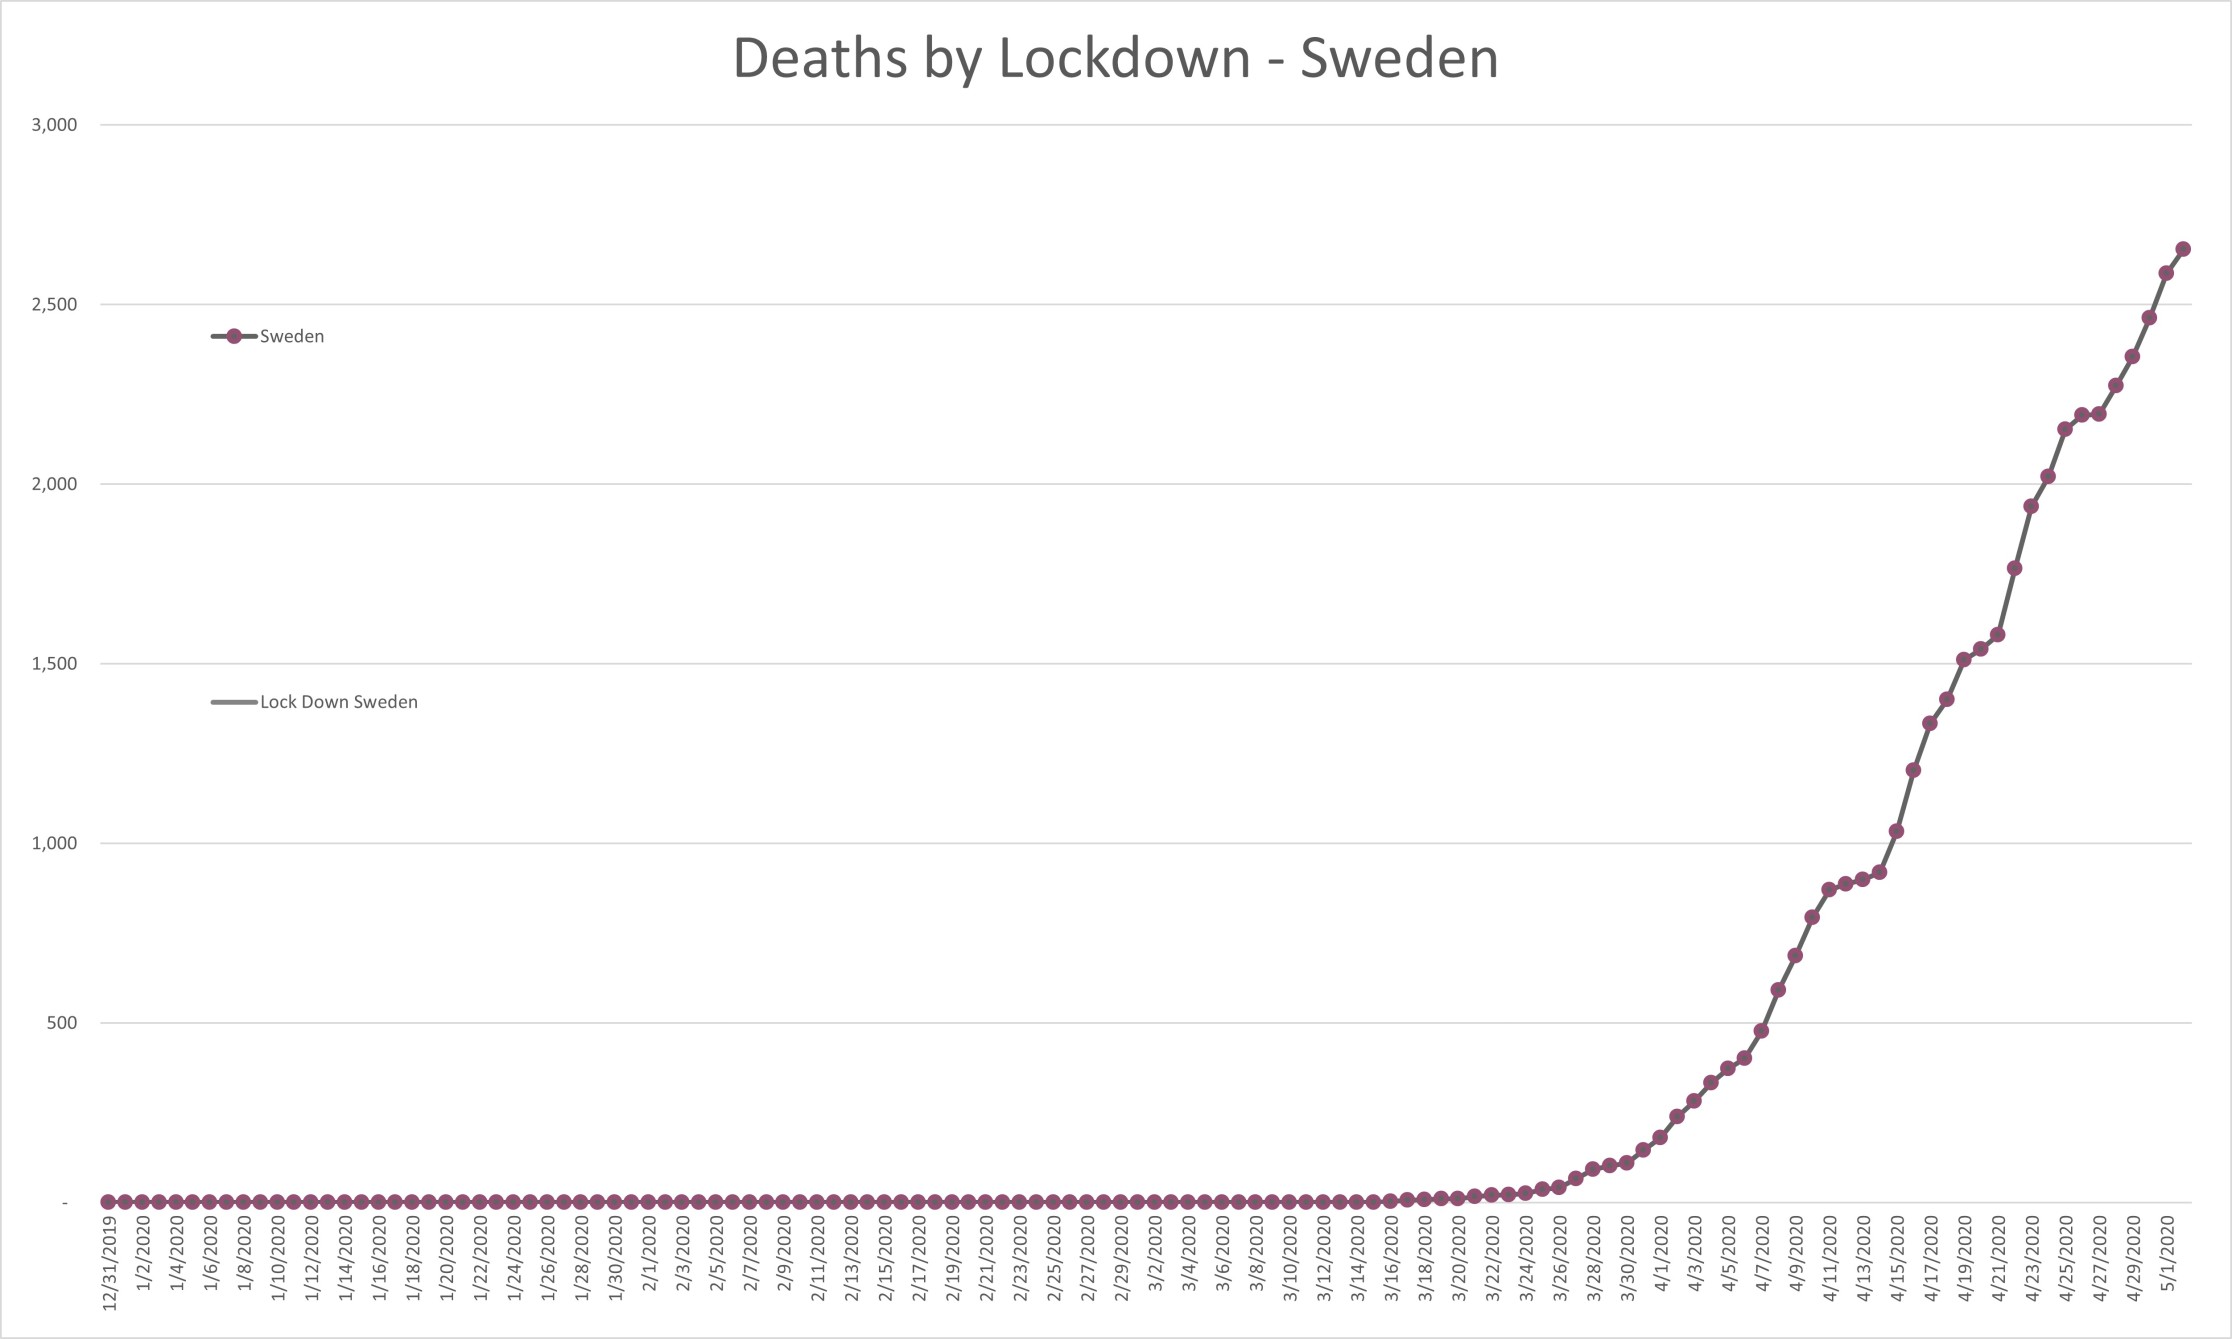
What about Sweden and its lack of a lock down? They have continued to test.
Sweden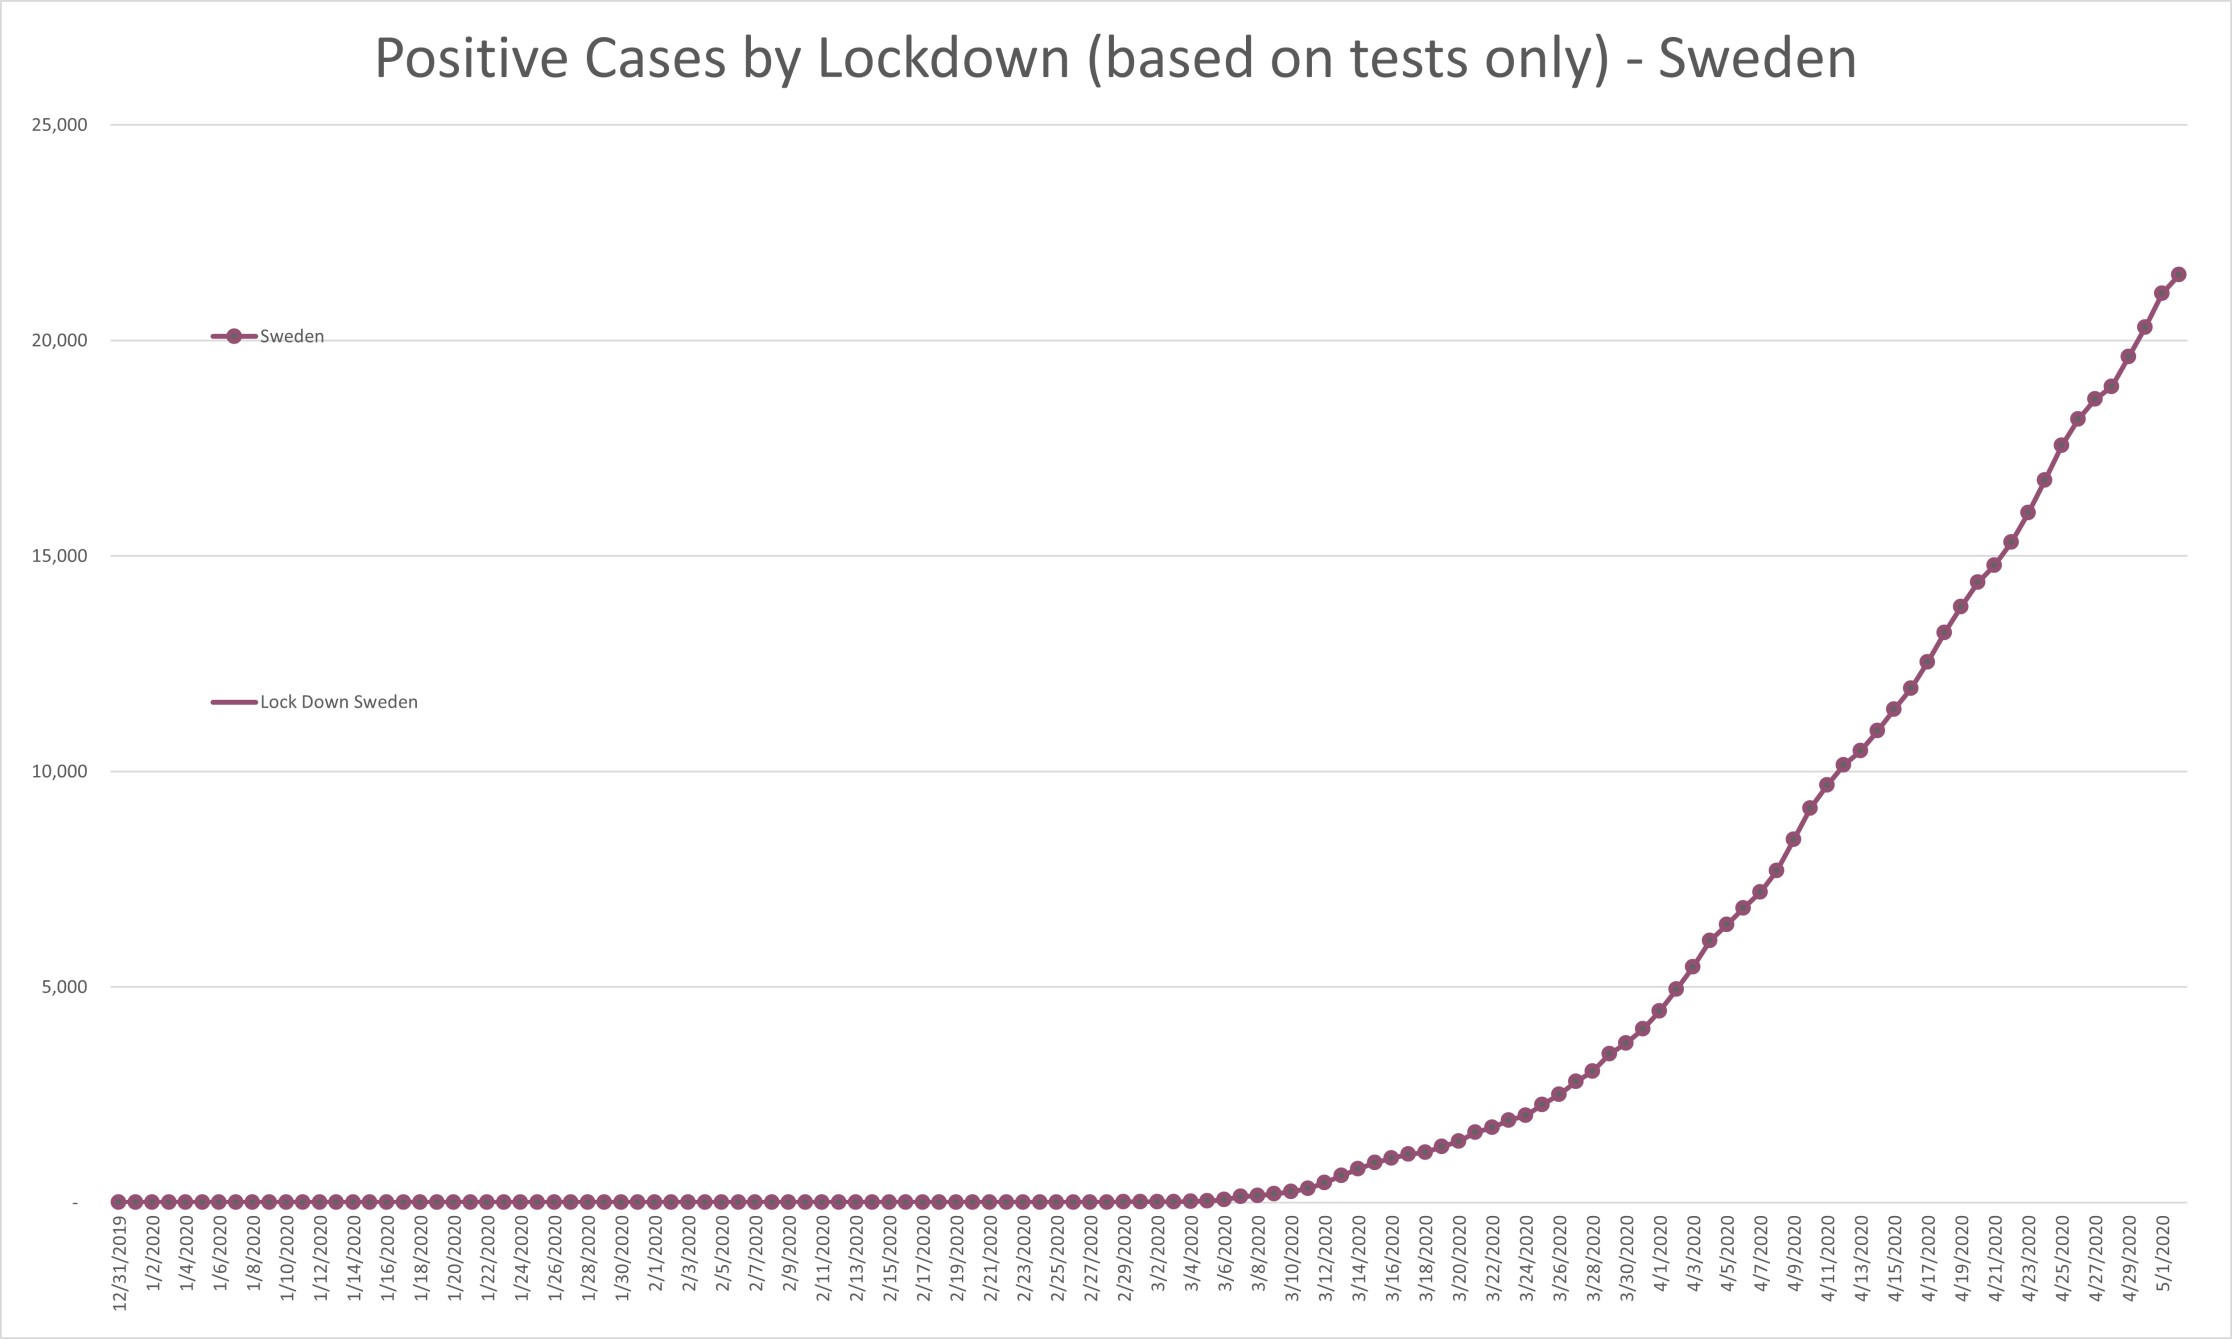
Sweden has the same upswing more related to the curve the rest of the world is seeing than any measures taken. In fact, this curve is almost identical in every country no matter what the measures implemented.
Question: What is this curve really reporting worldwide?
Answer: If all we track is test kits, what else can it report?
Yet this is the standard upon which almost every civil liberty is being systematically removed from society today.
Businesses are going under by the minute. Half of small to medium businesses across the world are not expected to survive. For most countries, we are mere weeks into this…
What if it goes on for months?
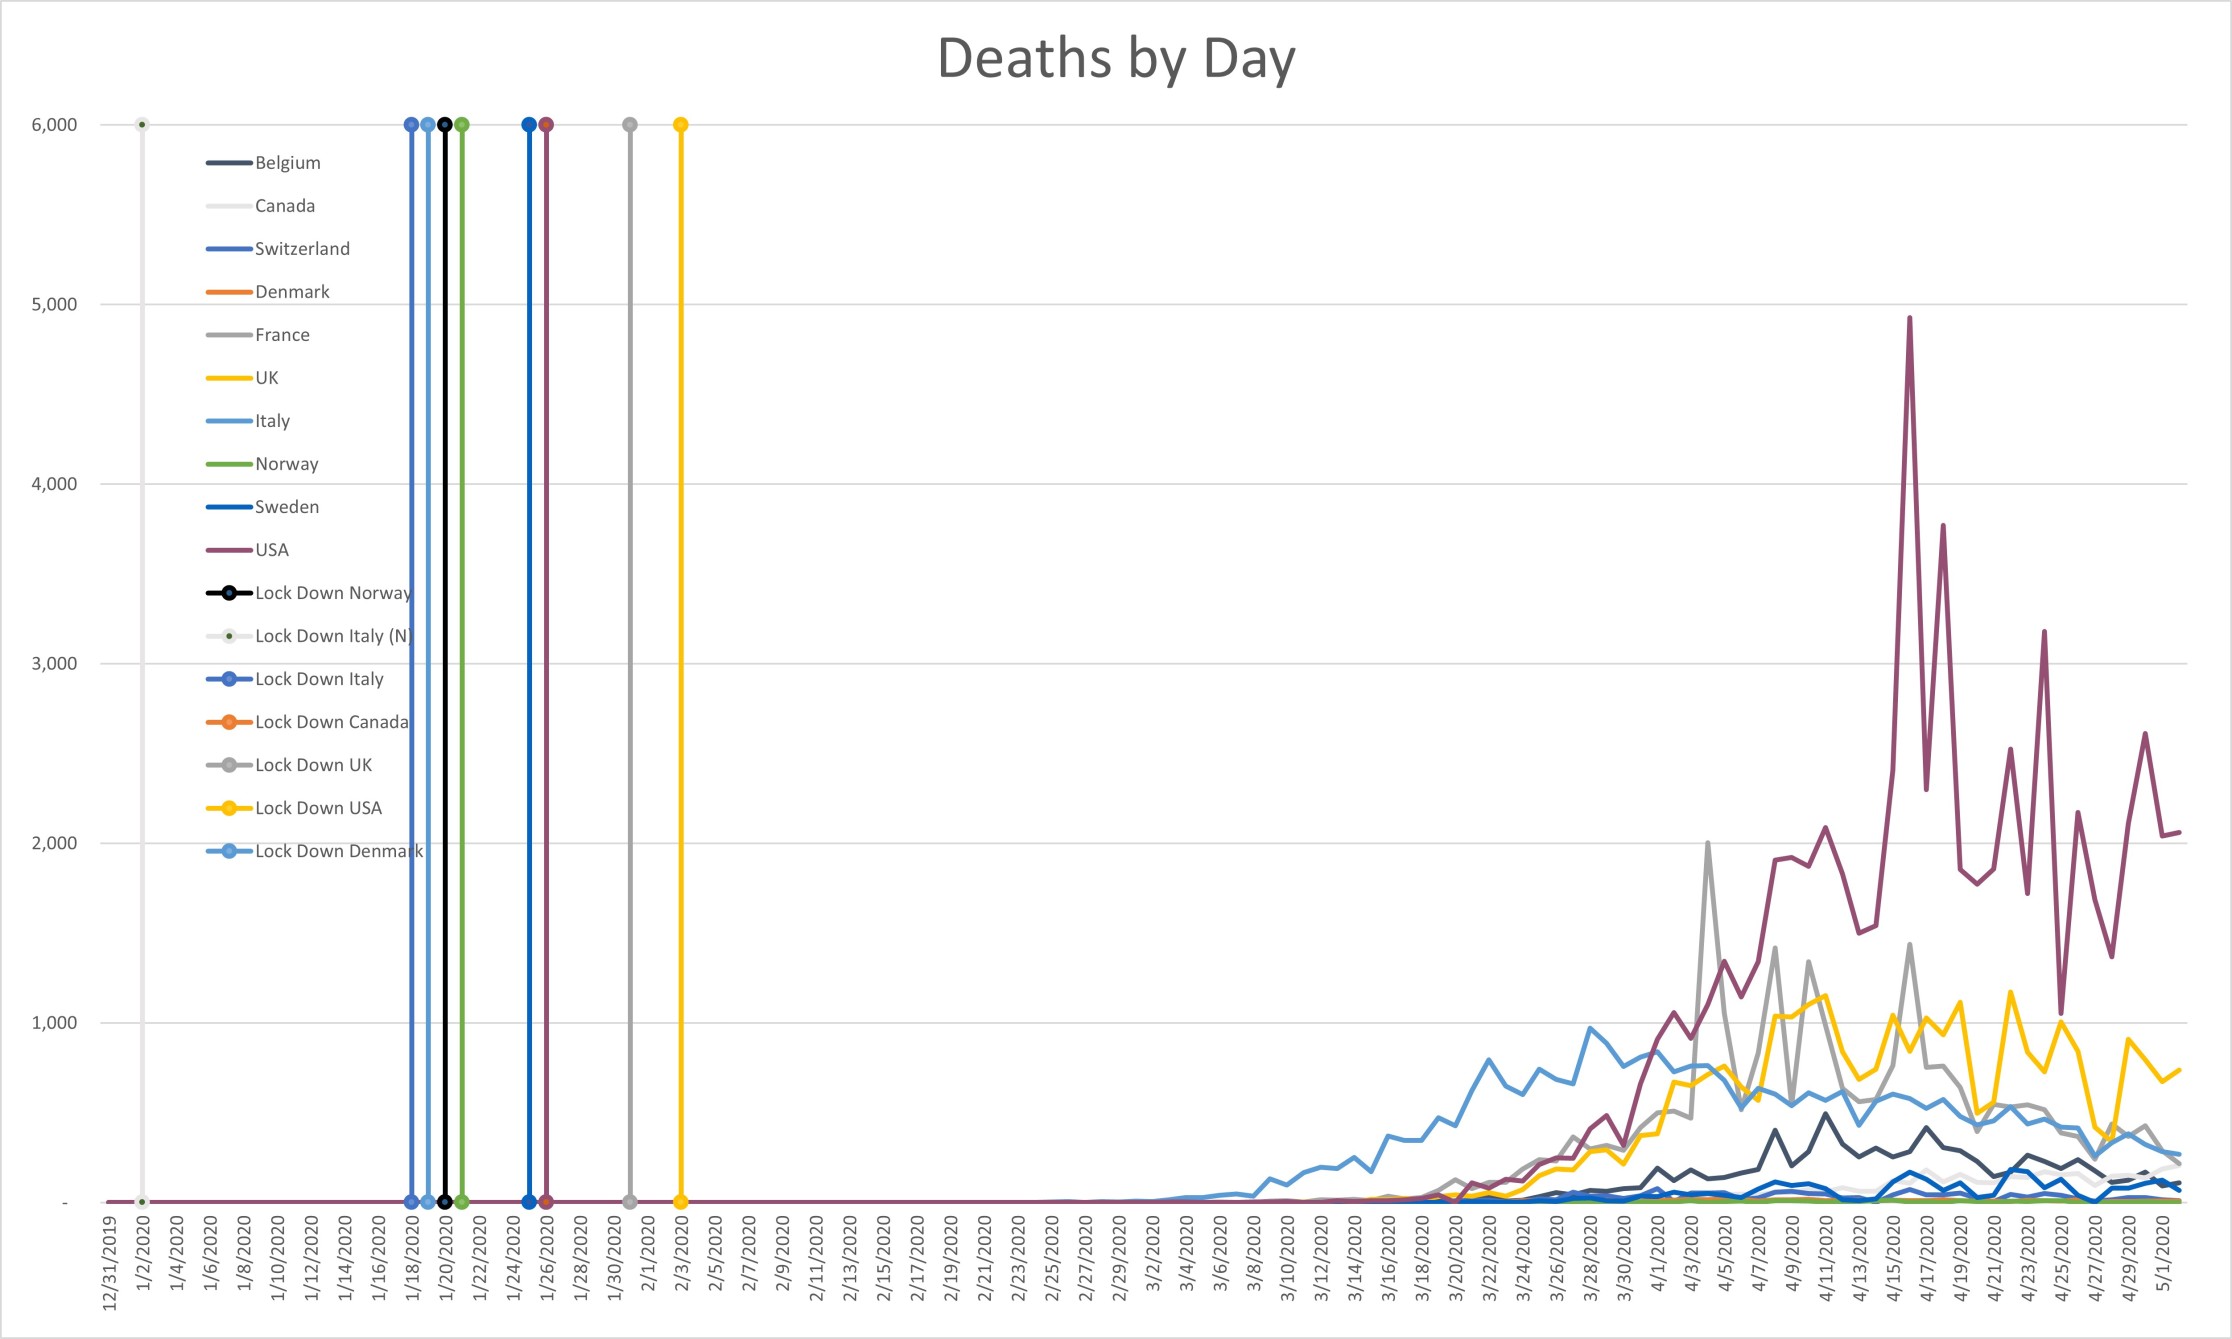
COVID 19 deaths. The question of WITH vs OF.
Some are claiming we are slowing down the death rates. The reported deaths and reported cases show a very different position. But is it real?
Despite so many differing factors that would impact mortality due to a virus, we see almost identical curves in the numbers of deaths in every location in line with testing and positive tests.
Question: How can this be?
Answer: All we are tracking is test kits.
Authorities worldwide have confirmed that a death of a person who has tested positive for COVID 19 is, in most cases, being recorded as a death in the COVID 19 death reports.
The more people we test who die, or who die with a positive test, the more COVID 19 deaths are reported.
Does this align with daily deaths under normal circumstances? Can we correlate any other rate of death on a daily basis so closely with the rate of testing for COVID 19?
This is unusual and could explain this now very familiar curve. We are testing people who are admitted to hospital along with those who die with anything like a potential COVID 19 symptom.
Considering that the number of positive tests is climbing at the same rate as testing, maybe we now know the real picture behind the numbers.
Is this really an indication of how fast the virus has or will spread?
Is it really an indicator of how many will die because they caught COVID 19?
Answer: If all we are tracking is test kits, the indicator has no context.
Based on the most likely widespread incidence of the virus since 2019, before we started testing, how many people died before that ‘first’ case in each country? How many people would have died of other causes if COVID 19 had never existed?
Overall deaths in the world did not spike sharply at the end of 2019. They do not continue to spike daily as COVID 19 appears to be reported.
Are we really tracking a virus mortality, or are we just chasing test kits?
Answer: All we are tracking is test kits.
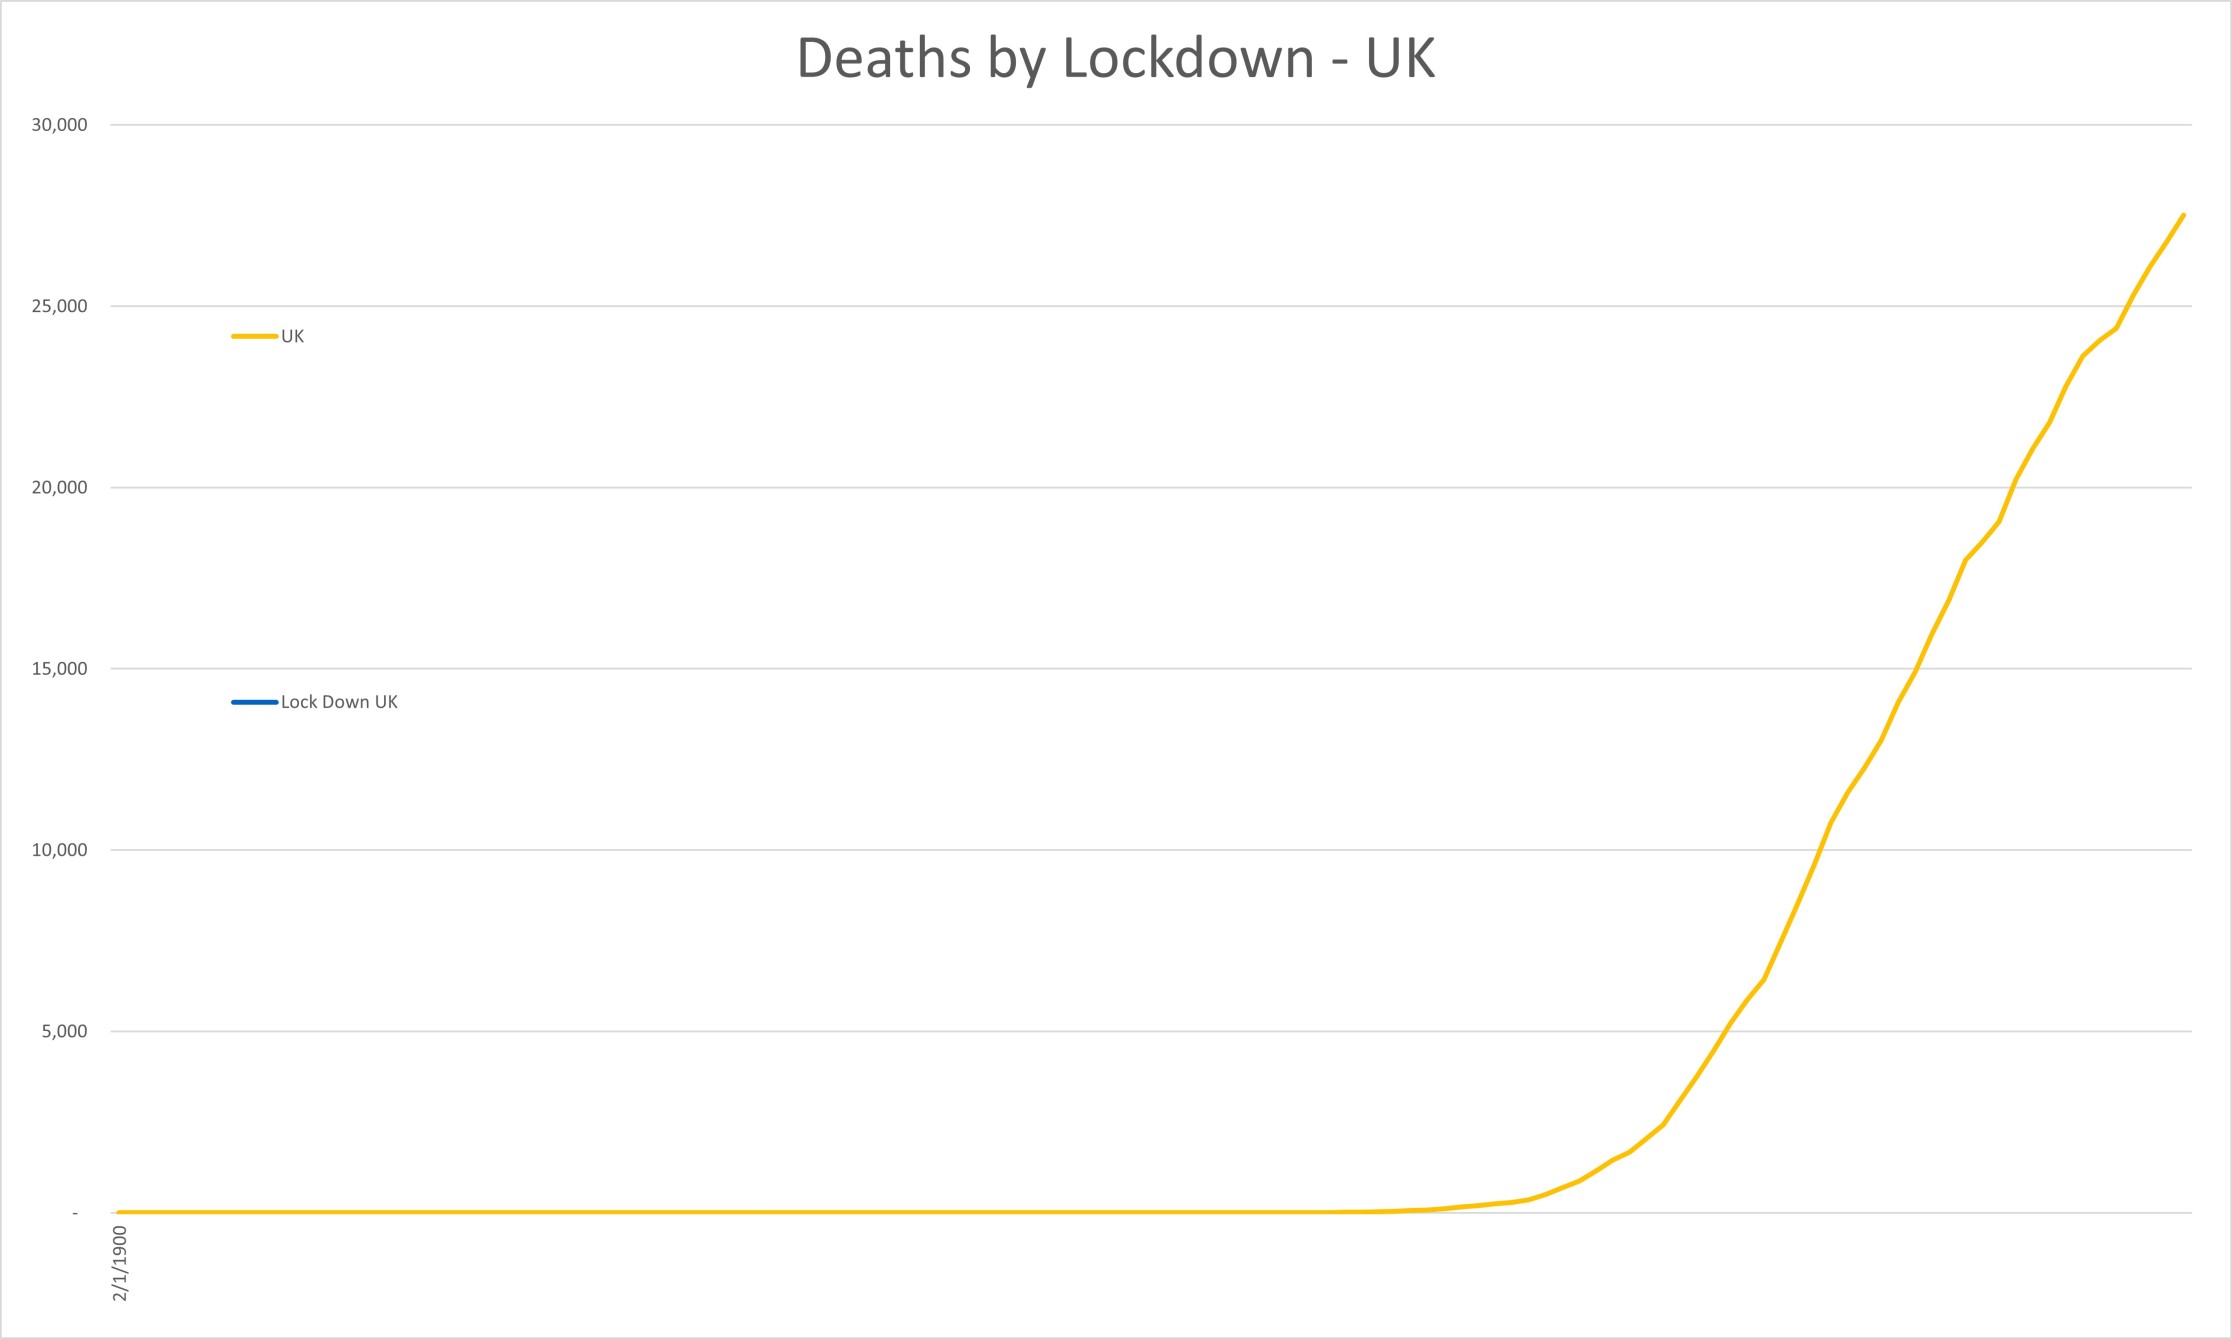
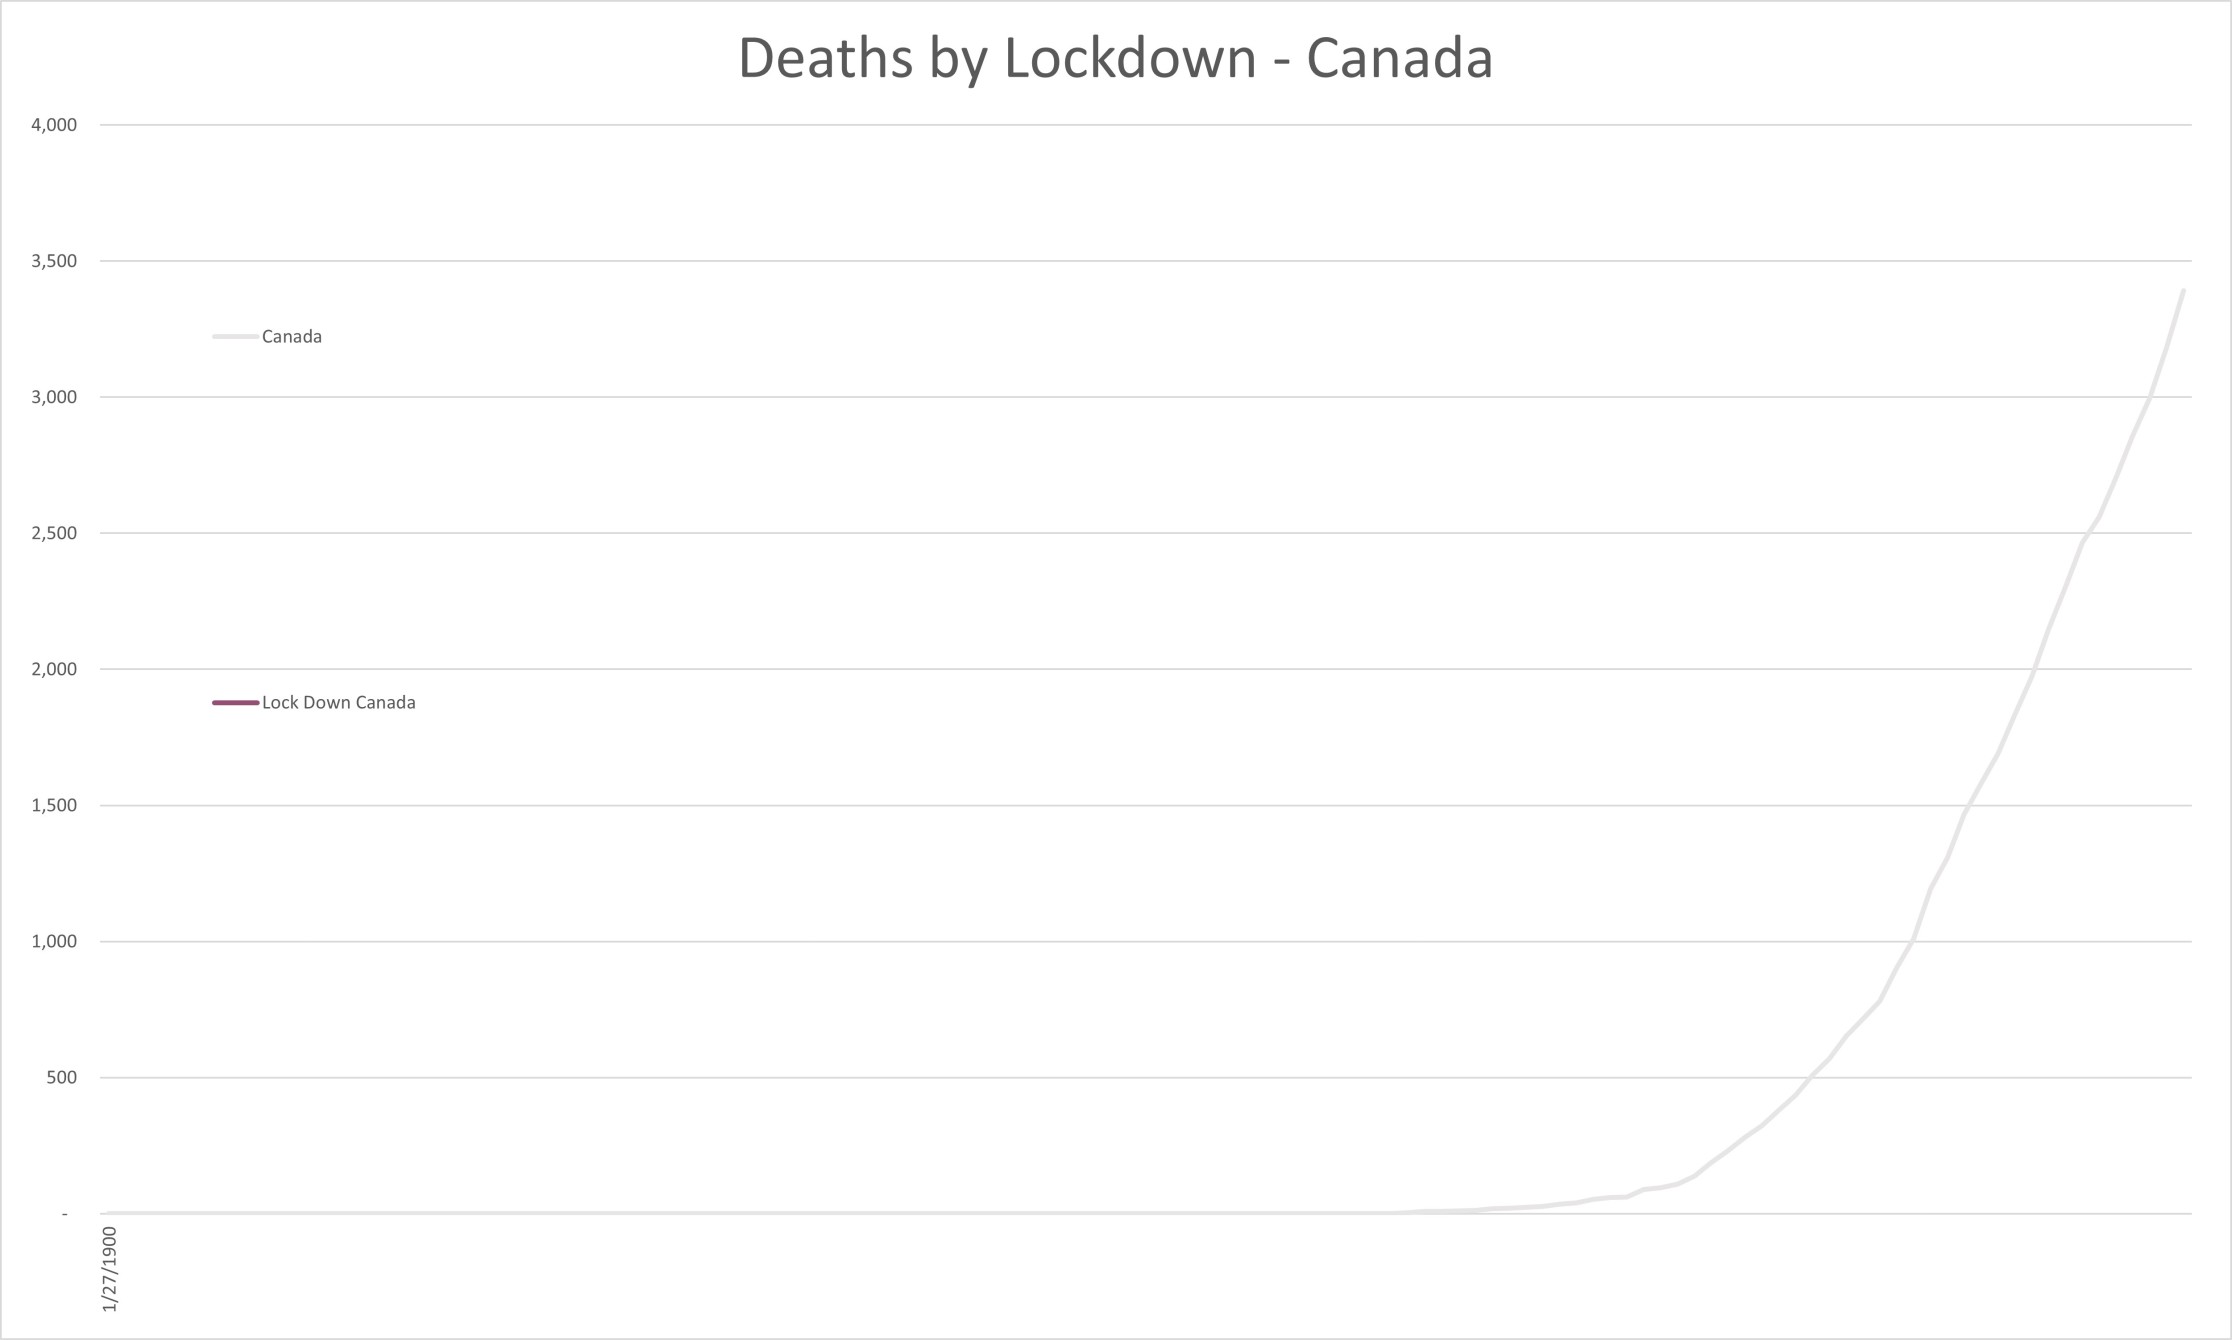
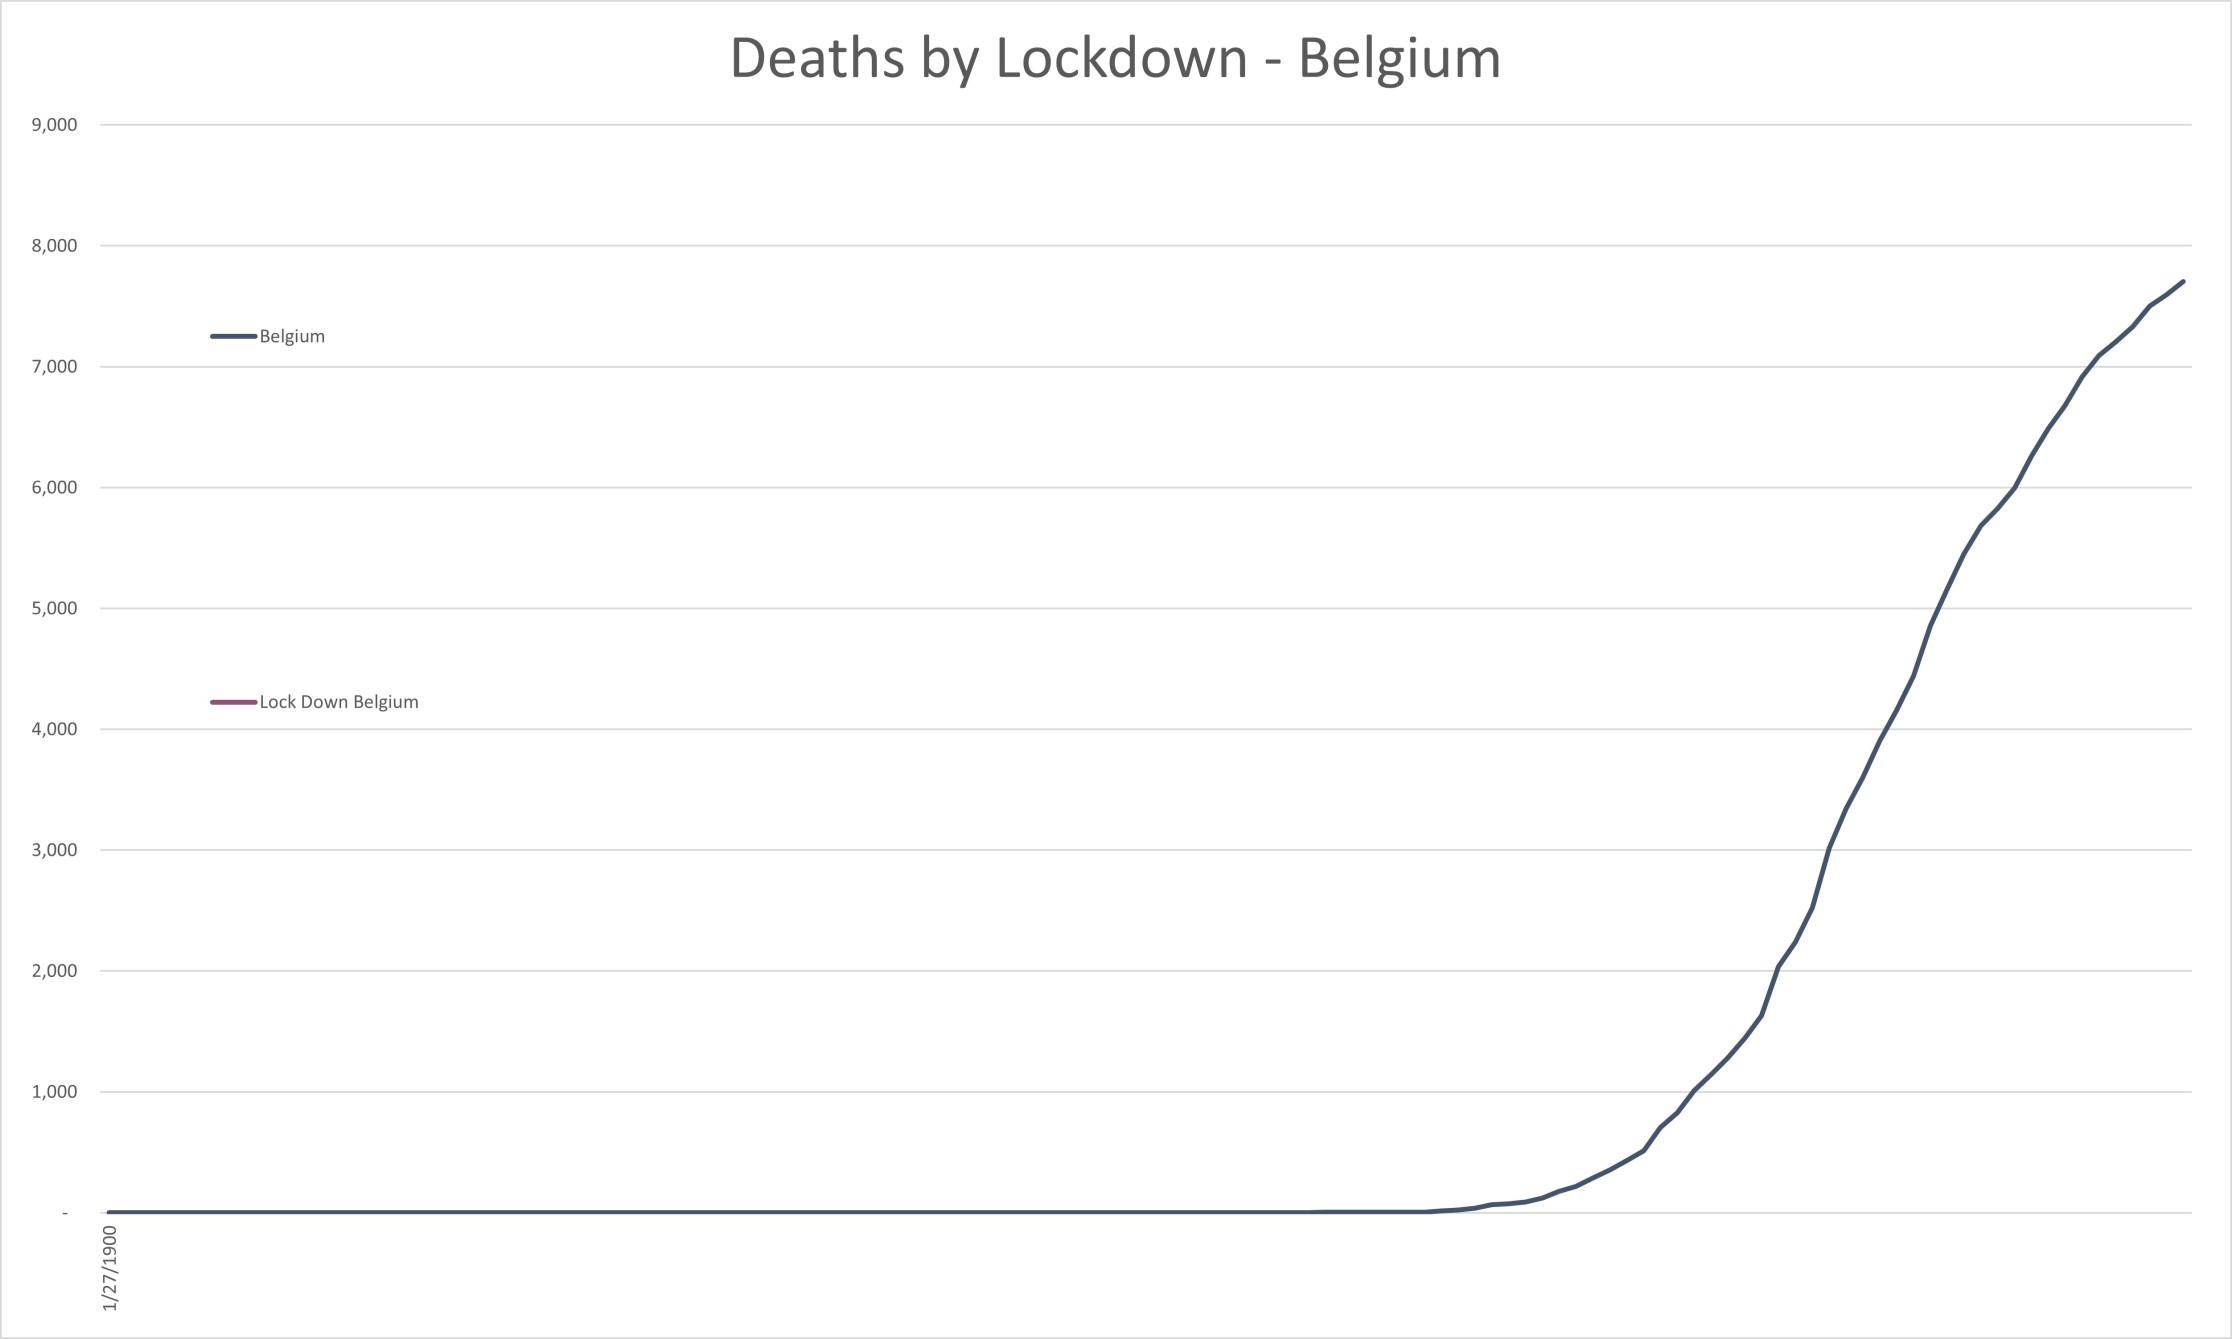
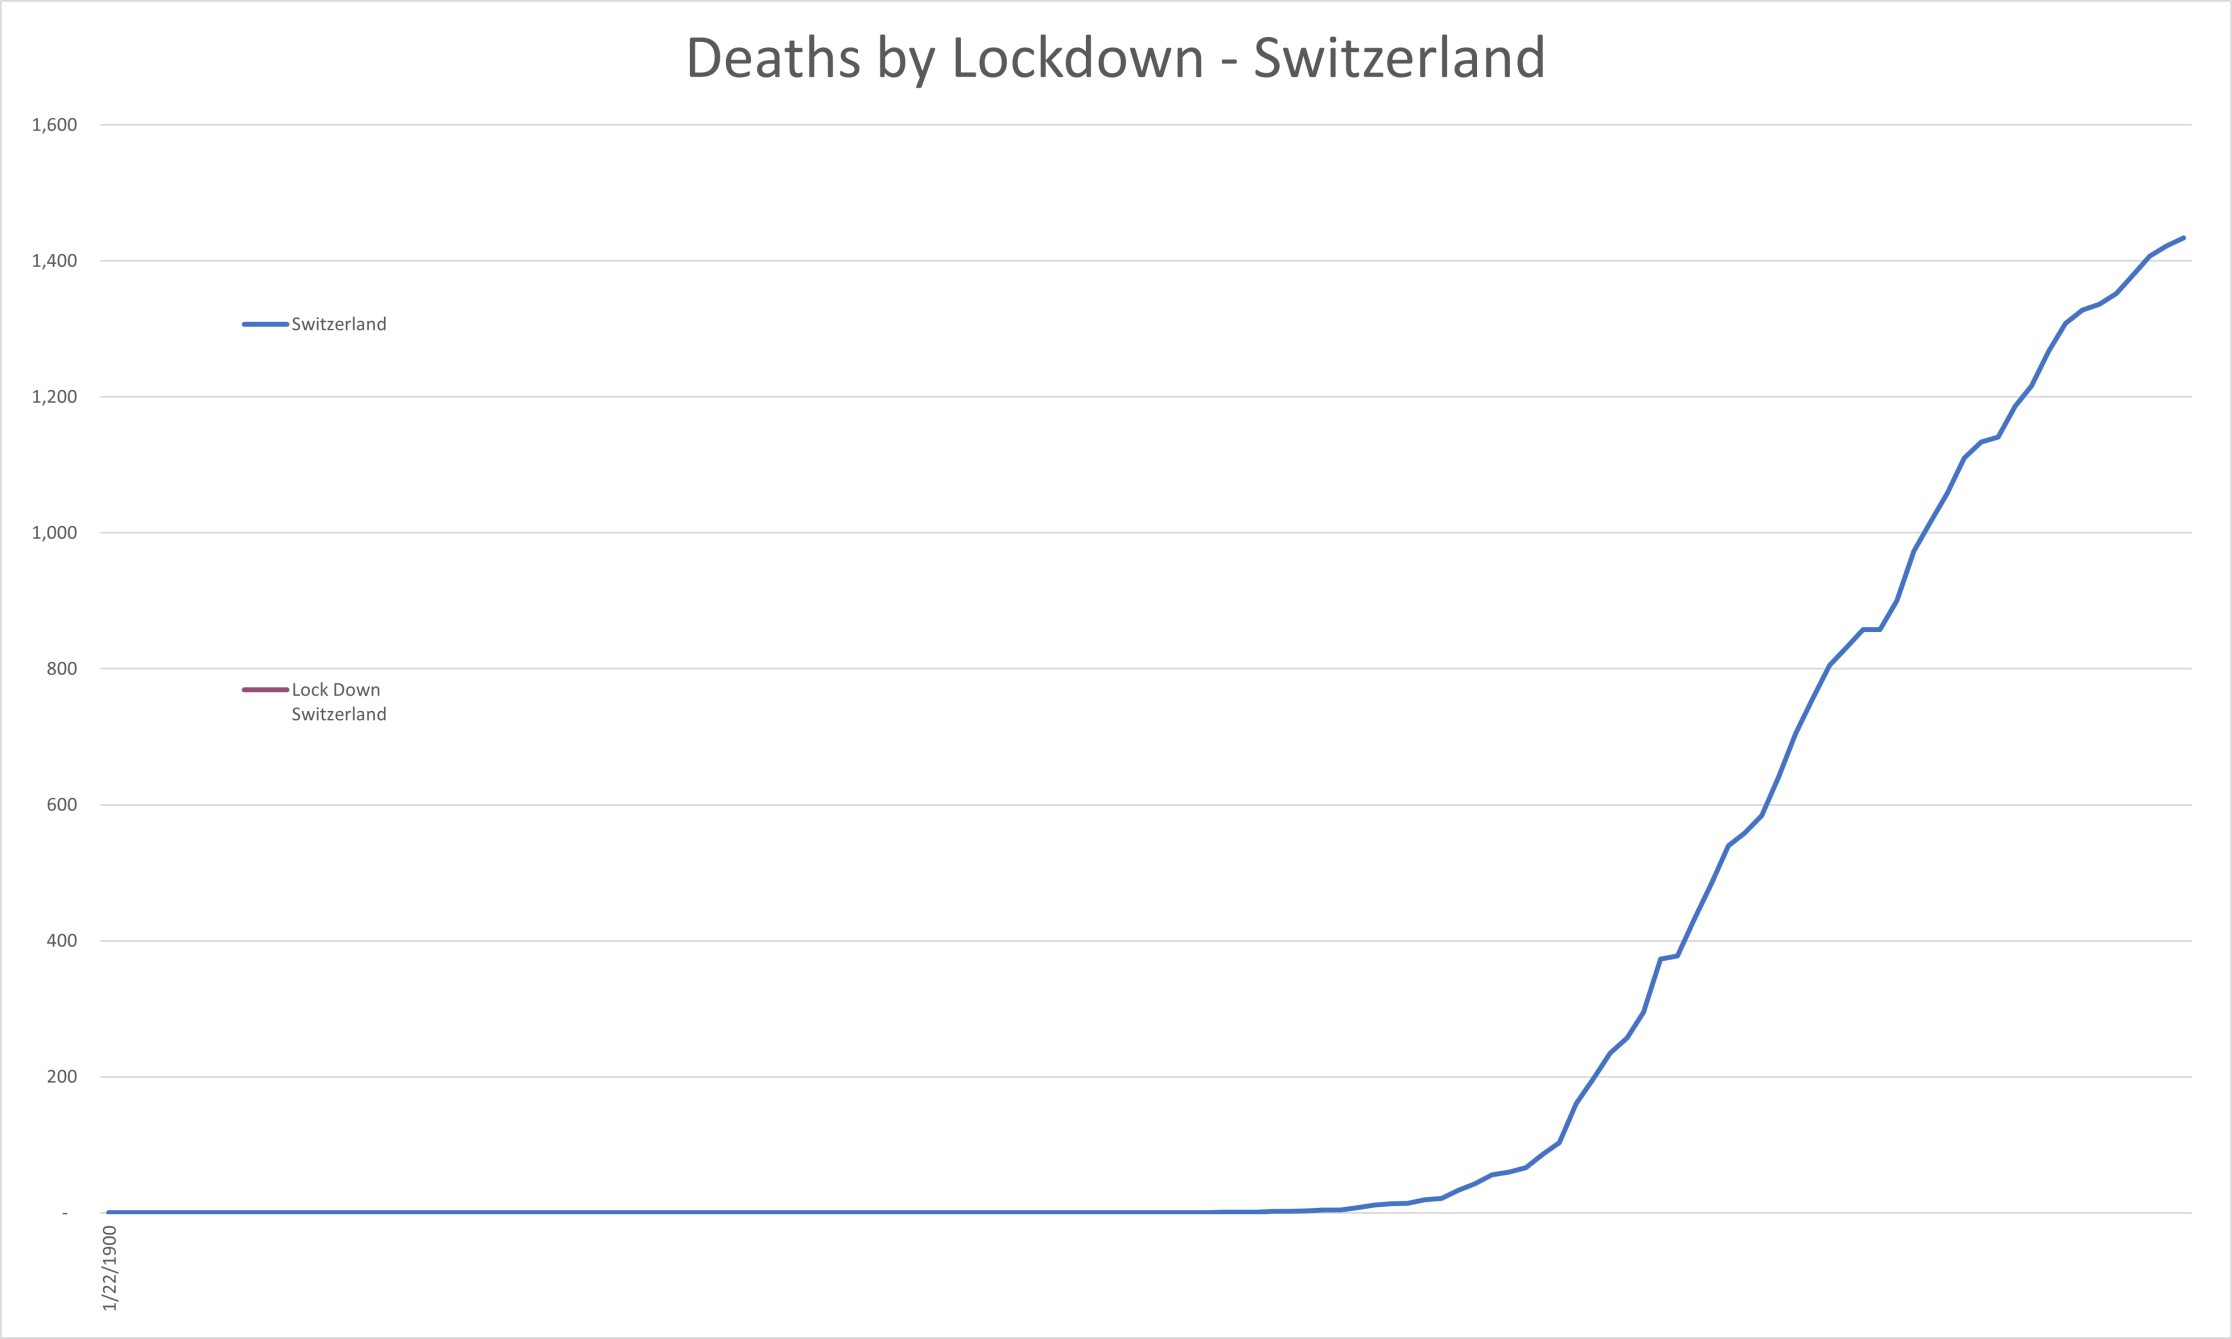
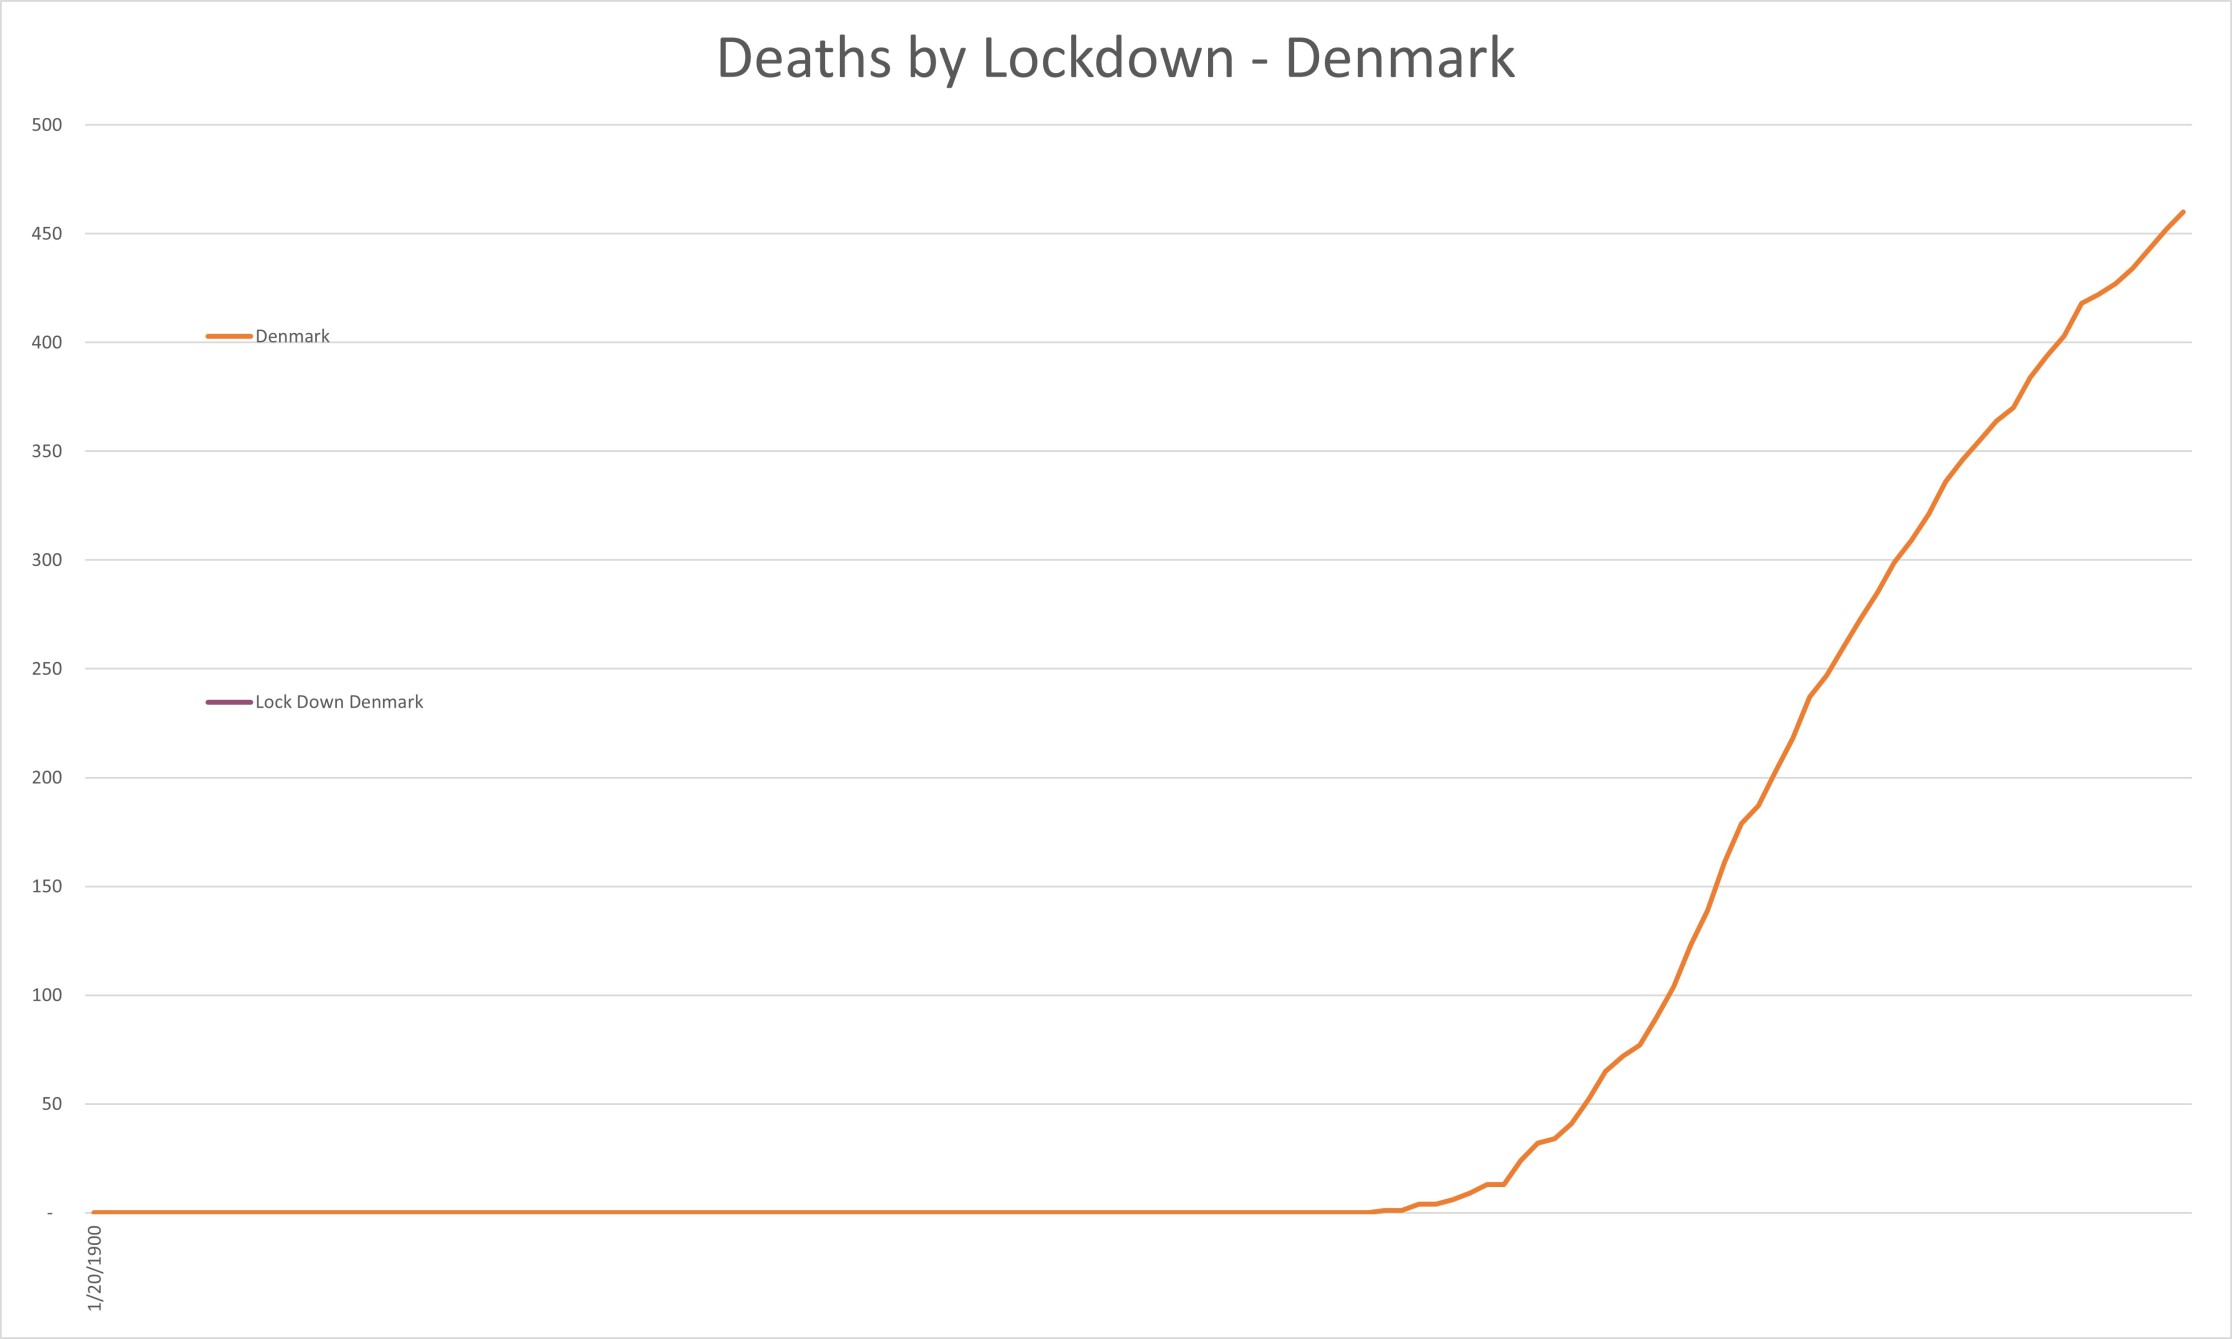
What about cases reported as COVID 19 deaths then? This chart shows what happened to the number of COVID 19 reported deaths before and after the lock down in each country. Note that Sweden did not lock down.
Is this curve starting to feel familiar? Looks like a case of test kits!!
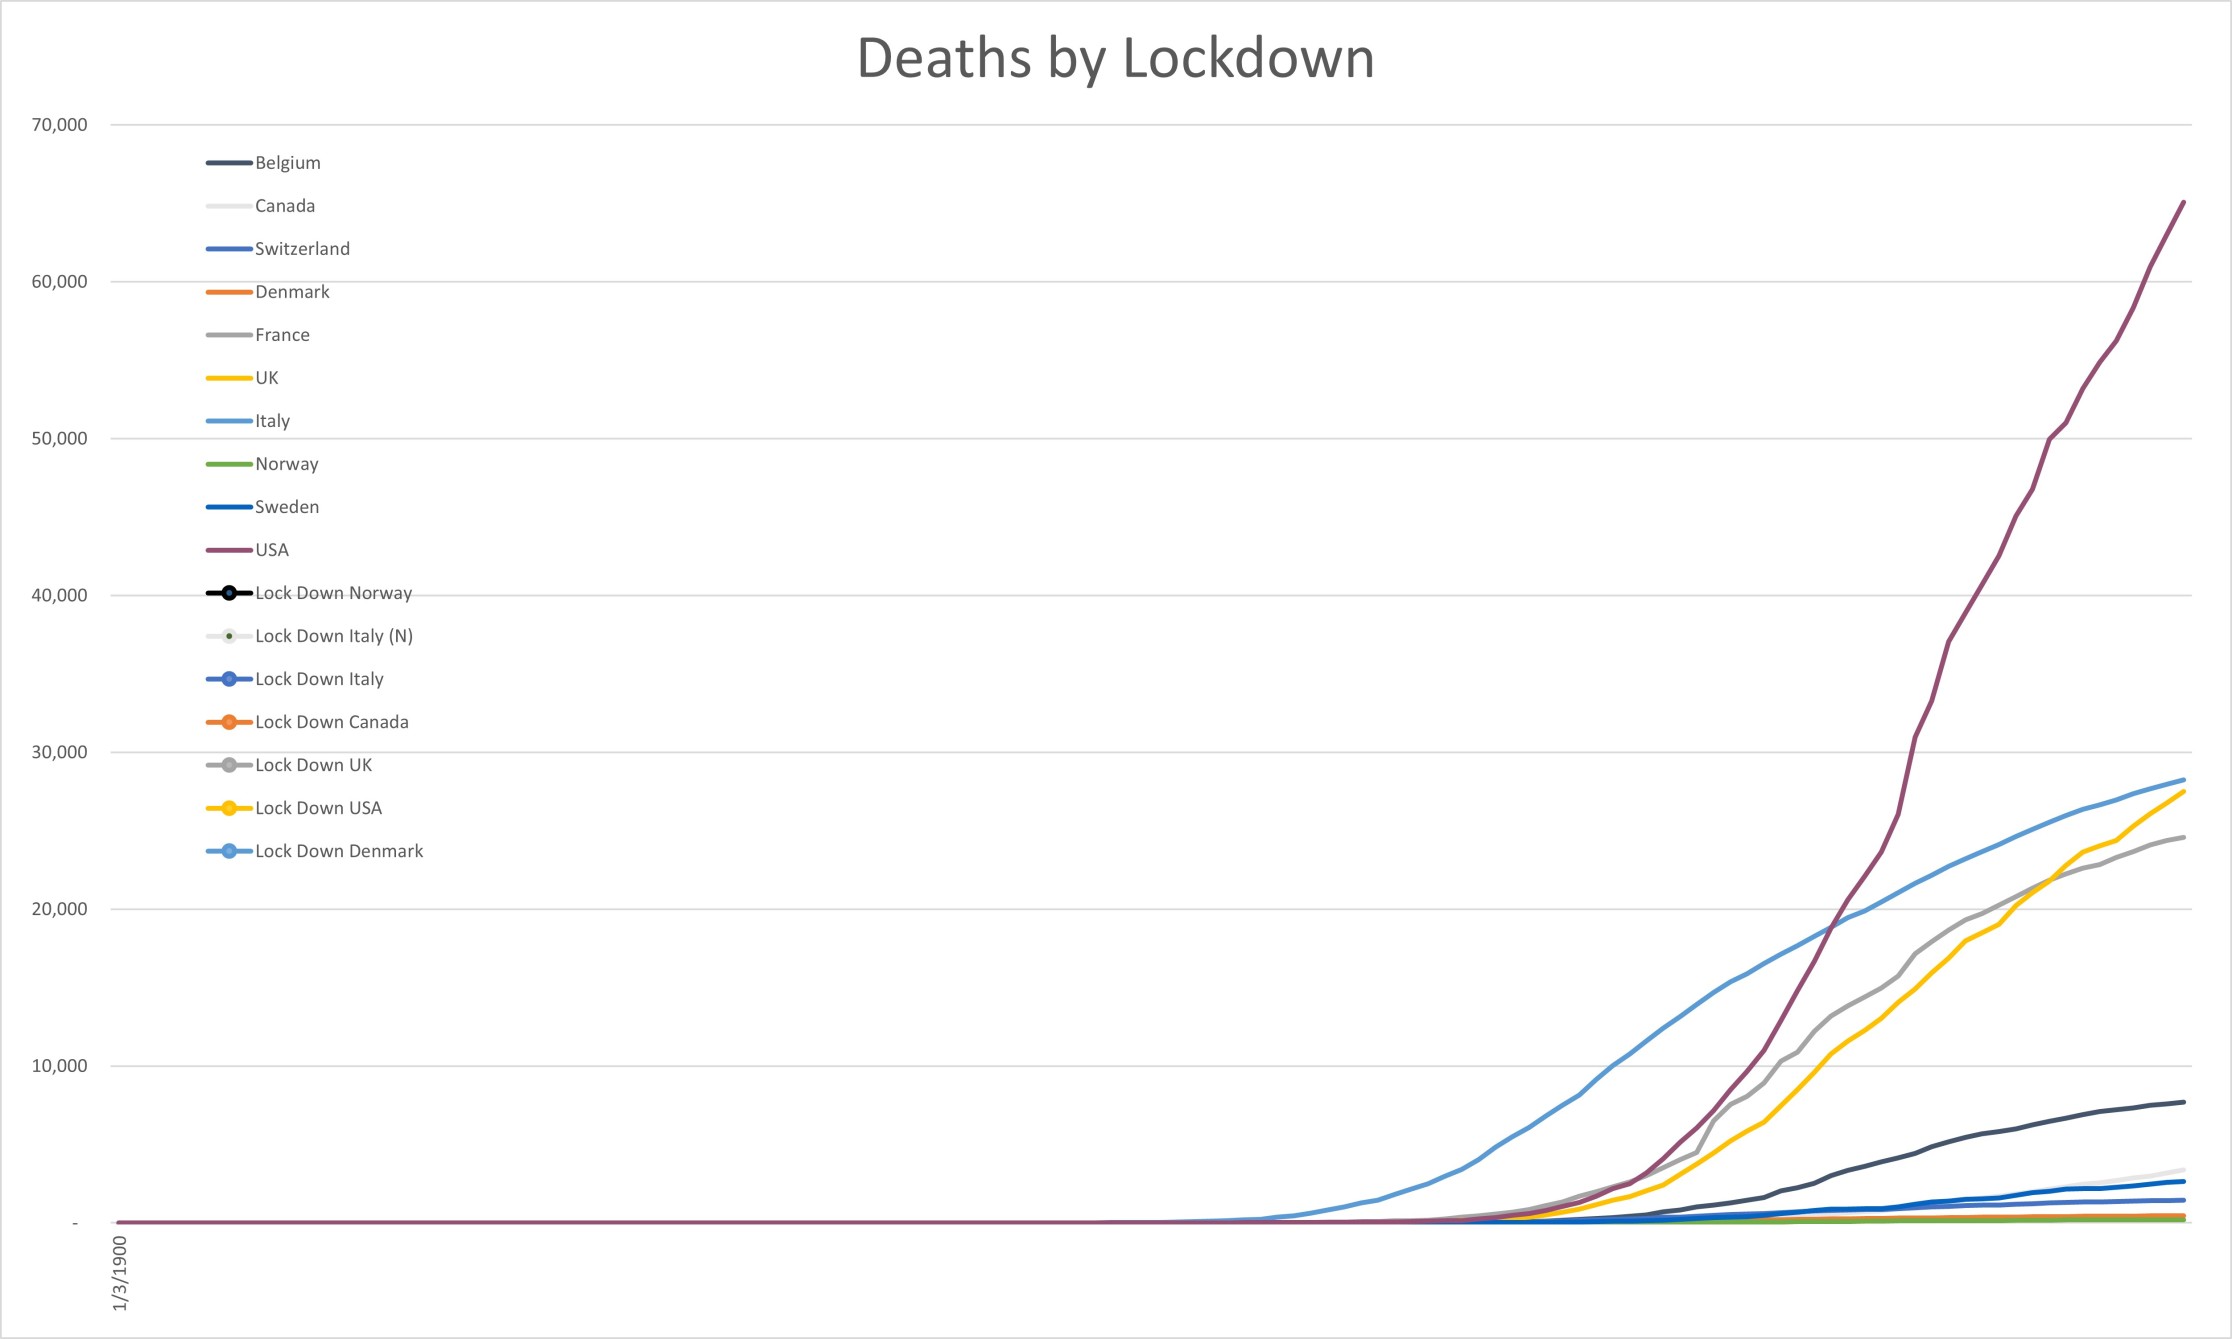
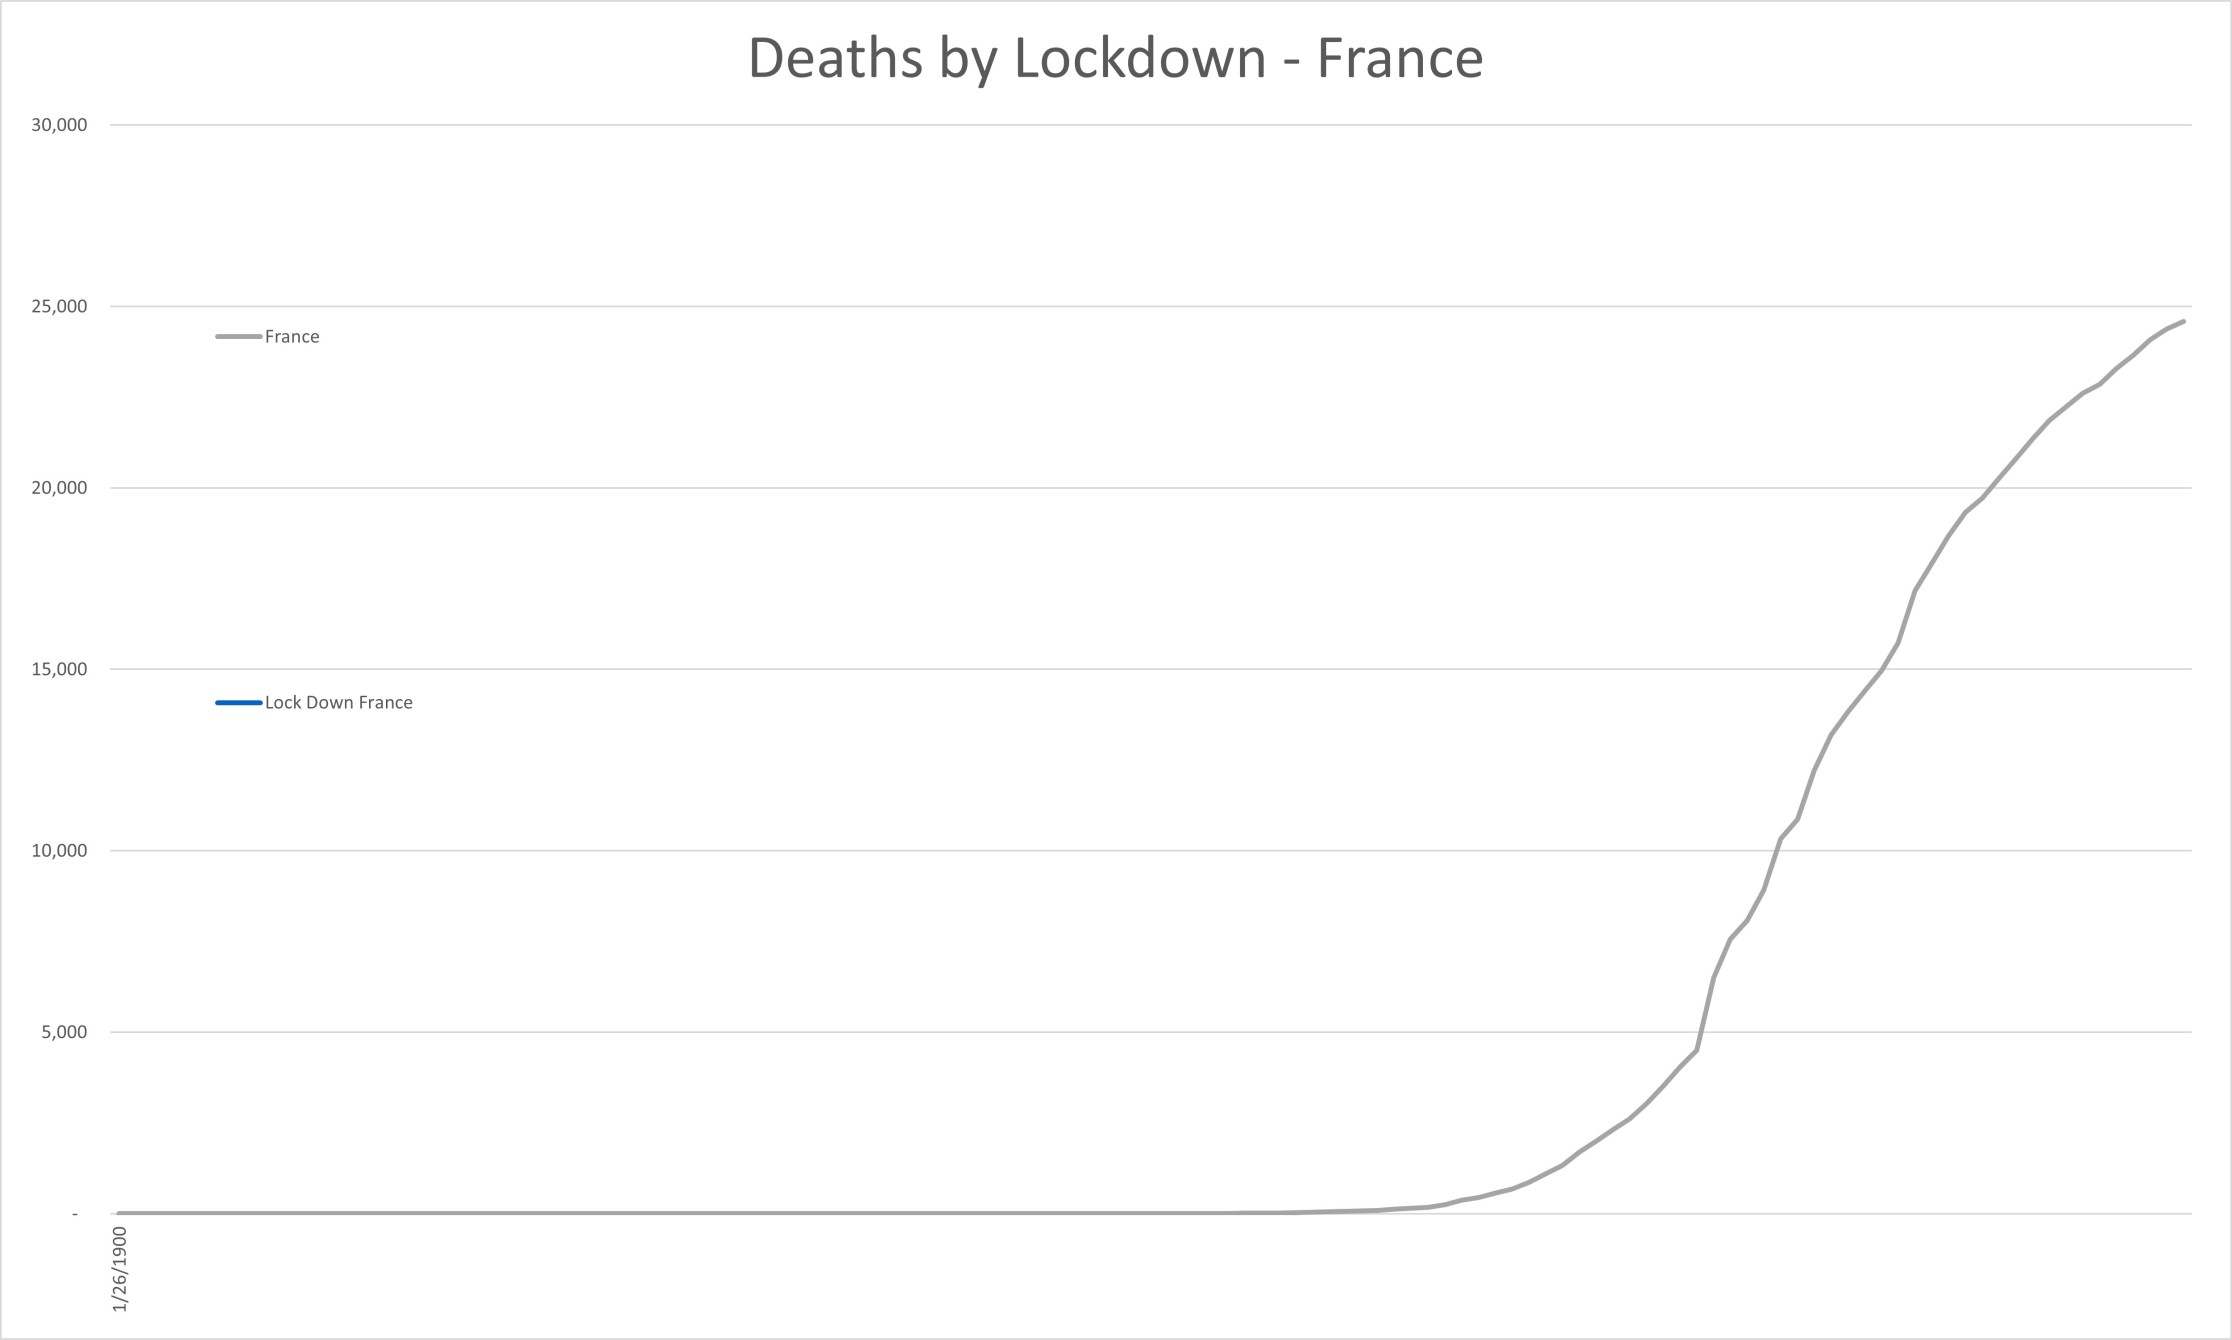
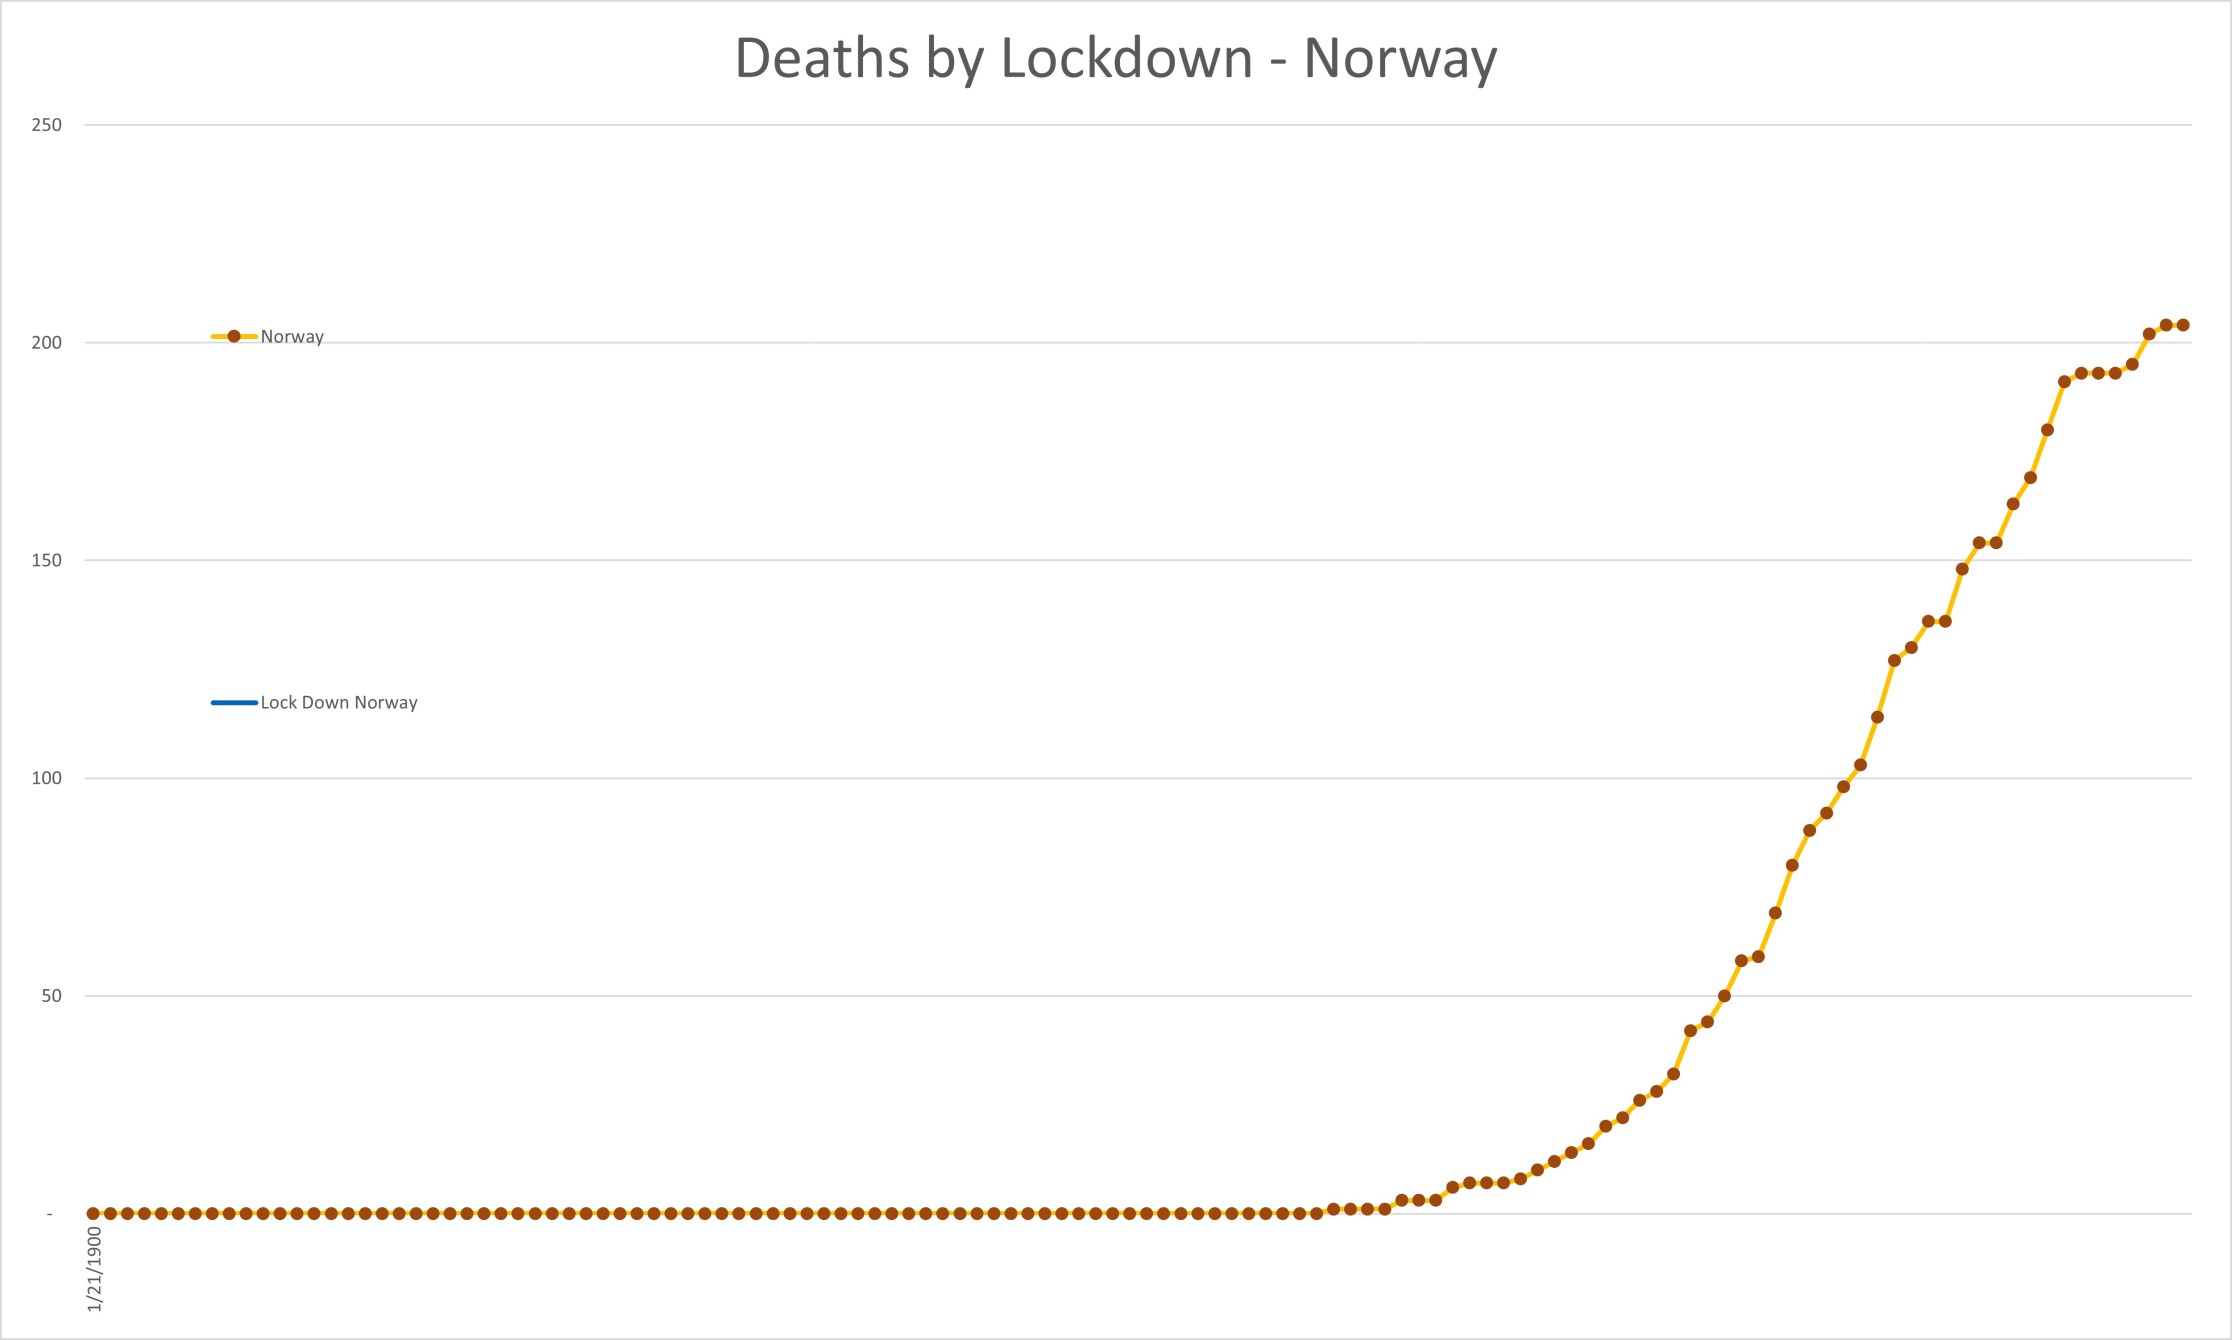
Again, what about Sweden? The same story here.
Why are we not asking these questions when these very numbers are destroying lives daily worldwide? How many deaths are being reported that have resulted from the drastic steps taken already;
This is before we even get to the economic fallout. All the above will continue to rise when COVID 19 is a distant memory.
How many people remember Swine Flu? That is H1N1, the main cause of seasonal flu for many years. Now we call it seasonal flu.
Ask yourself, how can the rate of deaths match the exact same curve in every country? How can reported cases have spiked right after the lockdowns? How can deaths follow the exact same curve as the reported cases?
BECAUSE WE ARE TRACKING TEST KITS, NOT LIVES.
We have viable treatments for this particular Coronavirus, unlike most others like H1N1.
The vast majority of people who contract COVID 19 recover after mild to moderate symptoms. We can’t wait for a vaccine. We can’t stay inside forever.
We didn't beat SARS, MERS, H1N1 and H5N1 by shutting down society. We developed herd imunity, followed common sense protocols and eventually developed a vaccine. This time around, we also have treatment protocols to add to our arsenal in this fight.
It is time to stop the panic, bring back some semblance of normality. Everyone’s physical, mental and economic health is under siege. It’s not too late to save us all. Contact everyone you know from the highest levels of government to your closest friends and family. Share this message far and wide. Don’t wait until it’s too late. The clock is ticking for us all.
As the media fiddles, we are watching Rome burn. Only China appears ready to rise from the ashes. So, don't be a Nero. Join the conversation beyond the four corners of your TV and help us climb out of this hole before it is too late. #COVID19, #RomeIsBurning, #ABetterPlan, #jointheconversation
Now back to your regularly scheduled 'programming' update. Welcome to Stepford, 1984 style. How a to program a population to accept the 'new normal'.
Remember to eat your Soylent Greens.